AI Generated Exam Paper
Secondary 1 Geography Practice Paper 3
Free Sec 1 Geography Practice Paper 3, AI version, with questions, answers, and syllabus-aligned practice for Singapore students.
These static practice materials are generated from the site's syllabus and paper-generation workflow, with source and model context shown so students and parents can evaluate the material before use.
Questions
TuitionGoWhere Practice Paper - Geography Secondary 1
TuitionGoWhere Practice Paper (AI) - Version 3
Subject: Geography
Level: Secondary 1
Paper: Map Graph Data Skills Practice
Duration: 1 hour 30 minutes
Total Marks: 50
Name: ________________
Class: ________________
Date: ________________
Instructions
- This paper consists of Section A (Multiple Choice), Section B (Structured Questions), and Section C (Data Response).
- Answer ALL questions.
- Write your answers in the spaces provided.
- For multiple choice questions, shade the correct option clearly.
- All diagrams are not drawn to scale unless otherwise stated.
- You may use a calculator where appropriate.
Section A: Multiple Choice Questions [10 marks]
Choose the best answer for each question. Shade your choice clearly.
Question 1 [1 mark] What is the 4-figure grid reference of the temple shown in the map extract?
A) 2847
B) 4728
C) 2874
D) 4782
Question 2 [1 mark] The contour interval on a topographic map is 20 metres. If one contour line shows 140m and the next shows 160m, what height would you expect to find halfway between them?
A) 145m
B) 150m
C) 155m
D) 160m
Question 3 [1 mark] Which of the following map symbols typically represents a deciduous forest?
A) Green circles with dots
B) Green triangular shapes
C) Brown contour lines
D) Blue wavy lines
Question 4 [1 mark] On a map with a scale of 1:50,000, what distance on the ground does 2 cm on the map represent?
A) 500m
B) 1km
C) 1.5km
D) 2km
Question 5 [1 mark] When reading a 6-figure grid reference, the first three digits represent:
A) Northings to the nearest 100m
B) Eastings to the nearest 100m
C) Eastings to the nearest 10m
D) The grid square number
Section B: Structured Questions [25 marks]
Question 6 [5 marks] Study Figure 1, which shows temperature readings collected by students at different times of day at Marina Bay.
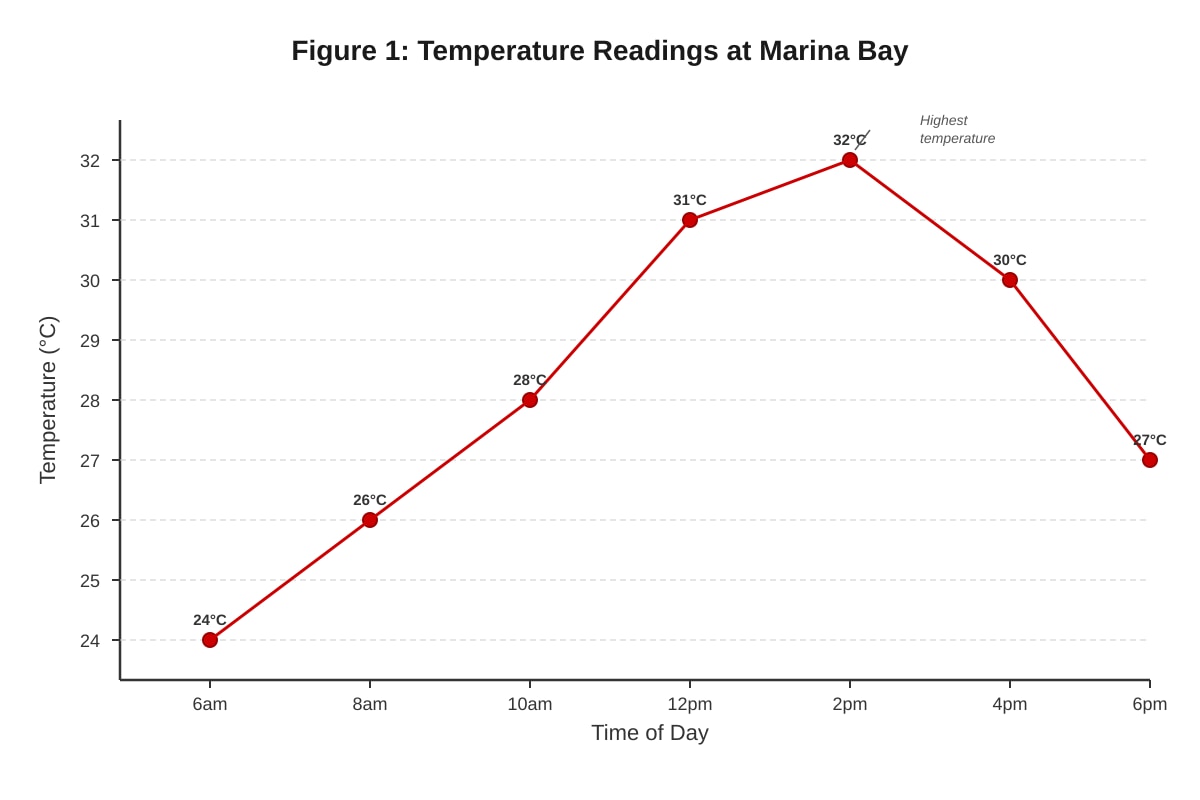
Generated figure for this question.
(a) State the highest temperature recorded during the day. [1]
_________________°C
(b) Describe the pattern of temperature change from 6am to 6pm. [2]
(c) Suggest one reason why the temperature was highest at 2pm. [2]
Question 7 [6 marks] Figure 2 shows a topographic map extract of part of Singapore.
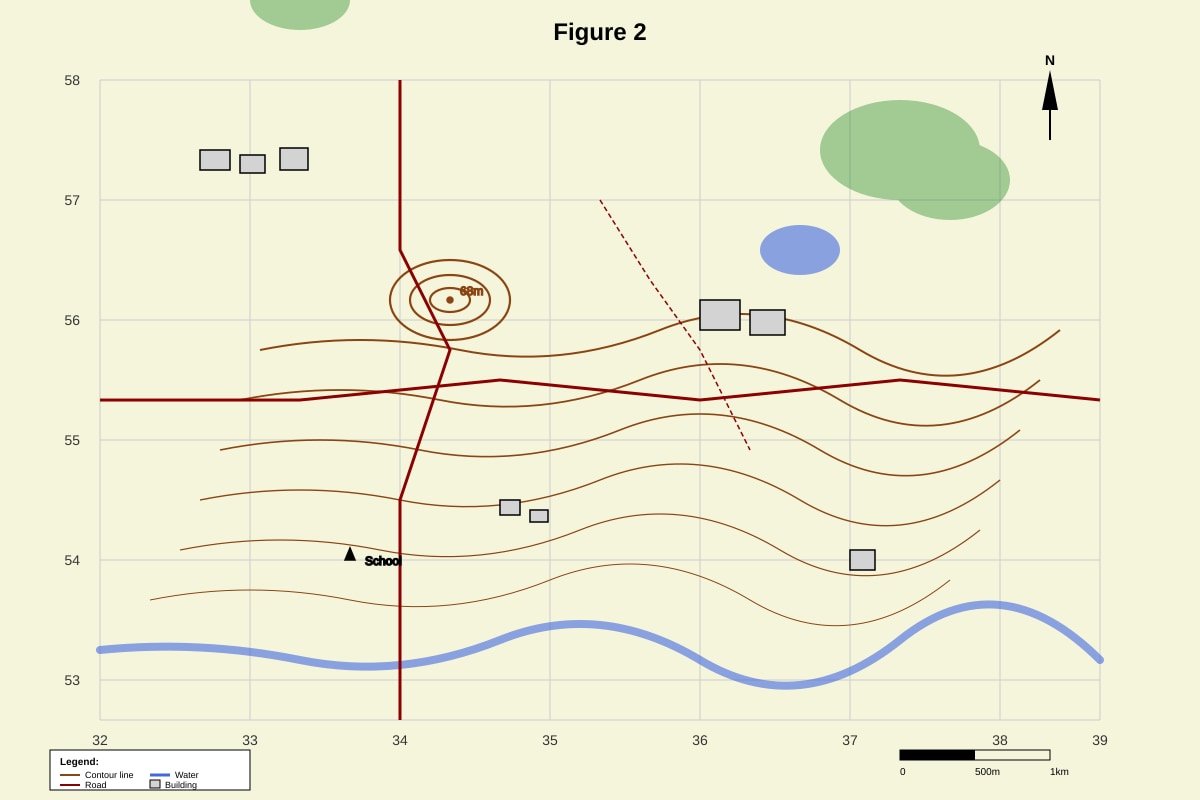
Generated figure for this question.
(a) State the 6-figure grid reference of the school marked with a triangle symbol. [1]
(b) Identify the type of landform found in grid square 3456. [1]
(c) Explain how you can tell from the contour lines that the eastern slope of the hill is steeper than the western slope. [2]
(d) A student wants to walk from the school to the summit of the hill. Suggest the best route and explain your choice. [2]
Question 8 [7 marks] Students conducted a water quality investigation at three sites along Kallang River. Their results are shown in Table 1.
Table 1: Water Quality Data
| Site | Location | pH | Dissolved Oxygen (mg/L) | Turbidity (NTU) |
|---|---|---|---|---|
| A | Upstream (forest area) | 7.2 | 8.5 | 12 |
| B | Middle (residential area) | 6.8 | 6.2 | 28 |
| C | Downstream (industrial area) | 6.3 | 4.1 | 45 |
(a) Which site has the best water quality? Give one piece of evidence to support your answer. [2]
Site: _________________
Evidence: _______________________________________________________________
(b) Describe the pattern shown by the dissolved oxygen levels from Site A to Site C. [2]
(c) Suggest two reasons why the turbidity increases from upstream to downstream. [3]
Reason 1: ______________________________________________________________
Reason 2: ______________________________________________________________
Question 9 [7 marks] Figure 3 shows Singapore's daily water consumption per person from 2000 to 2020.
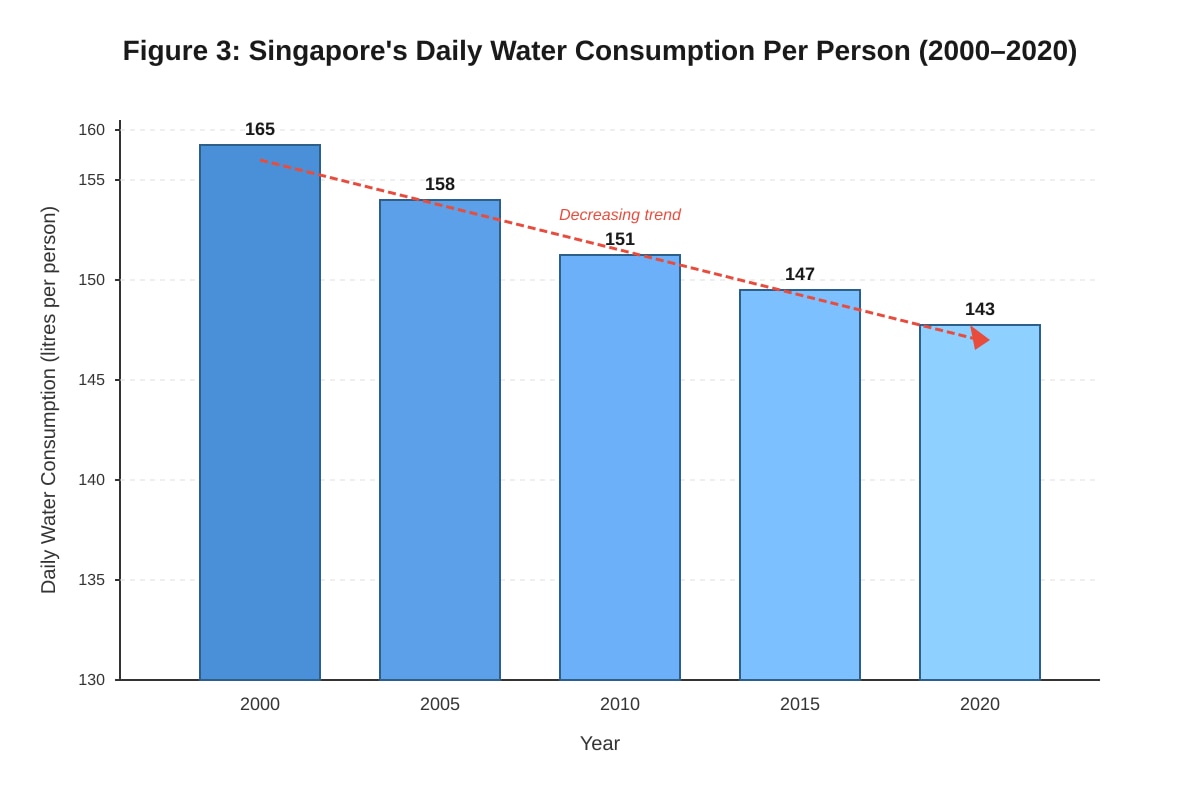
Generated figure for this question.
(a) Calculate the decrease in daily water consumption per person between 2000 and 2020. Show your working. [2]
Working: _______________________________________________________________
Answer: ________________ litres per day
(b) Describe the trend in Singapore's water consumption from 2000 to 2020. [2]
(c) Suggest one reason why Singapore's water consumption per person has decreased over this period. [1]
(d) Explain why reducing water consumption is important for Singapore's water security. [2]
Section C: Data Response [15 marks]
Question 10 [15 marks] Study Figure 4, which shows the results of a mangrove biodiversity survey conducted by Secondary 1 students at Sungei Buloh Nature Park.
Image pending generation for this question.
Table 2: Biodiversity Survey Results
| Site | Distance from Sea (m) | Number of Tree Species | Number of Bird Species | Crab Species Count |
|---|---|---|---|---|
| A | 10 | 3 | 12 | 8 |
| B | 25 | 5 | 15 | 6 |
| C | 40 | 4 | 18 | 4 |
| D | 55 | 2 | 14 | 2 |
| E | 70 | 1 | 8 | 1 |
(a) State the grid reference of Site C using the map provided. [1]
(b) Which site recorded the highest bird species diversity? [1]
Site: _________________
(c) Describe the relationship between distance from sea and crab species count. Use evidence from Table 2. [3]
(d) The students want to investigate why bird diversity varies between sites. Suggest two additional types of data they could collect and explain how each would help their investigation. [4]
Data type 1: ____________________________________________________________
How it helps: __________________________________________________________
Data type 2: ____________________________________________________________
How it helps: __________________________________________________________
(e) Evaluate the reliability of this biodiversity survey. Suggest two ways the students could improve their data collection methods. [4]
Evaluation: ____________________________________________________________
Improvement 1: _________________________________________________________
Improvement 2: _________________________________________________________
(f) Explain why mangrove areas like Sungei Buloh are important for Singapore's biodiversity conservation. [2]
Answers
TuitionGoWhere Practice Paper - Geography Secondary 1
Answer Key and Marking Scheme
Version 3 - Map Graph Data Skills Practice
Section A: Multiple Choice Questions [10 marks]
Question 1 [1 mark] Answer: B) 4728 Explanation: Read eastings first (47), then northings (28). Students often reverse this order.
Question 2 [1 mark] Answer: B) 150m Explanation: Halfway between 140m and 160m = 140 + (160-140)/2 = 150m
Question 3 [1 mark] Answer: A) Green circles with dots Explanation: Standard OS map symbol for deciduous woodland. Coniferous forests use triangular shapes.
Question 4 [1 mark] Answer: B) 1km Explanation: Scale 1:50,000 means 1cm = 500m, so 2cm = 1000m = 1km
Question 5 [1 mark] Answer: C) Eastings to the nearest 10m Explanation: First 2 digits = grid square eastings, 3rd digit = subdivision within square (tenths)
Section B: Structured Questions [25 marks]
Question 6 [5 marks]
(a) Answer: 32°C [1 mark]
- Accept exact reading from graph
(b) Pattern description [2 marks] Sample answer: Temperature increases from 6am (24°C) to reach maximum at 2pm (32°C), then decreases towards 6pm (29°C).
- 1 mark: Identifies increase to maximum
- 1 mark: Identifies decrease after maximum OR gives specific times/temperatures
(c) Reason for highest temperature [2 marks] Sample answer: The sun is at its highest angle in the sky around midday/early afternoon, providing maximum solar radiation and heating.
- 1 mark: Reference to sun position/solar angle
- 1 mark: Link to maximum heating/radiation
Question 7 [6 marks]
(a) 6-figure grid reference [1 mark] Answer: Will vary based on map - e.g., 345567
- Must be exactly 6 figures in correct format
(b) Landform type [1 mark] Answer: Hill/Ridge/Valley (depends on contour pattern shown)
- Accept appropriate landform based on contour evidence
(c) Contour line explanation [2 marks] Sample answer: The contour lines are closer together on the eastern slope, indicating a steeper gradient. Closer contour lines mean a greater change in height over a shorter horizontal distance.
- 1 mark: Identifies closer contour lines on eastern slope
- 1 mark: Explains that closer lines = steeper gradient
(d) Route suggestion [2 marks] Sample answer: Follow the western slope where contour lines are further apart, indicating a gentler gradient that would be easier to climb.
- 1 mark: Suggests appropriate route (avoiding steepest areas)
- 1 mark: Justification based on contour evidence
Question 8 [7 marks]
(a) Best water quality site [2 marks] Answer: Site A Evidence: Highest dissolved oxygen (8.5 mg/L) OR lowest turbidity (12 NTU) OR pH closest to neutral (7.2)
- 1 mark: Correct site identification
- 1 mark: Valid evidence with specific data
(b) Dissolved oxygen pattern [2 marks] Sample answer: Dissolved oxygen decreases from upstream (Site A: 8.5 mg/L) to downstream (Site C: 4.1 mg/L), showing a clear declining trend.
- 1 mark: Identifies decreasing trend
- 1 mark: Uses specific data as evidence
(c) Reasons for increasing turbidity [3 marks] Sample answers:
- Reason 1: Urban runoff from residential areas carries sediments and particles into the river
- Reason 2: Industrial discharge adds suspended particles and pollutants to the water
- Alternative: Erosion from construction sites/reduced vegetation cover/increased human activity
- 1.5 marks per valid reason with explanation
Question 9 [7 marks]
(a) Calculation [2 marks] Working: 165 - 143 = 22 Answer: 22 litres per day
- 1 mark: Correct working shown
- 1 mark: Correct answer with units
(b) Trend description [2 marks] Sample answer: Singapore's water consumption per person shows a steady decrease from 165L in 2000 to 143L in 2020, representing a consistent downward trend over the 20-year period.
- 1 mark: Identifies decreasing trend
- 1 mark: Uses specific data/time period
(c) Reason for decrease [1 mark] Sample answers:
- Water conservation campaigns/education
- More efficient appliances/technology
- Government policies/pricing
- Public awareness of water scarcity
(d) Importance for water security [2 marks] Sample answer: Reducing consumption helps Singapore become less dependent on water imports from Malaysia and extends the lifespan of local water sources, making the country more self-sufficient and resilient to supply disruptions.
- 1 mark: Reference to reduced dependence/self-sufficiency
- 1 mark: Link to resilience/sustainability
Section C: Data Response [15 marks]
Question 10 [15 marks]
(a) Grid reference [1 mark] Answer: Will depend on map provided - e.g., 234567
- Must match the map scale and Site C location
(b) Highest bird diversity site [1 mark] Answer: Site C (18 species)
(c) Relationship description [3 marks] Sample answer: There is a negative relationship between distance from sea and crab species count. As distance from sea increases from 10m to 70m, crab species count decreases from 8 to 1 species. This shows crabs are more diverse closer to the marine environment.
- 1 mark: Identifies negative/inverse relationship
- 1 mark: Uses specific data as evidence
- 1 mark: Explains the pattern with reasoning
(d) Additional data types [4 marks] Sample answers:
- Data type 1: Vegetation height/canopy cover
- How it helps: Different bird species prefer different vegetation layers for nesting and feeding
- Data type 2: Water salinity levels
- How it helps: Salinity affects food availability which influences bird species distribution
- Alternative data: Noise levels, human disturbance, food sources, nesting sites
- 2 marks per data type (1 for appropriate data, 1 for valid explanation)
(e) Reliability evaluation and improvements [4 marks] Evaluation sample: The survey may not be reliable because it was conducted at only one time period and may not represent seasonal variations in species diversity. Improvements:
- Repeat surveys at different times of year to account for seasonal migration
- Increase survey duration at each site to detect more species
- 1 mark: Valid evaluation of reliability
- 1 mark: Logical improvement 1
- 1 mark: Logical improvement 2
- 1 mark: Clear explanation of how improvements increase reliability
(f) Importance for biodiversity conservation [2 marks] Sample answer: Mangrove areas provide critical habitat for many species that cannot survive elsewhere, acting as nurseries for marine life and stopover points for migratory birds, thus maintaining Singapore's overall biodiversity.
- 1 mark: Reference to unique/critical habitat function
- 1 mark: Specific example or broader conservation benefit
Marking Notes
General Marking Principles:
- Award marks for scientifically accurate content even if wording differs from sample answers
- Look for evidence of geographical thinking and data interpretation skills
- Credit alternative valid explanations that demonstrate understanding
- Ensure students reference data/figures when specifically requested
- Be consistent with mark allocation across similar question types
Common Student Errors to Watch:
- Grid reference order confusion (eastings/northings)
- Describing data without explaining patterns
- Failing to use evidence when requested
- Confusing correlation with causation in data interpretation
- Incomplete explanations that don't address the command word
Grade Boundaries (Suggested):
- A: 42-50 marks (84-100%)
- B: 35-41 marks (70-82%)
- C: 28-34 marks (56-68%)
- D: 21-27 marks (42-54%)
- E: 15-20 marks (30-40%)
Free quiz and exam paper access
Enter your details to view this paper
Your access is remembered on this device.