AI Generated Exam Paper
Secondary 1 Geography Practice Paper 2
Free Sec 1 Geography Practice Paper 2, HY3 AI version, with questions, answers, and syllabus-aligned practice for Singapore students.
These static practice materials are generated from the site's syllabus and paper-generation workflow, with source and model context shown so students and parents can evaluate the material before use.
Questions
TuitionGoWhere Practice Paper - Geography Secondary 1
TuitionGoWhere Practice Paper (AI) — Version 2 of 5
Subject: Geography
Level: Secondary 1
Paper: Practice Paper (Topic: Map Graph Data Skills)
Duration: 45 minutes
Total Marks: 40
Name: ________________________
Class: ________
Date: ________
Instructions
- This practice paper has 20 questions across three sections.
- Answer all questions in the spaces provided.
- Read each question carefully and use the maps, tables, and figures given.
- Marks for each question are shown in brackets [ ].
- Section totals add up to 40 marks.
Section A: Map Reading (Questions 1–8) [16 marks]
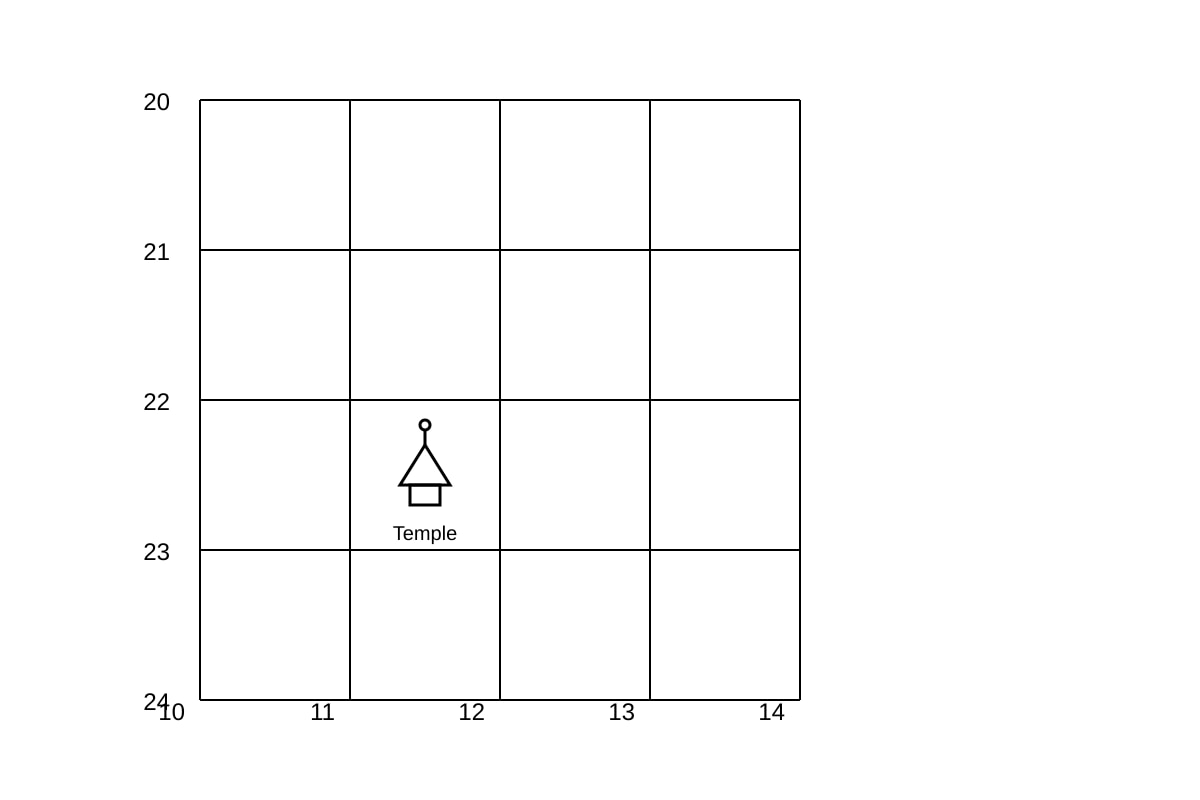
1. Study the map extract below. State the 4-figure grid reference of the temple. [1]
Image pending generation: map for Q1.
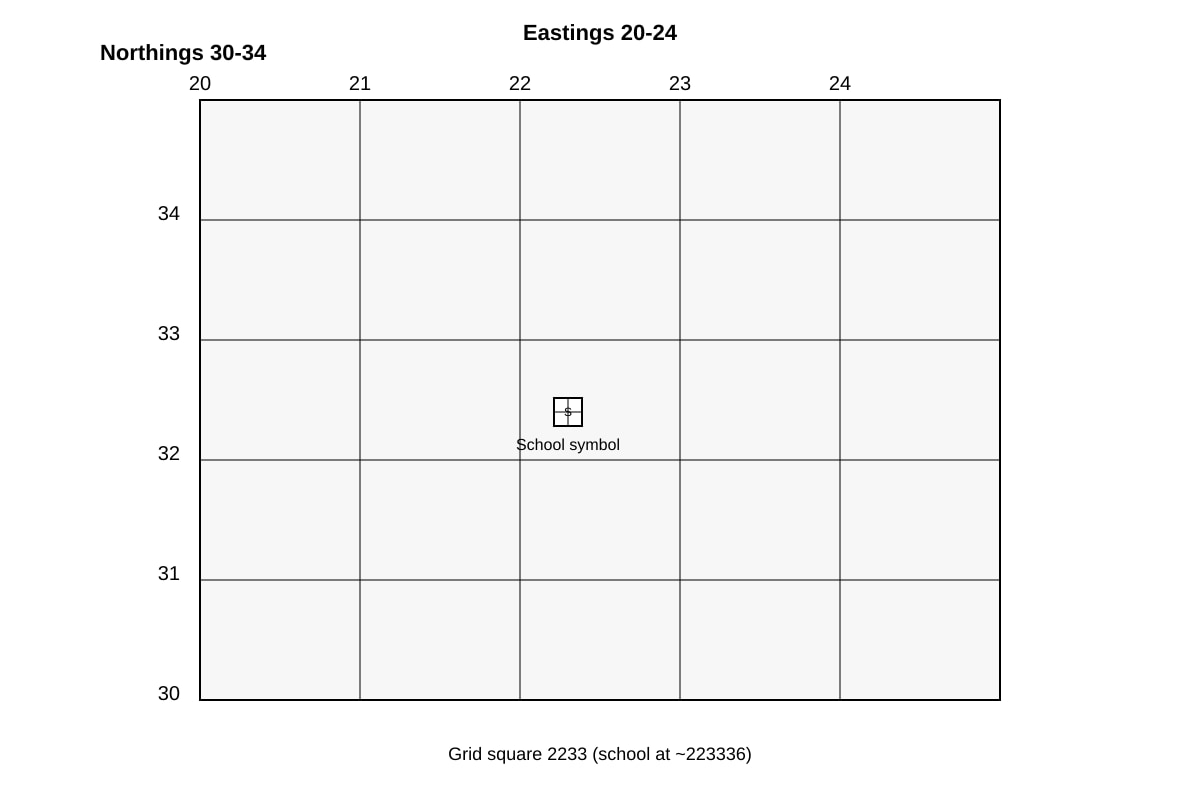
2. State the 6-figure grid reference of the school shown in the map below. [1]
Image pending generation: map for Q2.
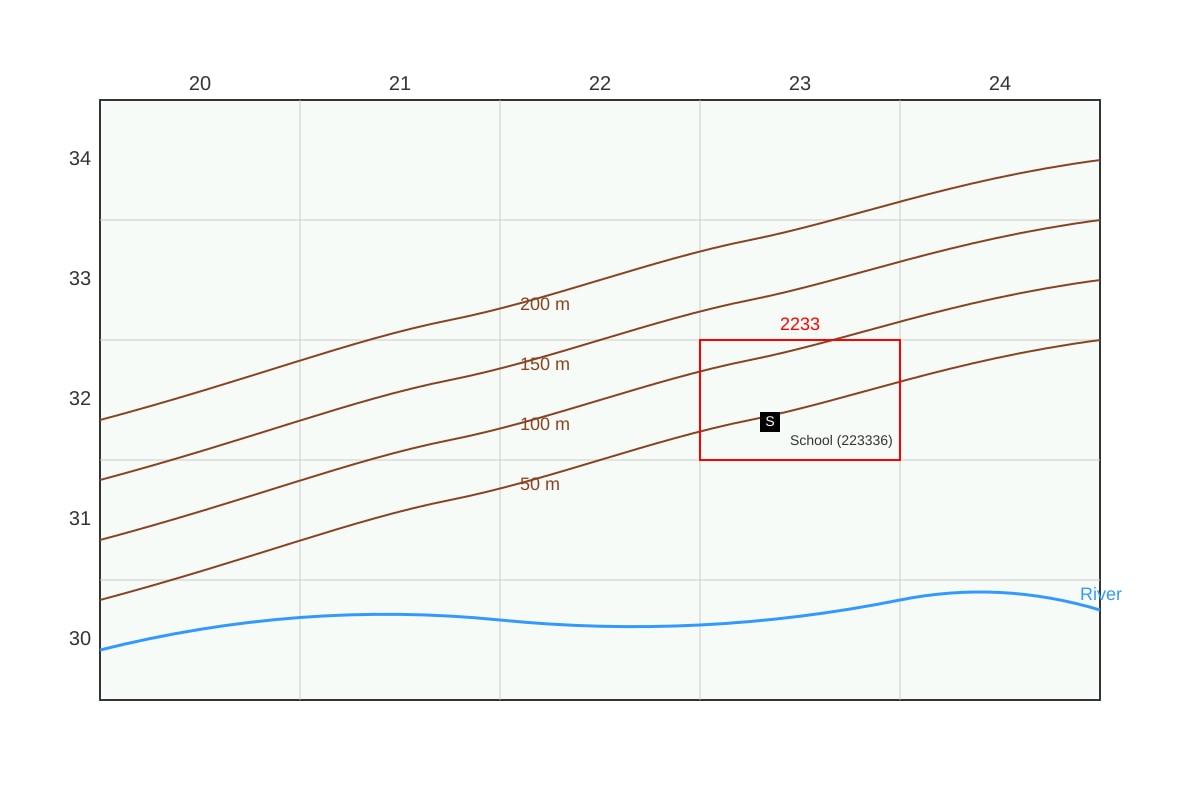
3. State the contour interval of the topographic map below. [1]
Image pending generation: map for Q3.
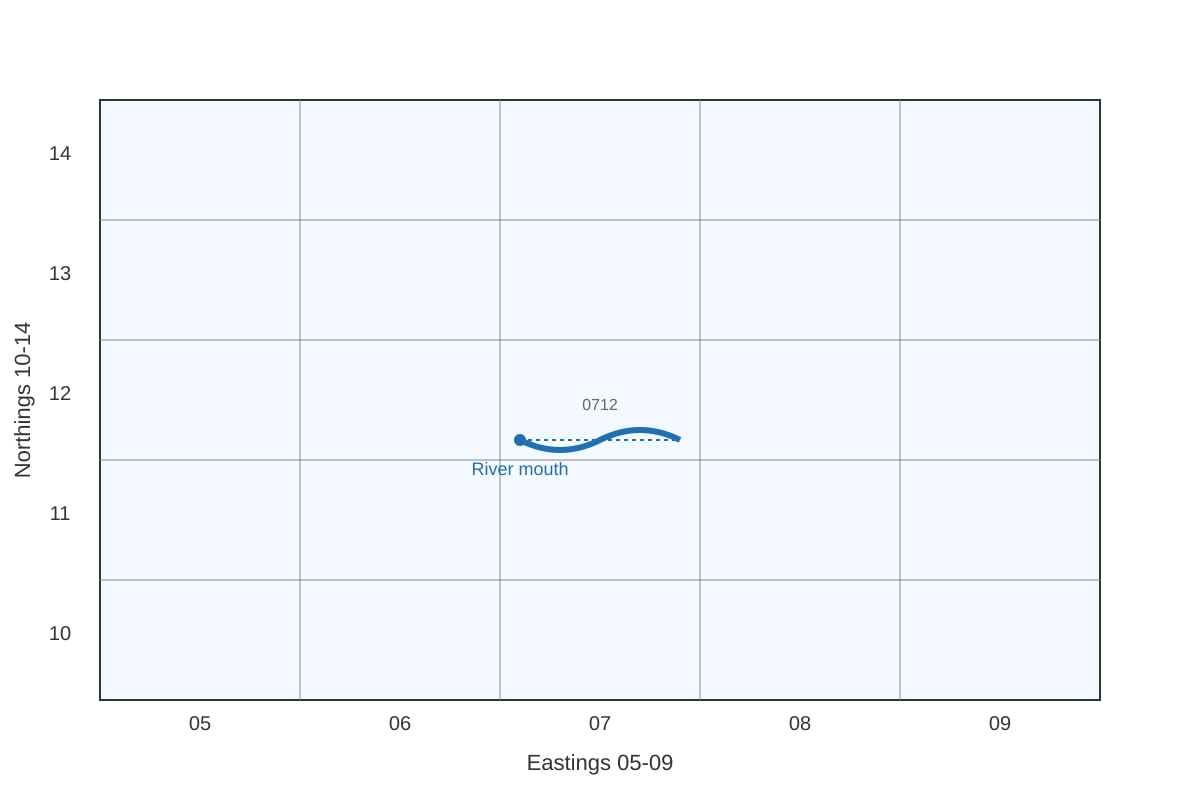
4. State the 4-figure grid reference of the river mouth shown on the map. [1]
Image pending generation: map for Q4.
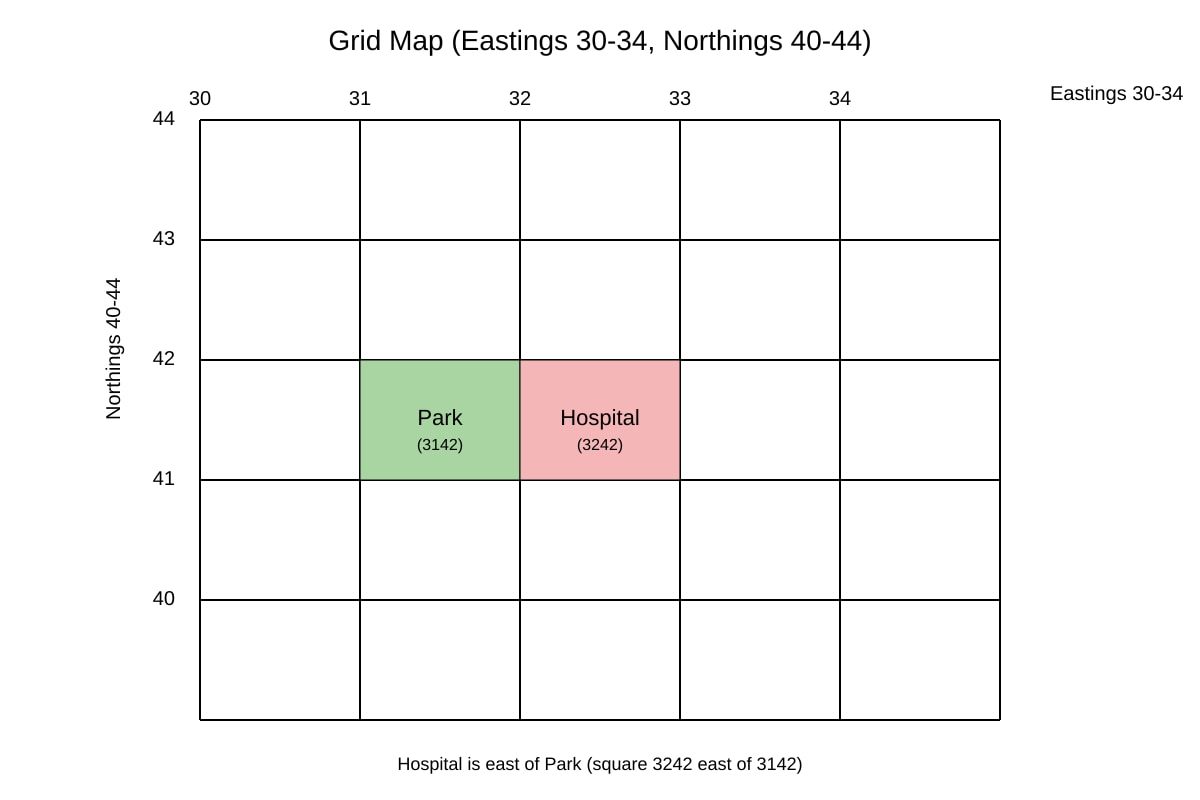
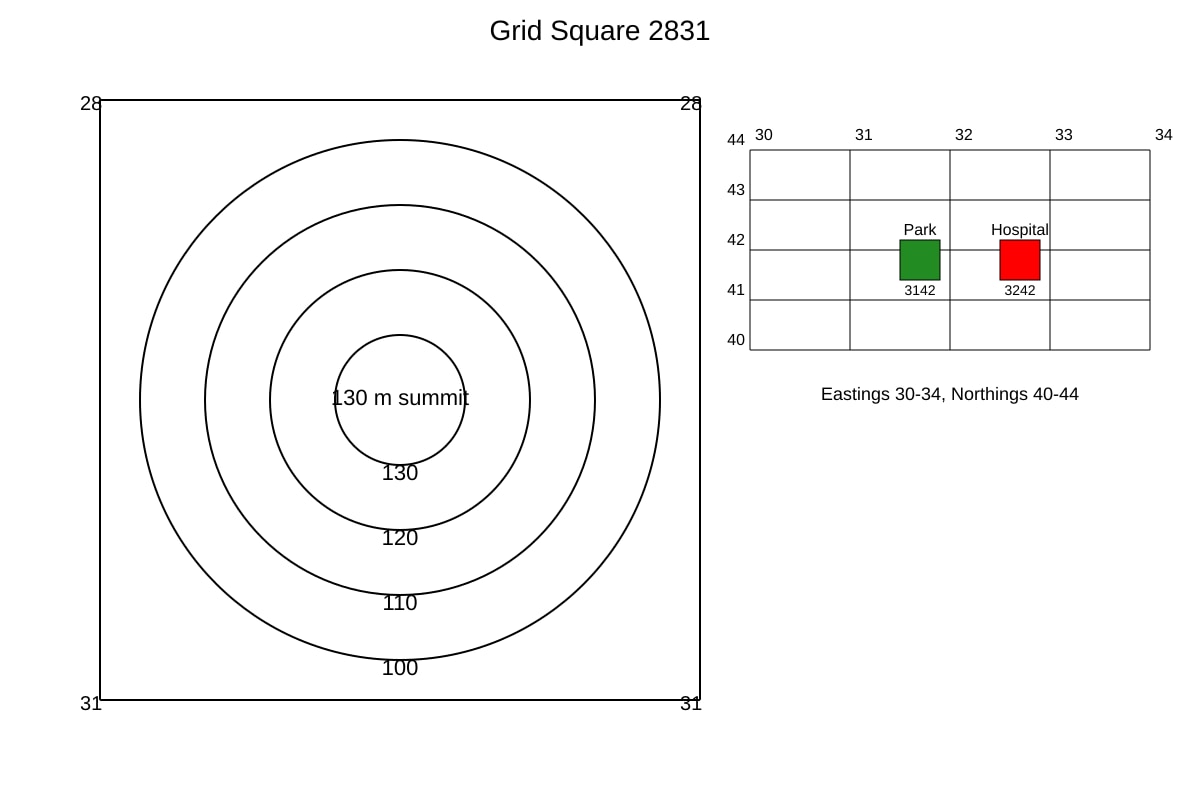
5. Give the 4-figure grid reference of the hospital that is east of the park. [2]
Image pending generation: map for Q5.
6. Study the contour lines in grid square 2831. Describe the landform shown. [3]
Image pending generation: map for Q6.
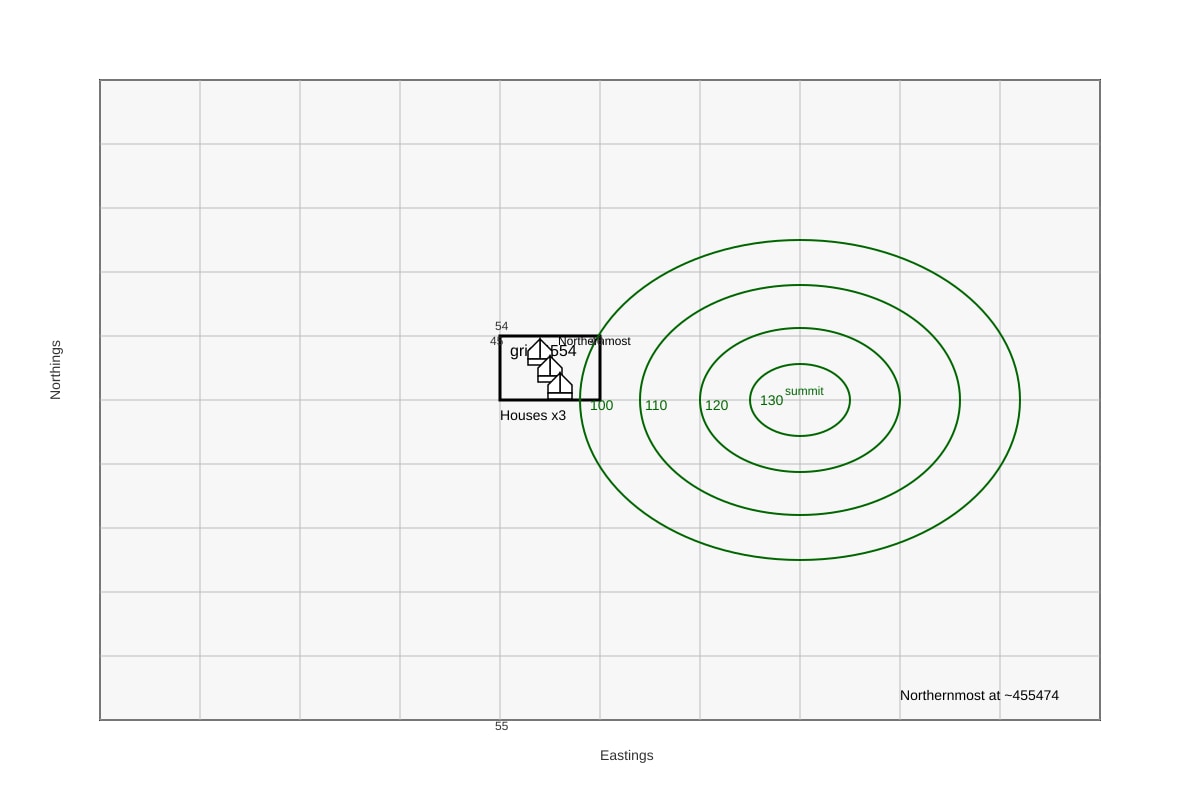
7. State the 6-figure grid reference of the northernmost house in grid square 4554. [2]
Image pending generation: map for Q7.
8. What is the map scale if 1 cm on the map represents 500 m on the ground? Write as a ratio. [2]
Section B: Graph & Table Interpretation (Questions 9–14) [12 marks]
9. Study the table below. State which planet has the greatest number of moons. [1]
| Planet | Distance from Sun (million km) | Number of Moons | Diameter (km) |
|---|---|---|---|
| Mercury | 58 | 0 | 4879 |
| Venus | 108 | 0 | 12104 |
| Earth | 150 | 1 | 12756 |
| Mars | 228 | 2 | 6792 |
| Jupiter | 778 | 95 | 142984 |
10. Using the table in Q9, describe the pattern of diameter from Mercury to Jupiter. [3]
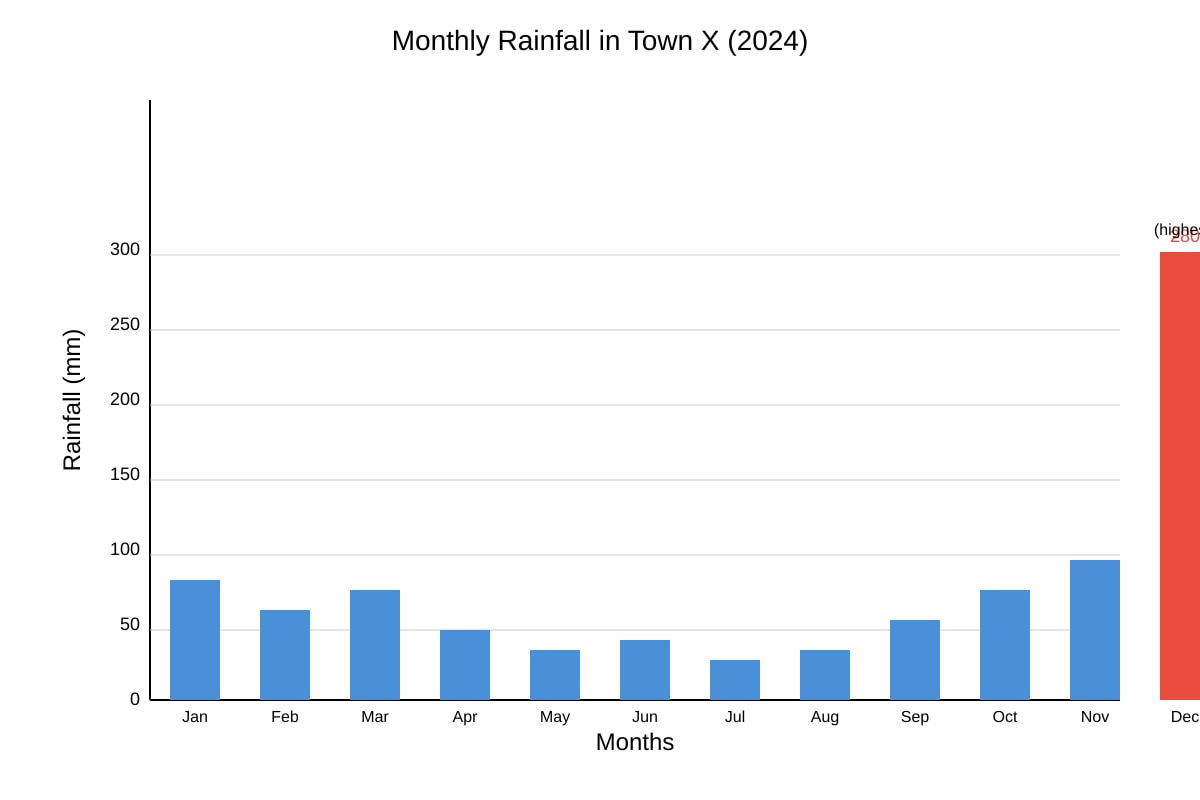
11. Study the bar graph below showing monthly rainfall in mm for Town X in 2024. State the month with the highest rainfall. [1]
Image pending generation: graph for Q11.
12. With reference to the graph in Q11, calculate the total rainfall for the first quarter (Jan–Mar) if Jan=120 mm, Feb=90 mm, Mar=110 mm. [2]
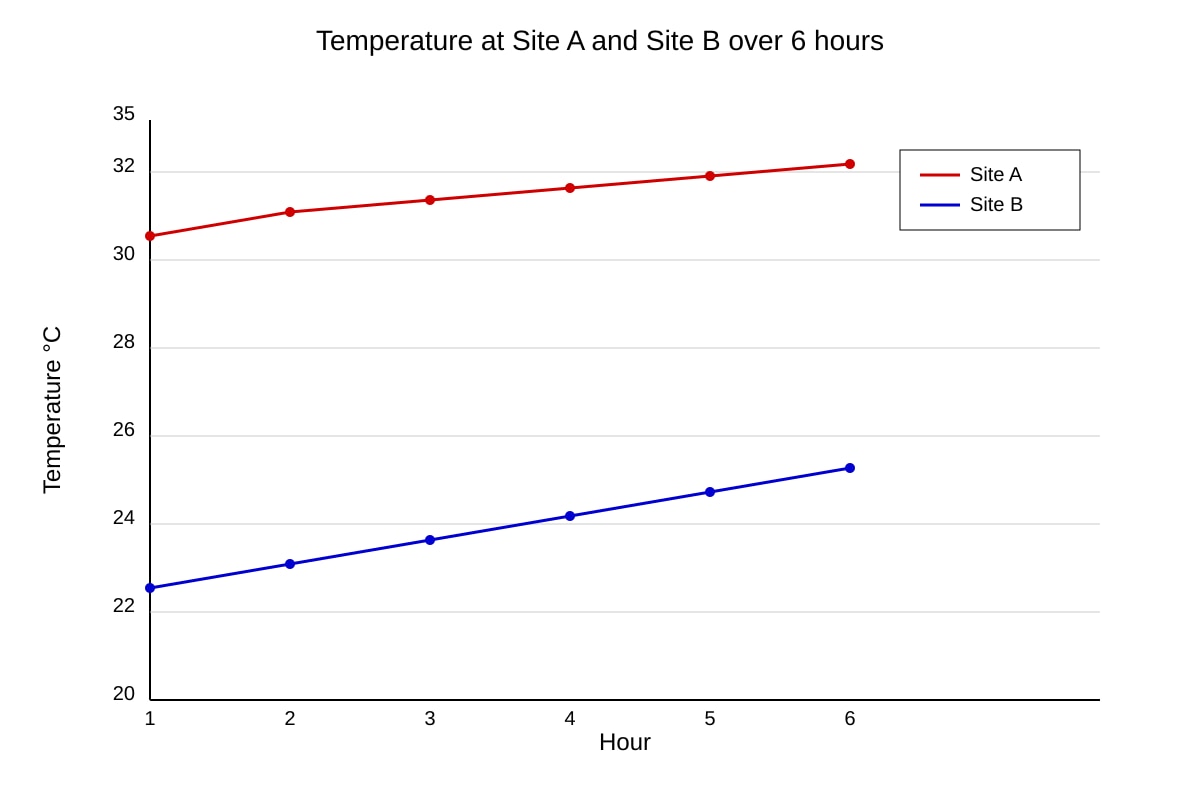
13. Study the line graph below of temperature at Site A and Site B over 6 hours. Describe one difference between the two sites. [2]
Image pending generation: graph for Q13.
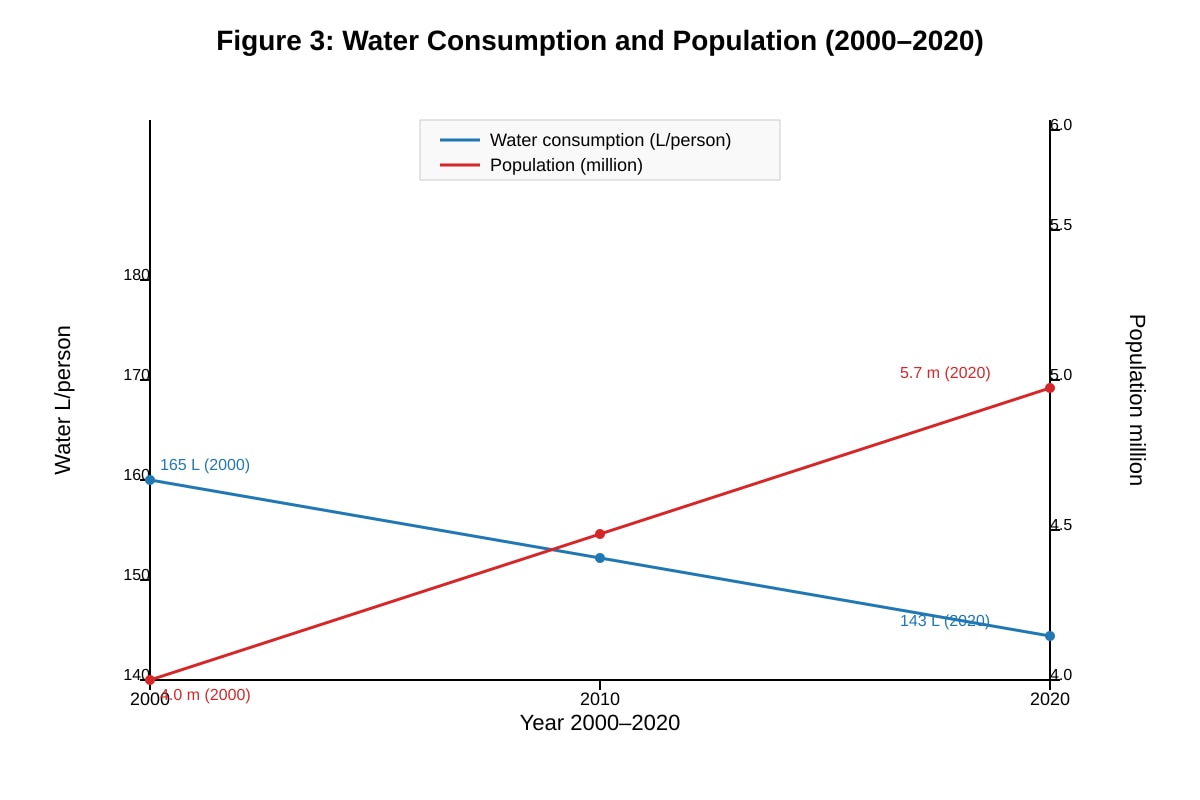
14. Compare the trends in water consumption and population from 2000 to 2020 using Figure 3 below. [3]
Image pending generation: graph for Q14.
Section C: Applied Data Skills (Questions 15–20) [12 marks]
15. A class tested water quality at two sites. Site 1: dissolved oxygen 8 mg/L, turbidity 2 NTU. Site 2: dissolved oxygen 4 mg/L, turbidity 10 NTU. Which site has healthier water? Give one reason. [2]
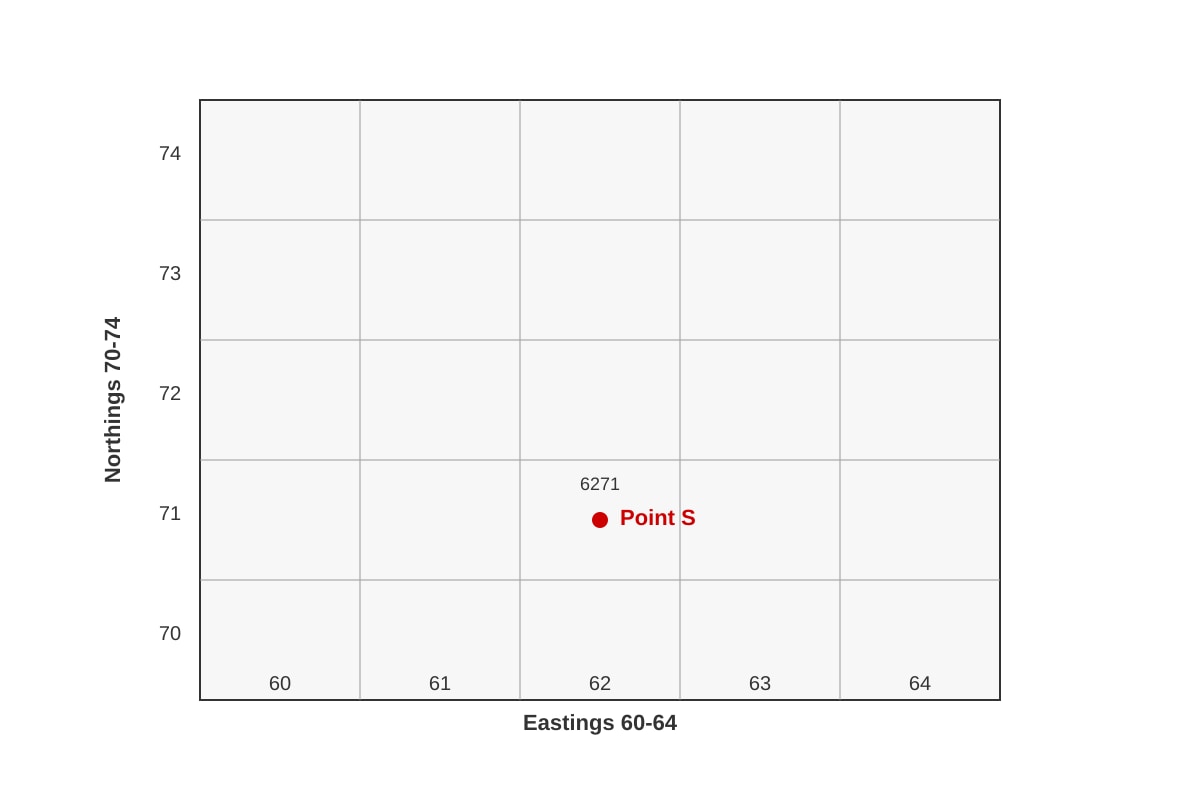
16. Study the map of a fieldwork area below. State the 4-figure grid reference of the sampling point labelled S. [1]
Image pending generation: map for Q16.
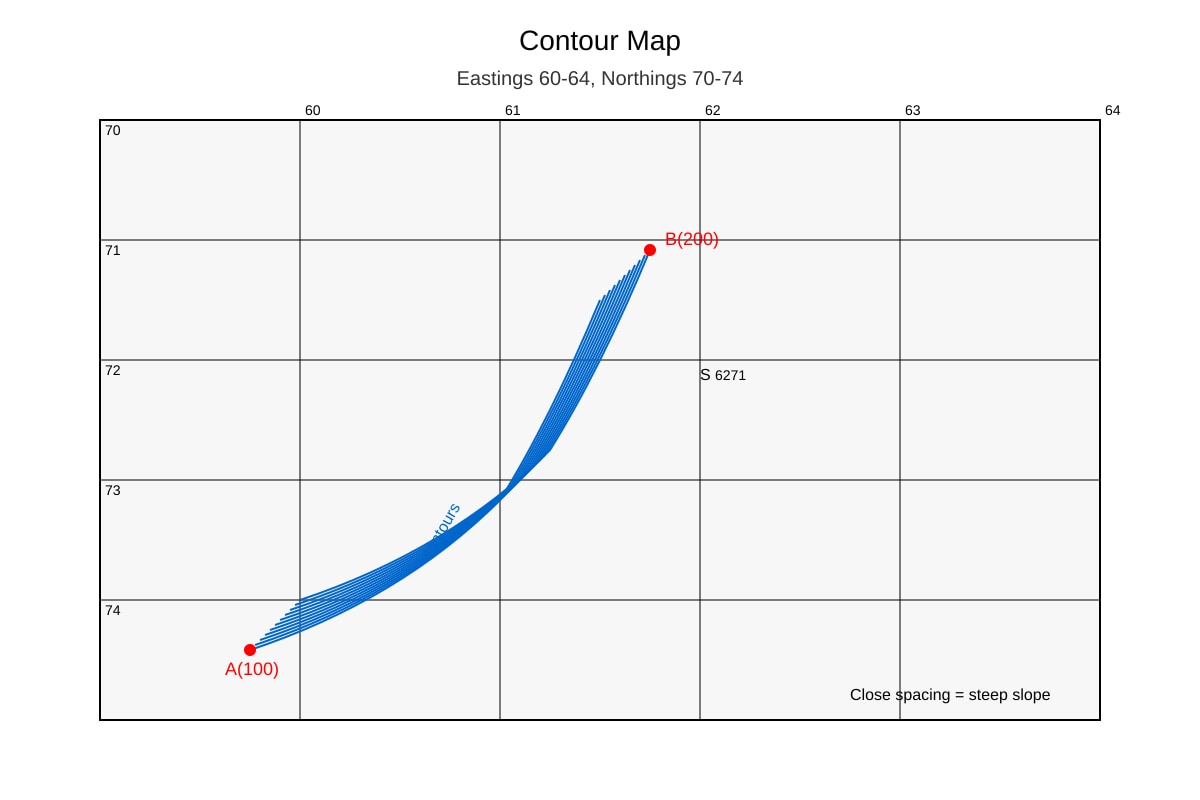
17. Using the contour map below, state whether the slope from A to B is steep or gentle. Explain. [2]
Image pending generation: map for Q17.
18. The table shows land use in a town. Calculate the percentage of land used for housing if total area is 200 km² and housing is 80 km². [2]
| Land Use | Area (km²) |
|---|---|
| Housing | 80 |
| Park | 50 |
| Industry | 40 |
| Roads | 30 |
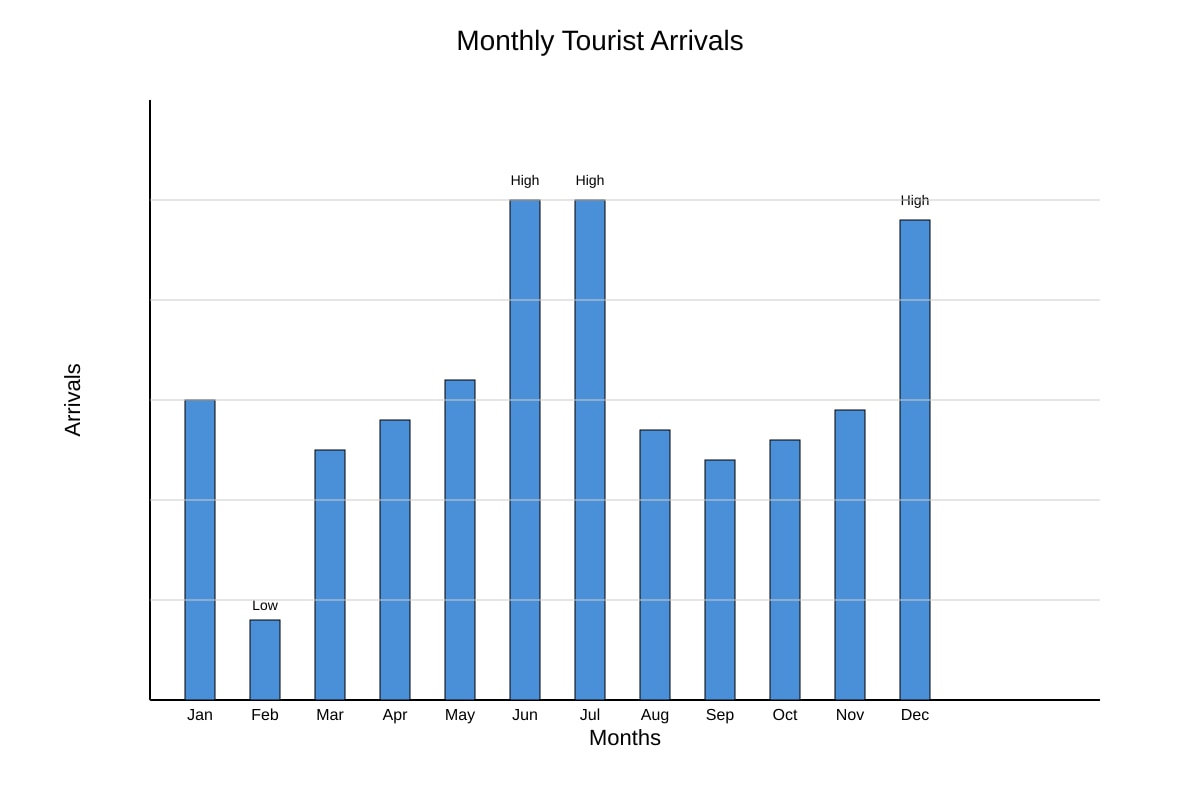
19. Describe two ways the bar graph below shows a seasonal pattern in tourist arrivals. [2]
Image pending generation: graph for Q19.
20. A student drew a field sketch. State two features that should be labelled in a field sketch of a river bend. [3]
Answers
TuitionGoWhere Practice Paper Answer Key — Geography Secondary 1 (Version 2)
Total Marks: 40
Topic: Map Graph Data Skills
Section A: Map Reading (16 marks)
Q1 [1]
Answer: 1222
Teaching note: Read easting (across, 12) first, then northing (up, 22). Lower-left corner of the square containing the temple. Common mistake: reversing order to 2212.
Q2 [1]
Answer: 223336 (acceptable 223335–223337)
Teaching note: 4-figure = 2233. Subdivide square into 10: school is ~3/10 east, 6/10 north → 223336. Mark for correct 6-figure format.
Q3 [1]
Answer: 50 m
Teaching note: Contour interval = difference between adjacent labelled contours (100−50 = 50). Not the scale.
Q4 [1]
Answer: 0712
Teaching note: Easting 07, northing 12 (lower-left of square with river mouth).
Q5 [2]
Answer: 3242 [2]
Marking: 1 mark grid ref, 1 mark correct identification east of park.
Teaching note: Park 3142, hospital east = higher easting = 3242.
Q6 [3]
Answer: A hill [1]; concentric contours with values increasing towards centre [1]; summit about 130 m [1].
Teaching note: Concentric closing contours show a hill. Steeper if lines close; here just identify.
Q7 [2]
Answer: 455474 (range 455472–455476) [2]
Marking: 1 for 4554, 1 for subdivision north.
Teaching note: Northernmost = highest northing fraction.
Q8 [2]
Answer: 1 : 50 000 [2]
Working: 500 m = 50 000 cm. Ratio = 1 cm : 50 000 cm = 1:50 000.
Teaching note: Convert ground distance to cm before ratio.
Section B: Graph & Table (12 marks)
Q9 [1]
Answer: Jupiter
Teaching note: Table shows Jupiter 95 moons, highest.
Q10 [3]
Answer: Diameter increases from Mercury (4879 km) to Jupiter (142 984 km) [1]; generally larger for planets further from Sun [1]; Earth and Venus similar but bigger than Mercury/Mars [1].
Teaching note: Use comparative language and figures.
Q11 [1]
Answer: December
Teaching note: Tallest bar = 280 mm.
Q12 [2]
Answer: 320 mm [2]
Working: 120 + 90 + 110 = 320 mm.
Teaching note: Q1 total of Jan–Mar.
Q13 [2]
Answer: Site A temperature higher than Site B throughout [1]; difference about 8°C [1].
Teaching note: Read both lines, state difference with evidence.
Q14 [3]
Answer: Water consumption fell 165→143 L [1]; population rose 4.0→5.7 m [1]; opposite trends show efficiency [1].
Teaching note: Cite figure values, compare direction.
Section C: Applied (12 marks)
Q15 [2]
Answer: Site 1 [1]; higher dissolved oxygen and lower turbidity indicate healthier [1].
Teaching note: DO 8 > 4, turbidity 2 < 10.
Q16 [1]
Answer: 6271
Teaching note: Easting 62, northing 71.
Q17 [2]
Answer: Steep [1]; contours close together show rapid height gain [1].
Teaching note: Close contours = steep slope.
Q18 [2]
Answer: 40% [2]
Working: (80 / 200) × 100 = 40%.
Teaching note: Percentage = part ÷ total × 100.
Q19 [2]
Answer: Peaks in Jun–Jul and Dec [1]; trough in Feb [1].
Teaching note: Identify high and low seasons from bars.
Q20 [3]
Answer: River channel [1]; slip-off slope / river cliff [1]; water flow direction arrow [1].
Teaching note: Field sketch of bend needs channel, features, direction.
Free quiz and exam paper access
Enter your details to view this paper
Your access is remembered on this device.