AI Generated Exam Paper
Secondary 1 Geography Practice Paper 1
Free Sec 1 Geography Practice Paper 1, HY3 AI version, with questions, answers, and syllabus-aligned practice for Singapore students.
These static practice materials are generated from the site's syllabus and paper-generation workflow, with source and model context shown so students and parents can evaluate the material before use.
Questions
TuitionGoWhere Practice Paper - Geography Secondary 1
TuitionGoWhere Practice Paper (AI) — Version 1 of 5
Subject: Geography
Level: Secondary 1
Paper: Practice Paper (Map Graph Data Skills)
Duration: 45 minutes
Total Marks: 40
Name: ______________________
Class: _________
Date: ___________
Instructions:
- This practice paper has 3 sections with 20 questions.
- Section A: Map Skills (Questions 1–8, 14 marks)
- Section B: Graph & Data Interpretation (Questions 9–14, 12 marks)
- Section C: Integrated Data & Map Analysis (Questions 15–20, 14 marks)
- Answer all questions in the spaces provided.
- Use the maps, tables, and figures given. Read axes and labels carefully.
Section A: Map Skills (14 marks)
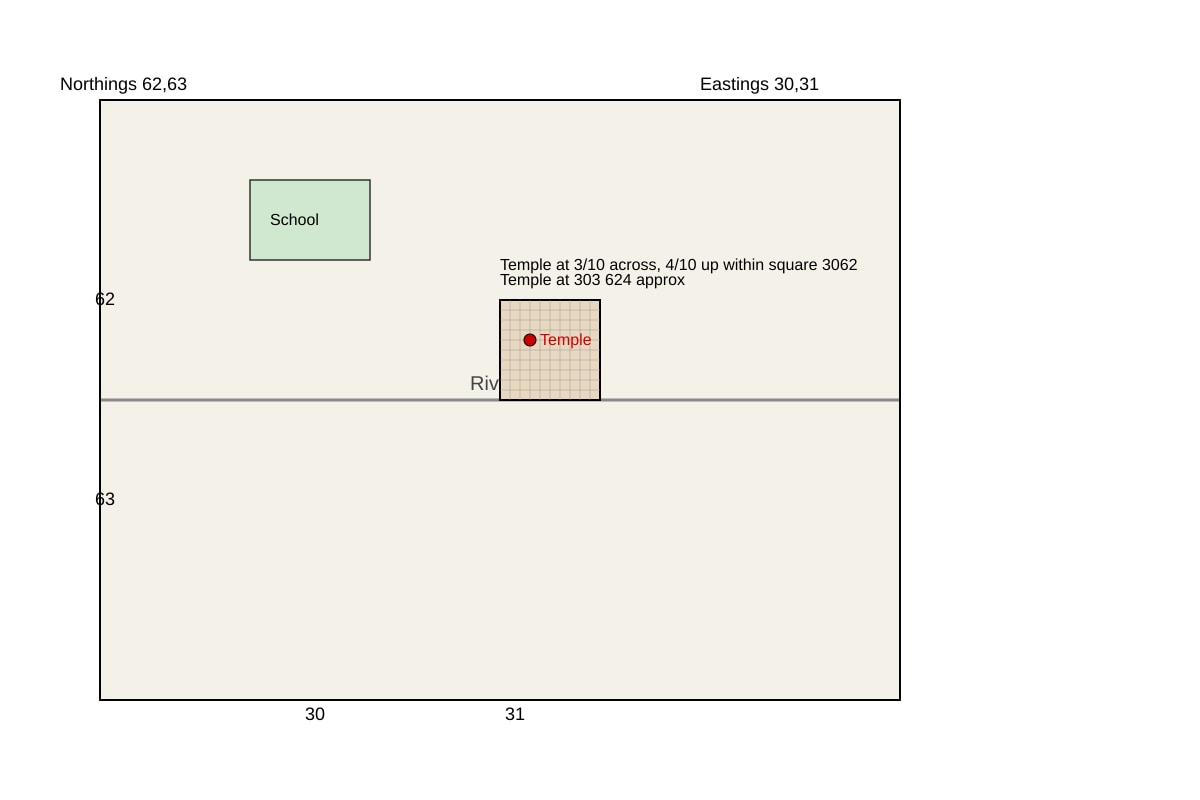
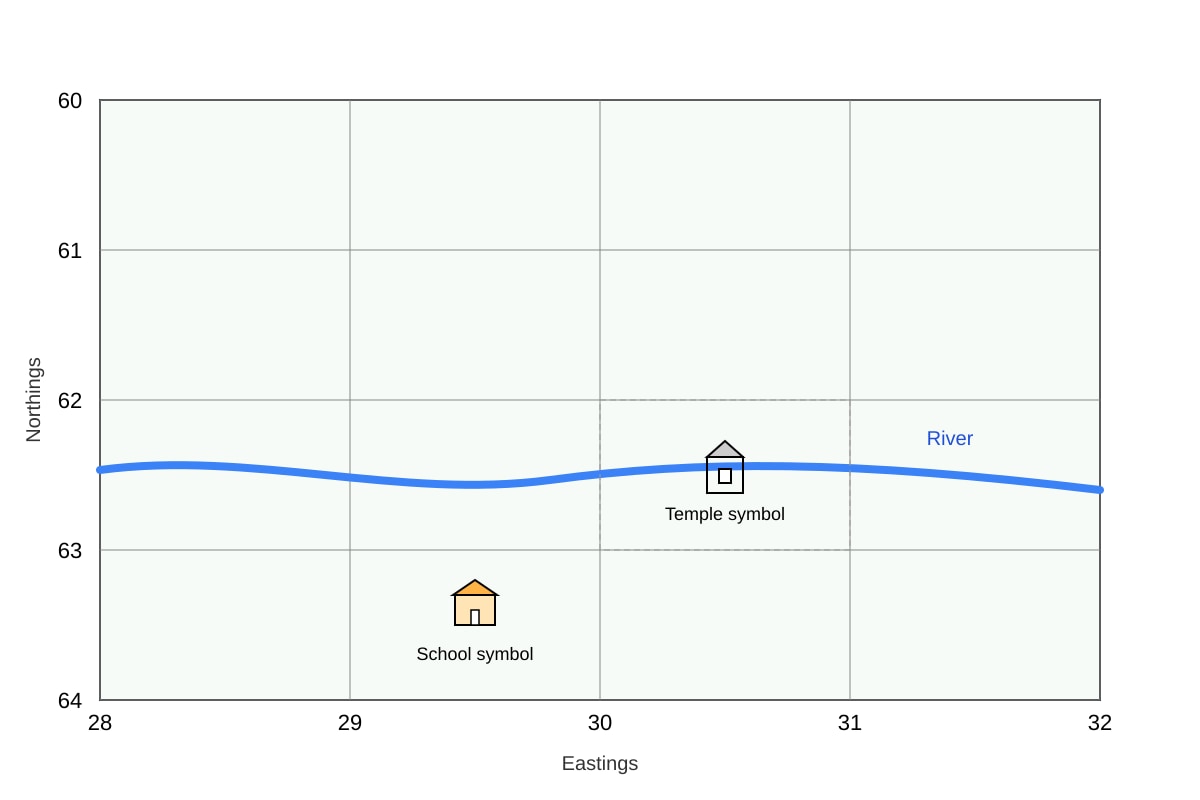
1. Study the map extract below. State the 4-figure grid reference of the temple. [1]
Image pending generation: map for Q1.
Grid reference: ___________
2. State the 4-figure grid reference of the school shown north of the river in the map above. [1]
Grid reference: ___________
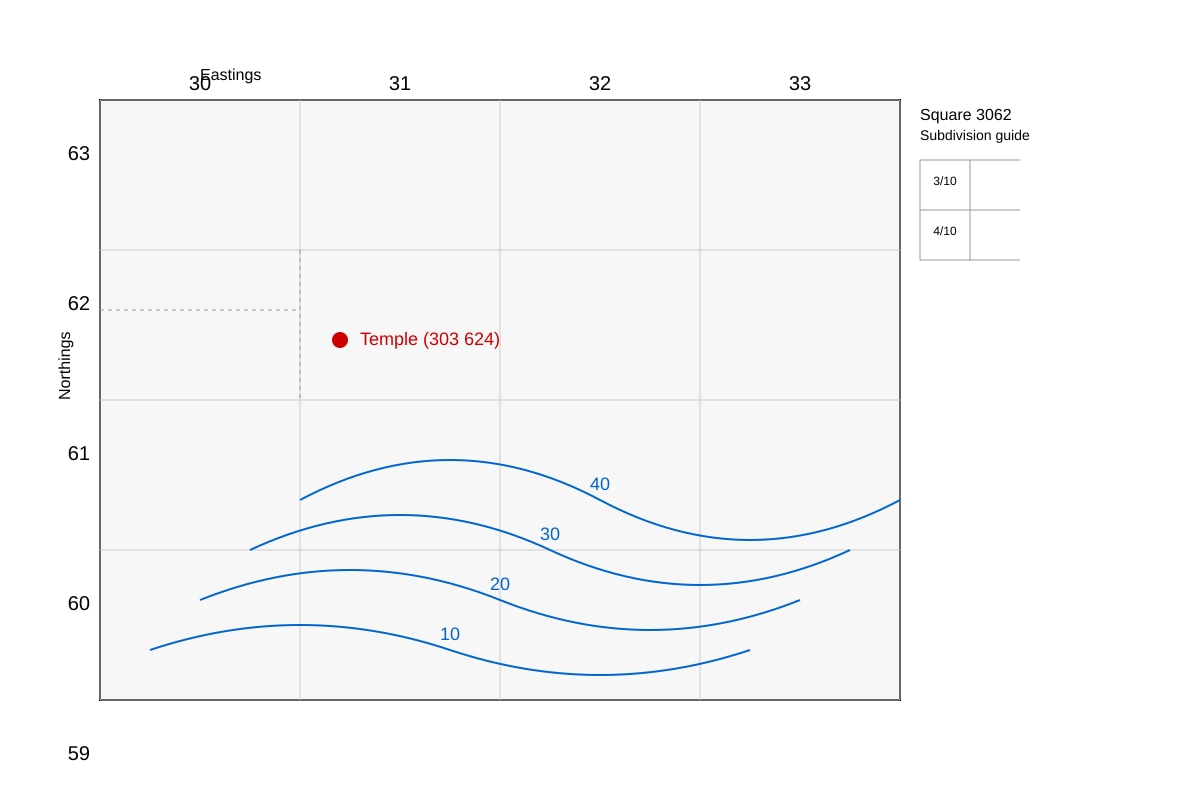
3. State the six-figure grid reference of the temple shown in the map extract for Question 1. [1]
Image pending generation: map for Q3.
Grid reference: ___________
4. State the contour interval of the map shown below. [1]
Image pending generation: map for Q4.
Contour interval: ___________ m
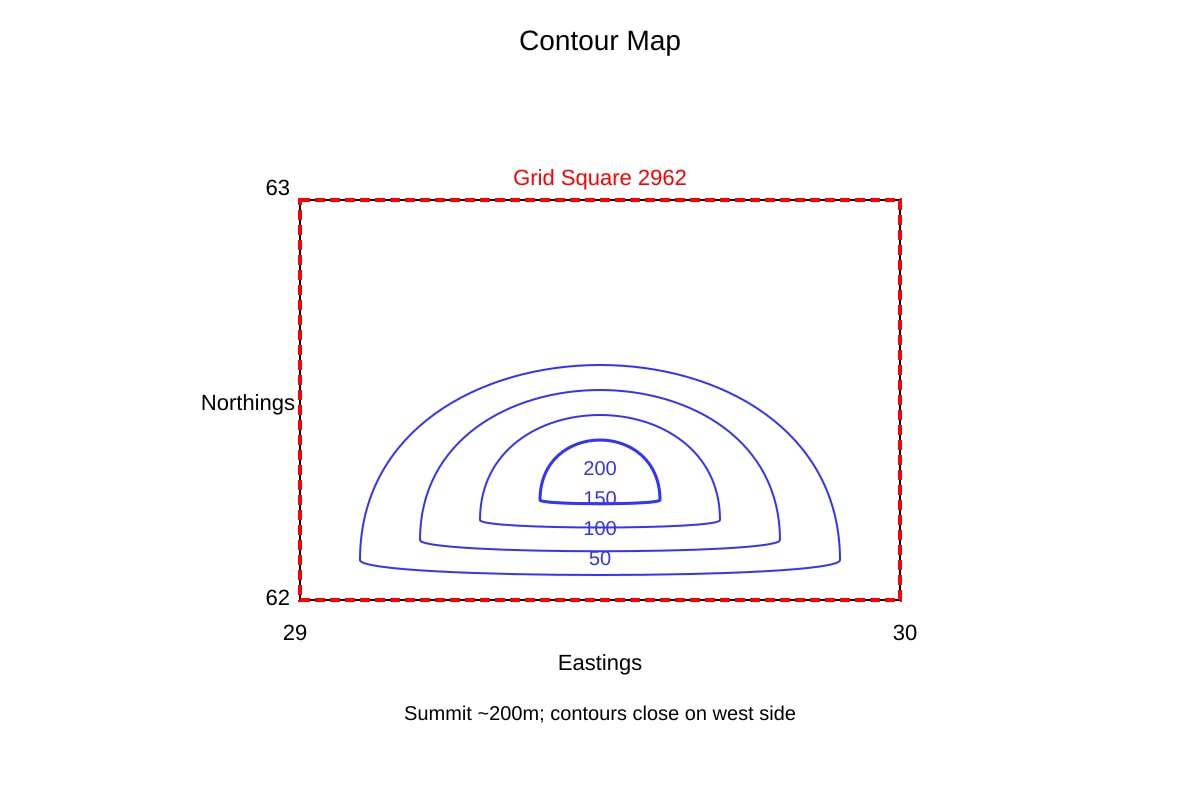
5. Study the contour map below. Describe the landform found at grid square 2962. [2]
Image pending generation: map for Q5.
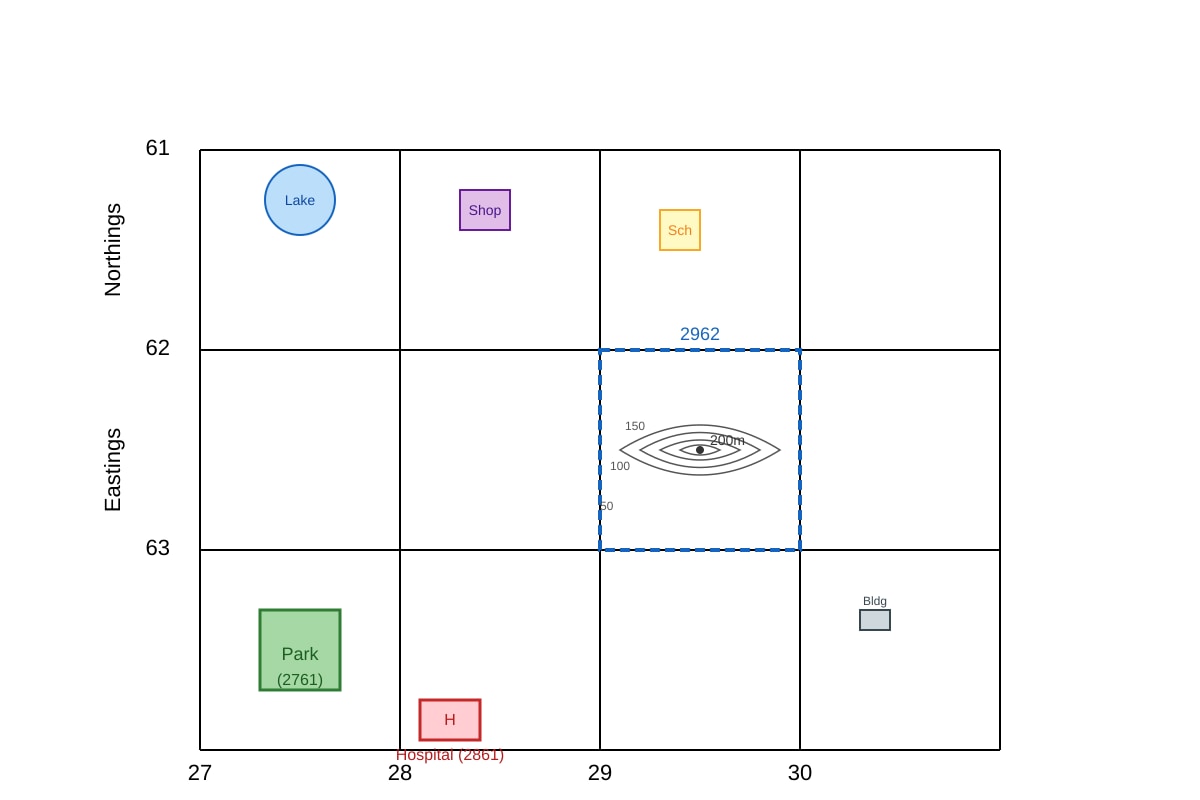
6. State the 4-figure grid reference of the hospital that is east of the park. [2]
Image pending generation: map for Q6.
Grid reference: ___________
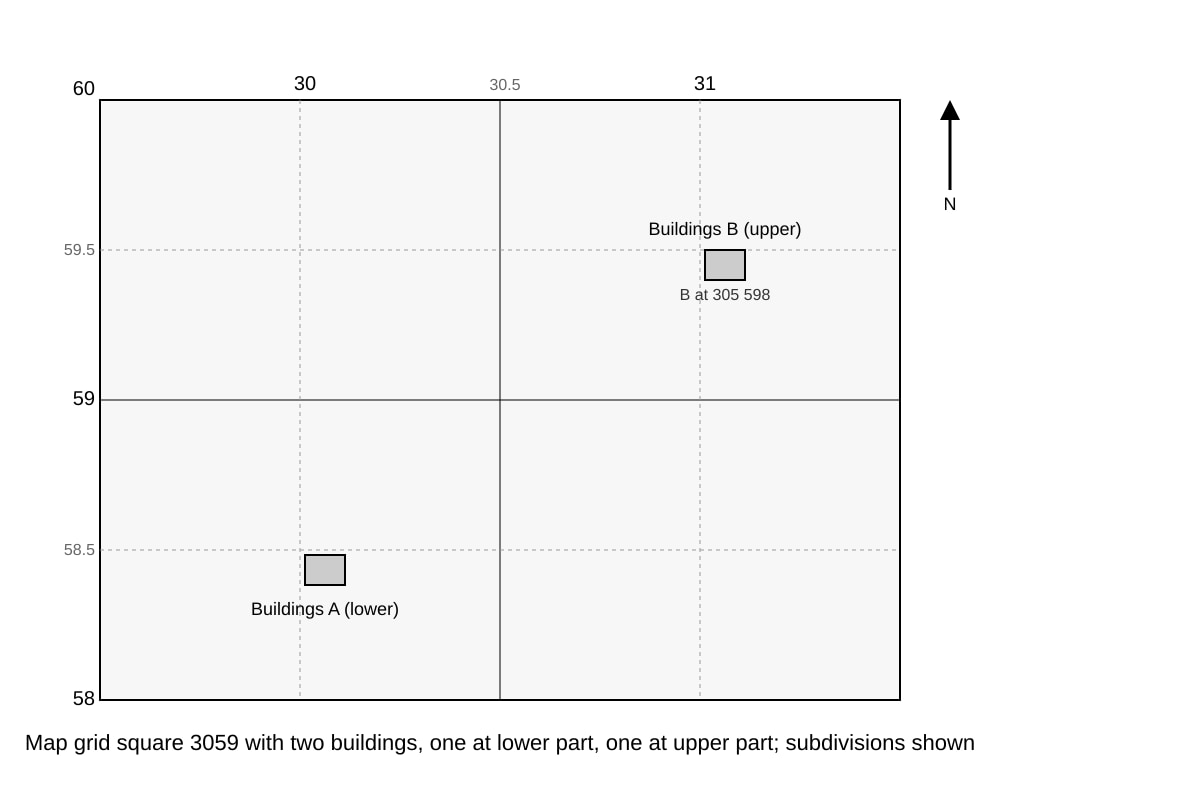
7. Give the 6-figure grid reference of the northernmost building in grid square 3059. [2]
Image pending generation: map for Q7.
Grid reference: ___________
8. The map scale is 1:50,000. What distance on the ground does 2 cm on the map represent? [2]
Distance: ___________ km
Section B: Graph & Data Interpretation (12 marks)
9. Study the table below showing rainfall in mm over 6 months.
| Month | Jan | Feb | Mar | Apr | May | Jun |
|---|---|---|---|---|---|---|
| Rain (mm) | 120 | 90 | 60 | 40 | 70 | 110 |
State the month with the highest rainfall. [1]
Month: ___________
10. Using the table in Q9, calculate the mean monthly rainfall. Show your working. [2]
Working: _______________________________________________________
Mean: ___________ mm
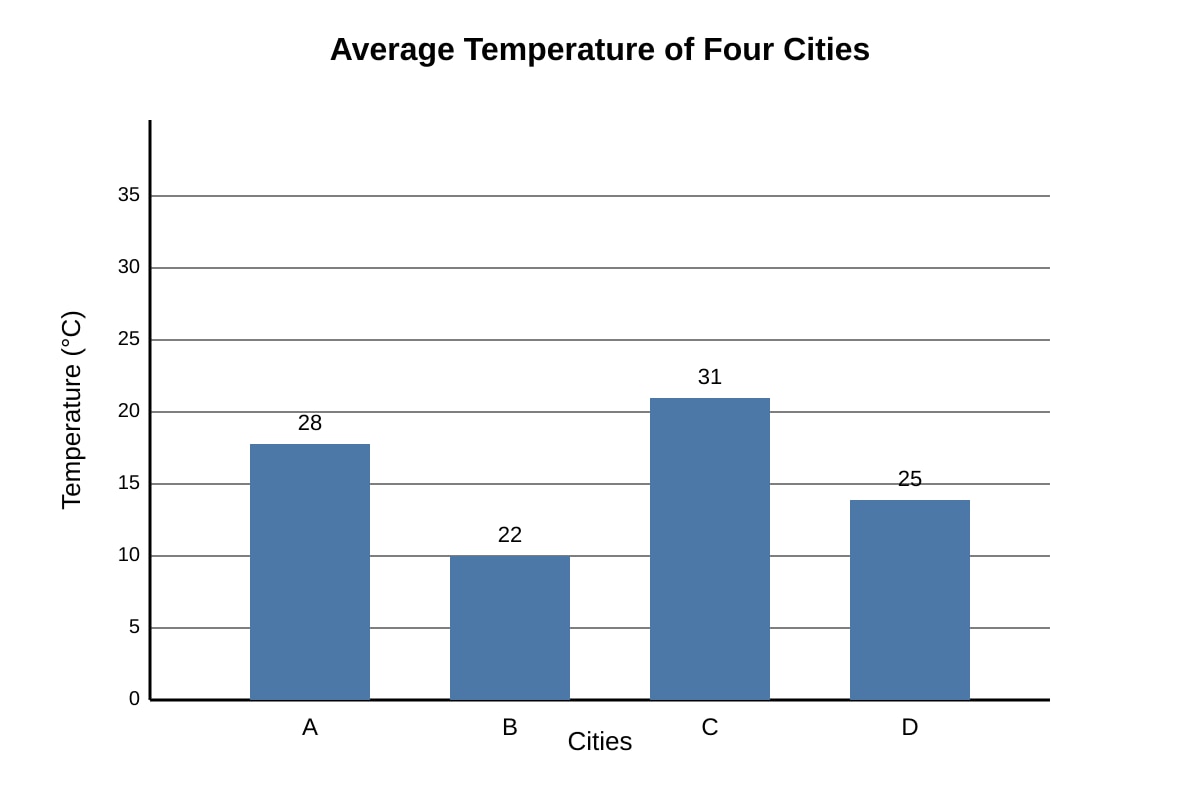
11. Study the bar graph below showing temperature (°C) for 4 cities.
Image pending generation: graph for Q11.
Which city has the lowest temperature? [1]
City: ___________
12. With reference to the bar graph in Q11, describe the temperature pattern across the four cities. [3]
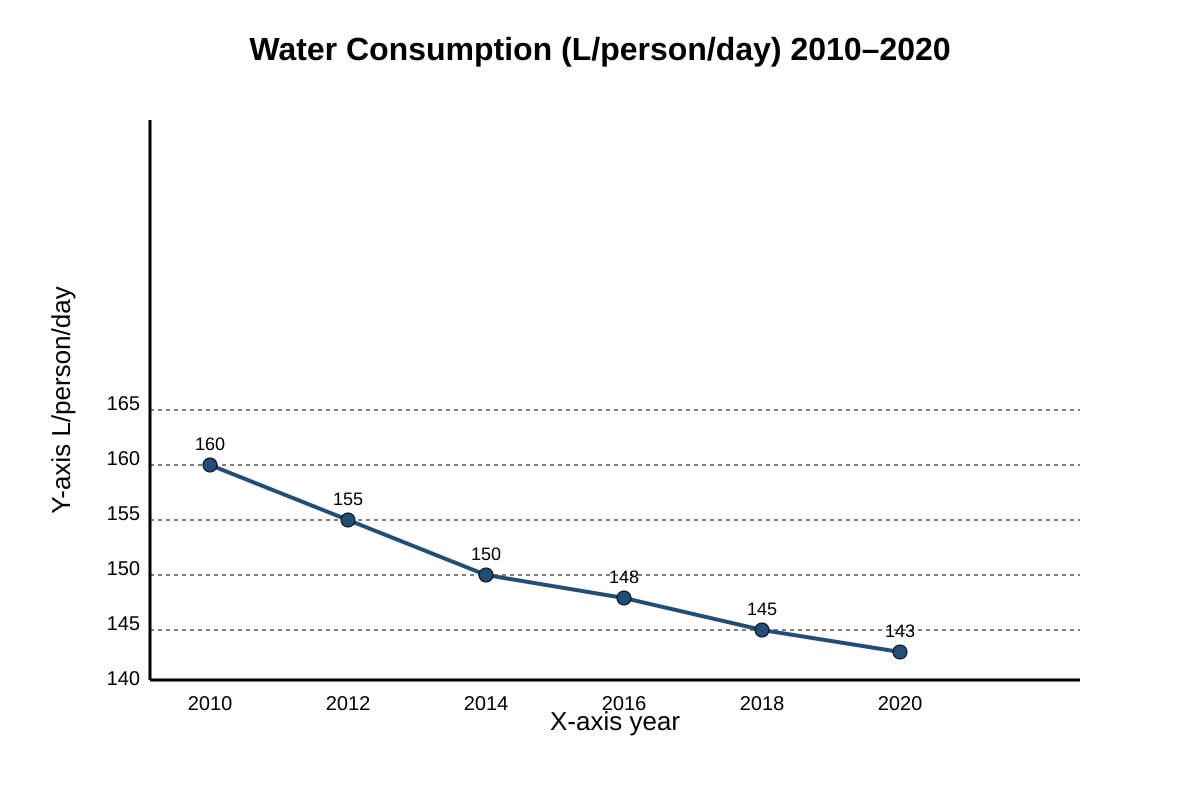
13. Study the line graph below showing water consumption (L/person/day) from 2010 to 2020.
Image pending generation: graph for Q13.
State the trend in water consumption from 2010 to 2020. [1]
Trend: ________________________________________________________
14. Using the line graph in Q13, calculate the decrease in water consumption from 2010 to 2020. [2]
Decrease: ___________ L/person/day
Section C: Integrated Data & Map Analysis (14 marks)
15. A class tested water quality at Site X (forest) and Site Y (urban). Results:
| Site | Dissolved O₂ (mg/L) | Turbidity (NTU) |
|---|---|---|
| X | 8.2 | 2 |
| Y | 5.1 | 12 |
Which site has healthier water? Explain using two pieces of evidence. [3]
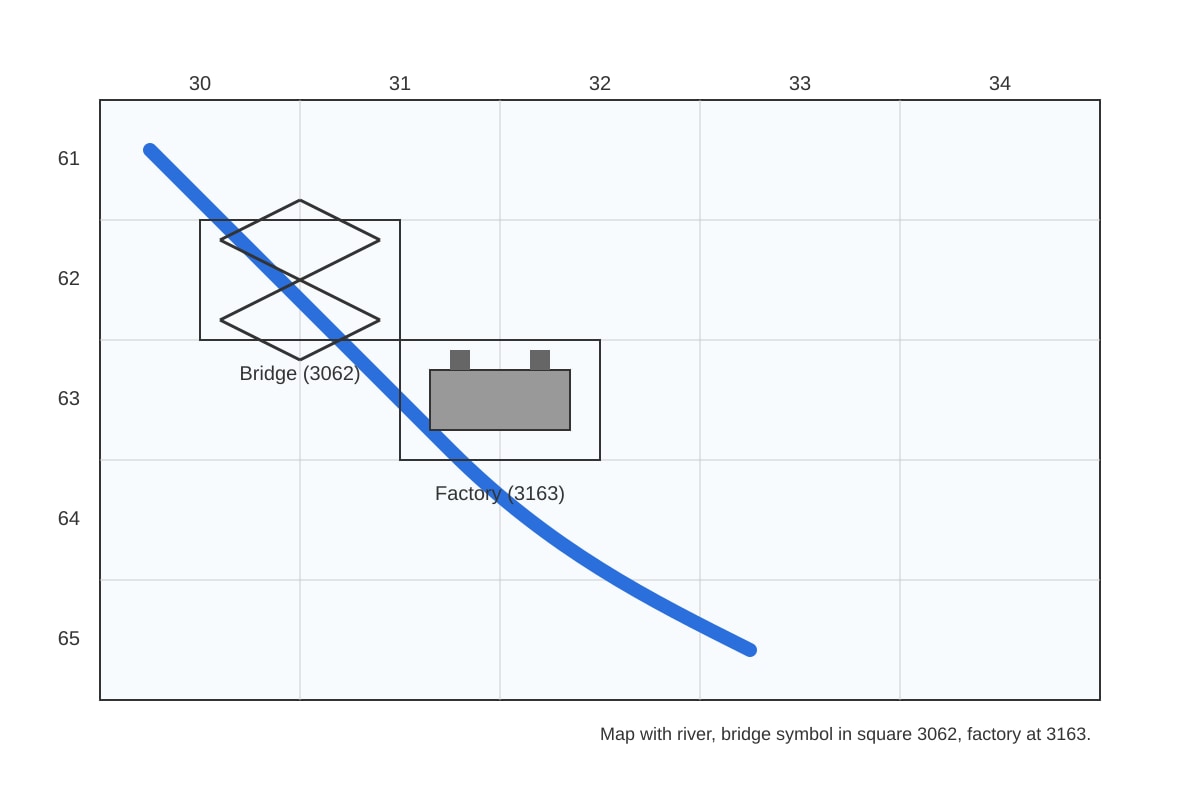
16. Study the map and data below. A factory is at 3163. A river flows south. State the 4-figure grid reference of the bridge crossing the river at 3062. [1]
Image pending generation: map for Q16.
Grid reference: ___________
17. The table shows distance of planets from the Sun.
| Planet | Distance (million km) |
|---|---|
| Mercury | 58 |
| Venus | 108 |
| Earth | 150 |
| Mars | 228 |
Describe the pattern of distance from the Sun across the four planets. [3]
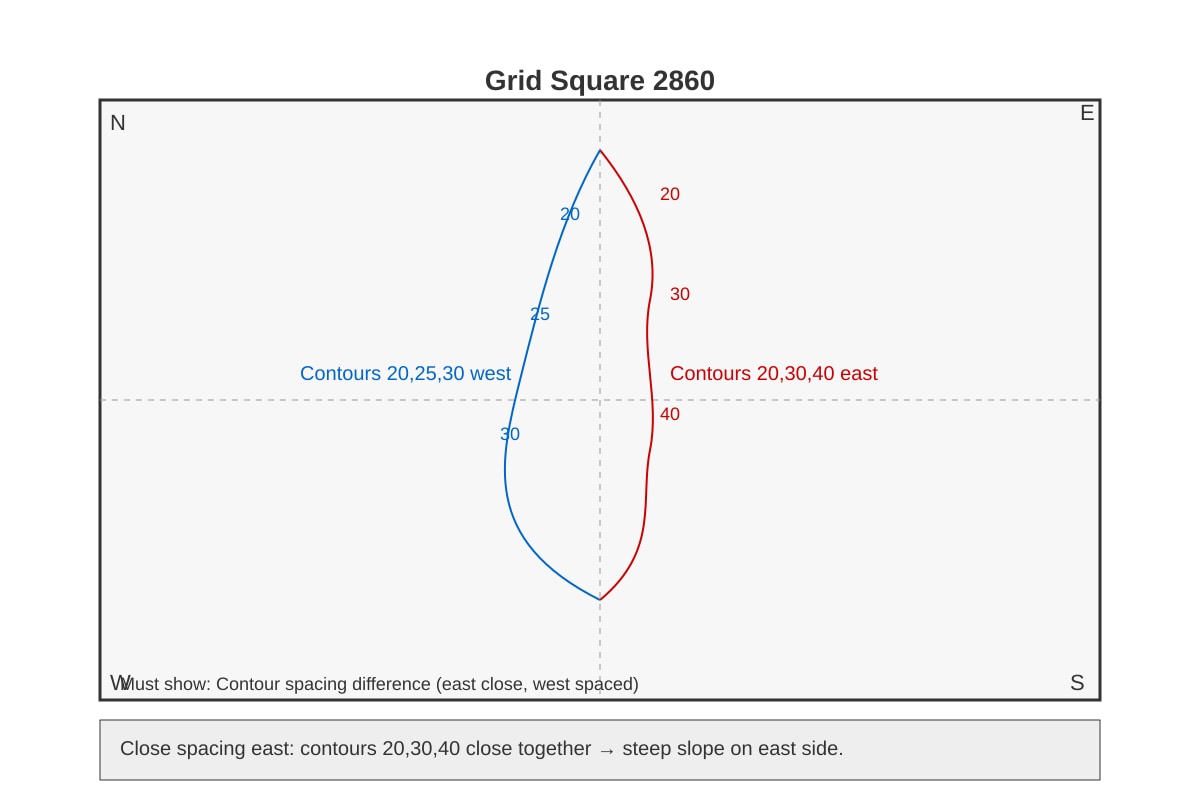
18. Study the contour map below. Grid square 2860 shows contours close together on the east. What does this indicate about the slope? [2]
Image pending generation: map for Q18.
19. Compare the rainfall table (Q9) and temperature graph (Q11) for Singapore context. Which month likely has most storms? Use evidence. [2]
20. A map has scale 1:25,000. Two points are 4 cm apart. What is ground distance in km? Show working. [3]
Working: _______________________________________________________
Distance: ___________ km
Answers
TuitionGoWhere Practice Paper Answer Key — Geography Secondary 1 (Version 1 of 5)
Total Marks: 40
Topic: Map Graph Data Skills
Section A: Map Skills (14 marks)
Q1. [1 mark]
Answer: 3062
Teaching note: Read easting (horizontal, 30) first, then northing (vertical, 62). The temple sits inside the square with lower-left corner at 30 east, 62 north. Common mistake: reversing order to 6230.
Q2. [1 mark]
Answer: 3063 (or 3162 depending on map; per fig: school north of river at 3063)
Teaching note: From Q1-fig1, school is north of river in square 3063. Always use lower-left corner.
Q3. [1 mark]
Answer: 303624 (approx; acceptable 30362x)
Teaching note: 4-figure 3062, then subdivide: temple at 3/10 east, 4/10 north → 303 624. Marking accepts ±1 in last digit.
Q4. [1 mark]
Answer: 10 m
Teaching note: Contour interval = difference between adjacent labelled contours (20−10 = 10). Not map scale.
Q5. [2 marks]
Answer: Hill / summit. Concentric contours increasing inward to ~200 m; steep west slope (contours close).
Marking: 1 mark landform identified, 1 mark description of contours/steepness.
Q6. [2 marks]
Answer: 2861
Teaching note: Park at 2761, hospital east → next square east = 2861. 1 mark direction, 1 mark reference.
Q7. [2 marks]
Answer: 305598
Teaching note: Square 3059, northernmost building at top → northing 598, easting 305. 1 mark square, 1 mark subdivision.
Q8. [2 marks]
Answer: 1 km
Working: 1:50,000 → 1 cm = 50,000 cm = 0.5 km. 2 cm = 1 km.
Marking: 1 mark conversion, 1 mark final.
Section B: Graph & Data Interpretation (12 marks)
Q9. [1 mark]
Answer: January (120 mm)
Q10. [2 marks]
Working: (120+90+60+40+70+110) ÷ 6 = 490 ÷ 6 ≈ 81.7 mm
Marking: 1 mark sum, 1 mark mean.
Q11. [1 mark]
Answer: City B (22 °C)
Q12. [3 marks]
Answer: Temperatures range from 22°C (B) to 31°C (C). B is coolest, C warmest. Three of four cities above 22°C; variation of 9°C.
Marking: 1 mark lowest/highest, 1 mark comparison, 1 mark use of values.
Q13. [1 mark]
Answer: Decreasing / falling trend
Q14. [2 marks]
Answer: 160 − 143 = 17 L/person/day
Marking: 1 mark values, 1 mark result.
Section C: Integrated Data & Map Analysis (14 marks)
Q15. [3 marks]
Answer: Site X healthier. Evidence: higher dissolved O₂ (8.2 vs 5.1) and lower turbidity (2 vs 12).
Marking: 1 mark site, 2 marks evidence (1 each).
Q16. [1 mark]
Answer: 3062
Q17. [3 marks]
Answer: Distance increases from Mercury (58) to Mars (228). Generally farther planets are more distant; Earth 150 between Venus and Mars.
Marking: 1 mark order, 1 mark trend, 1 mark values.
Q18. [2 marks]
Answer: Steep slope on east. Close contours = steep; spaced = gentle.
Marking: 1 mark close=steep, 1 mark applied to east.
Q19. [2 marks]
Answer: January (rain 120 mm, temp A 28). High rain + warm = storms likely.
Marking: 1 mark month, 1 mark evidence link.
Q20. [3 marks]
Working: 1:25,000 → 1 cm = 0.25 km. 4 cm = 1.0 km.
Marking: 1 mark scale, 1 mark calc, 1 mark answer.
Free quiz and exam paper access
Enter your details to view this paper
Your access is remembered on this device.