From Real Exams Exam Paper
Secondary 1 Geography Semestral Assessment 2 (End of Year) Paper 4
Free Sec 1 Geography SA2 Paper 4, Nemo3 Exam version, with questions, answers, and syllabus-aligned practice for Singapore students.
These static practice materials are generated from the site's syllabus and paper-generation workflow, with source and model context shown so students and parents can evaluate the material before use.
Questions
TuitionGoWhere Practice Paper - Geography Secondary 1
TuitionGoWhere Secondary School (AI)
Subject: Geography
Level: Secondary 1
Paper: SA2 (Version 4)
Duration: 1 hour 30 minutes
Total Marks: 50
Name: ________________________
Class: ________________________
Date: ________________________
INSTRUCTIONS TO CANDIDATES
- Write your name, class, and date in the spaces provided above.
- Answer all questions.
- Write your answers in the spaces provided on the question paper.
- The number of marks is given in brackets [ ] at the end of each question or part question.
- The total number of marks for this paper is 50.
- You may use a calculator.
- For map-based questions, refer to the map extract provided in the insert (Image Placeholder Q1-fig1).
SECTION A: MAP SKILLS [15 marks]
Answer all questions in this section. Refer to the map extract of Pulau Ubin (Image Placeholder Q1-fig1) for Questions 1–5.
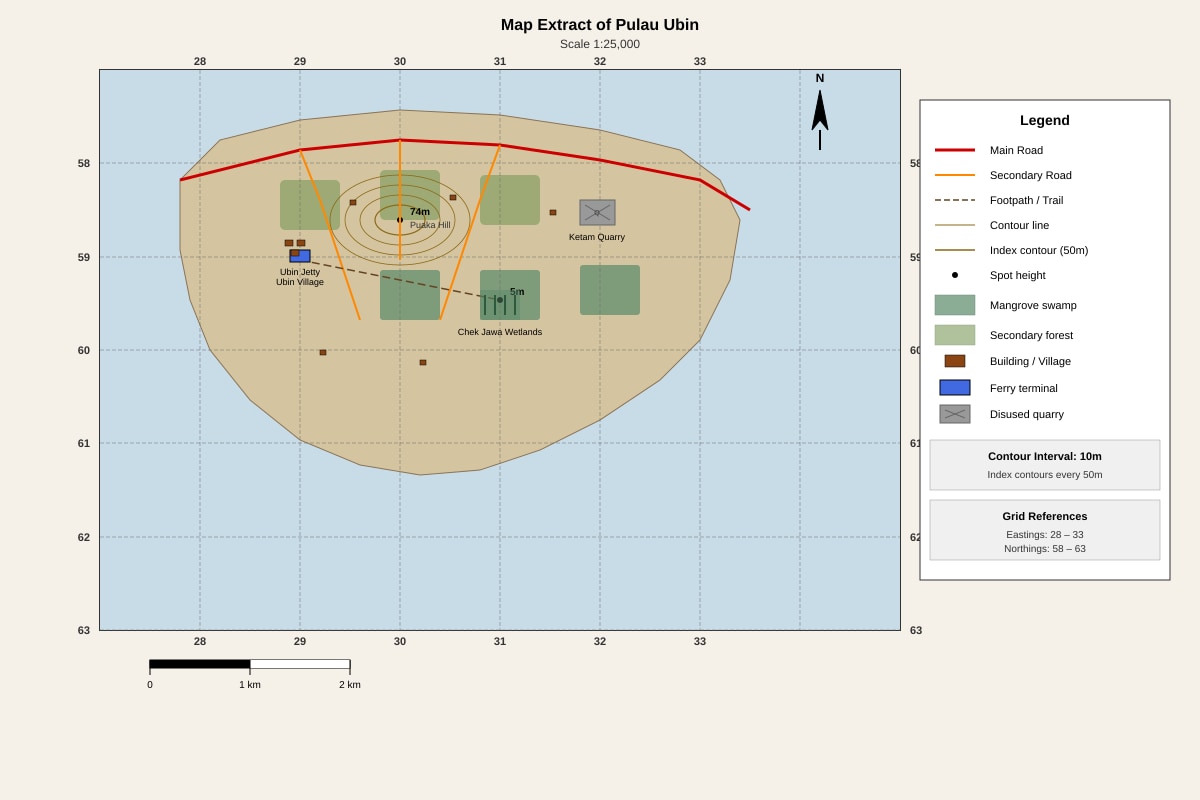
Generated map for Q1.
1 State the four-figure grid reference of the Ubin Jetty.
[1]
Answer: ________________________
2 State the six-figure grid reference of the highest point on Puaka Hill (spot height 74m).
[1]
Answer: ________________________
3 Using the map scale, calculate the straight-line distance in kilometres between Ubin Jetty (2962) and the centre of Chek Jawa Wetlands (3160). Show your working.
[2]
Answer: ________________________ km
4 (a) Identify the direction of Chek Jawa Wetlands from Ubin Jetty. Use the eight-point compass.
[1]
Answer: ________________________
(b) Measure the bearing of Chek Jawa Wetlands from Ubin Jetty.
[1]
Answer: ________________________°
5 Study the contour lines around Puaka Hill (grid square 3061).
(a) State the contour interval shown on the map.
[1]
Answer: ________________________ m
(b) Describe the relief of Puaka Hill using evidence from the contour pattern.
[2]
Answer: ________________________________________________________________________________
6 The map shows a disused quarry at Ketam Quarry (3259). Suggest one reason why this quarry was located at this site, using map evidence.
[2]
Answer: ________________________________________________________________________________
7 A student walks from Ubin Jetty to Chek Jawa Wetlands along the Sensory Trail.
(a) State the general direction of this walk.
[1]
Answer: ________________________
(b) Explain one advantage of following the Sensory Trail rather than walking in a straight line.
[2]
Answer: ________________________________________________________________________________
SECTION B: GRAPH AND DATA INTERPRETATION [20 marks]
Answer all questions in this section.
8 The table below shows the monthly rainfall (mm) recorded at a weather station in Singapore for the first six months of 2024.
| Month | Jan | Feb | Mar | Apr | May | Jun |
|---|---|---|---|---|---|---|
| Rainfall (mm) | 210 | 105 | 180 | 165 | 195 | 150 |
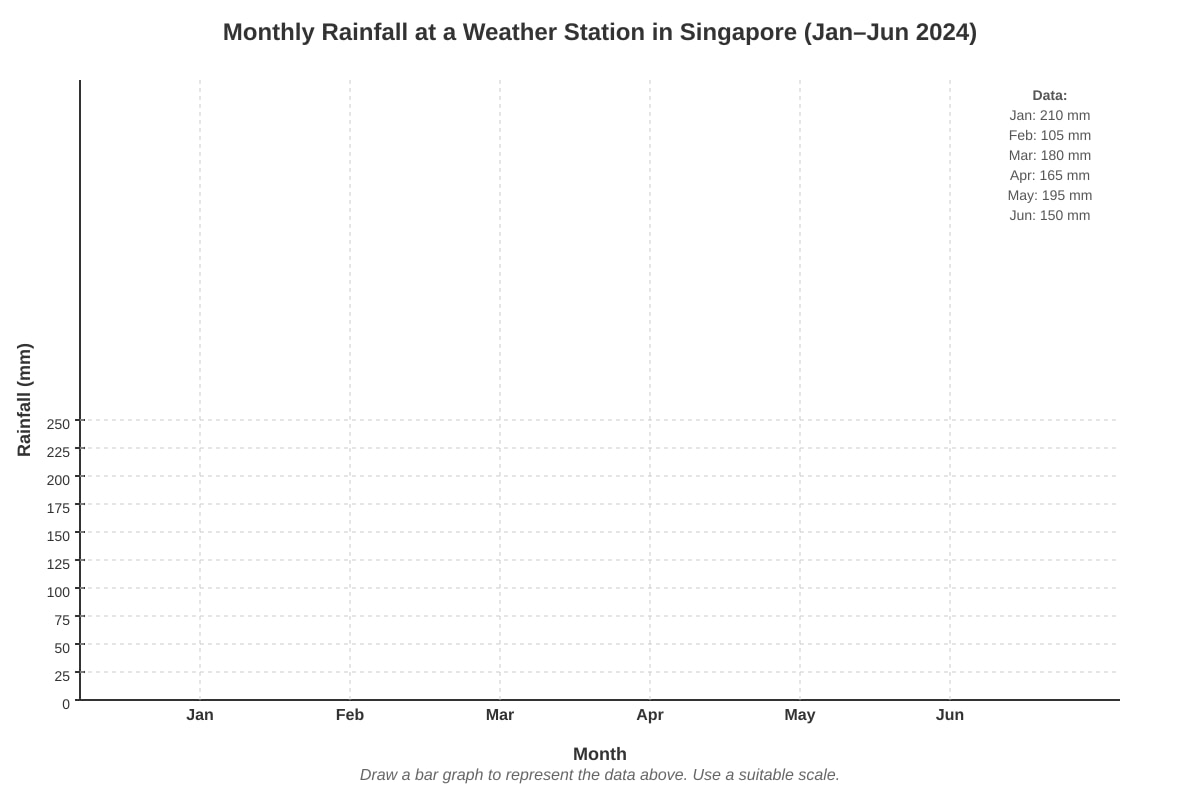
Generated graph for Q8.
(a) On the graph paper provided (Image Placeholder Q8-fig1), draw a bar graph to represent the data. Use a suitable scale.
[3]
(b) Which month had the highest rainfall?
[1]
Answer: ________________________
(c) Calculate the mean monthly rainfall for these six months. Show your working.
[2]
Answer: ________________________ mm
9 The divided bar graph below (Image Placeholder Q9-fig1) shows the percentage composition of water usage in a typical Singapore household.
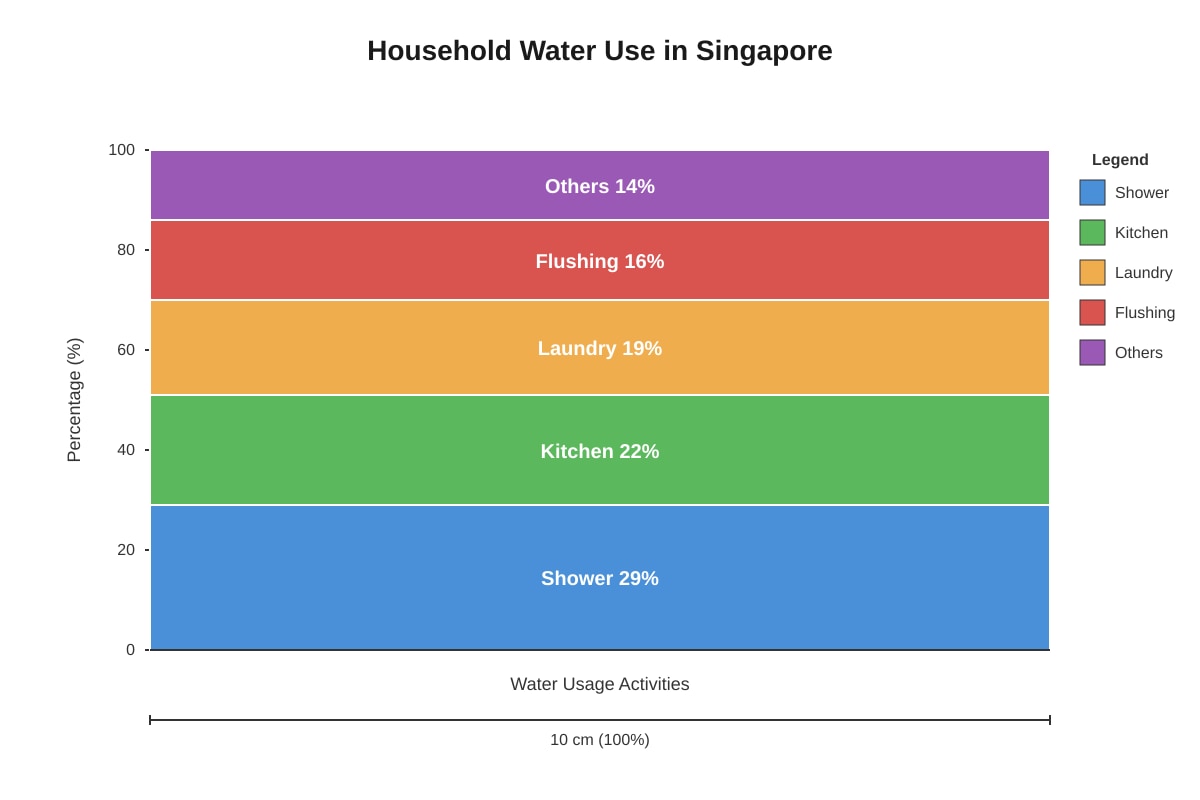
Generated chart for Q9.
(a) Which single activity accounts for the largest proportion of water use?
[1]
Answer: ________________________
(b) Calculate the combined percentage of water used for Kitchen and Laundry.
[1]
Answer: ________________________%
(c) If a household uses 20,000 litres of water in a month, calculate the volume of water used for Shower. Show your working.
[2]
Answer: ________________________ litres
10 The line graph below (Image Placeholder Q10-fig1) shows the average monthly temperature (°C) and monthly rainfall (mm) for a tropical rainforest location.
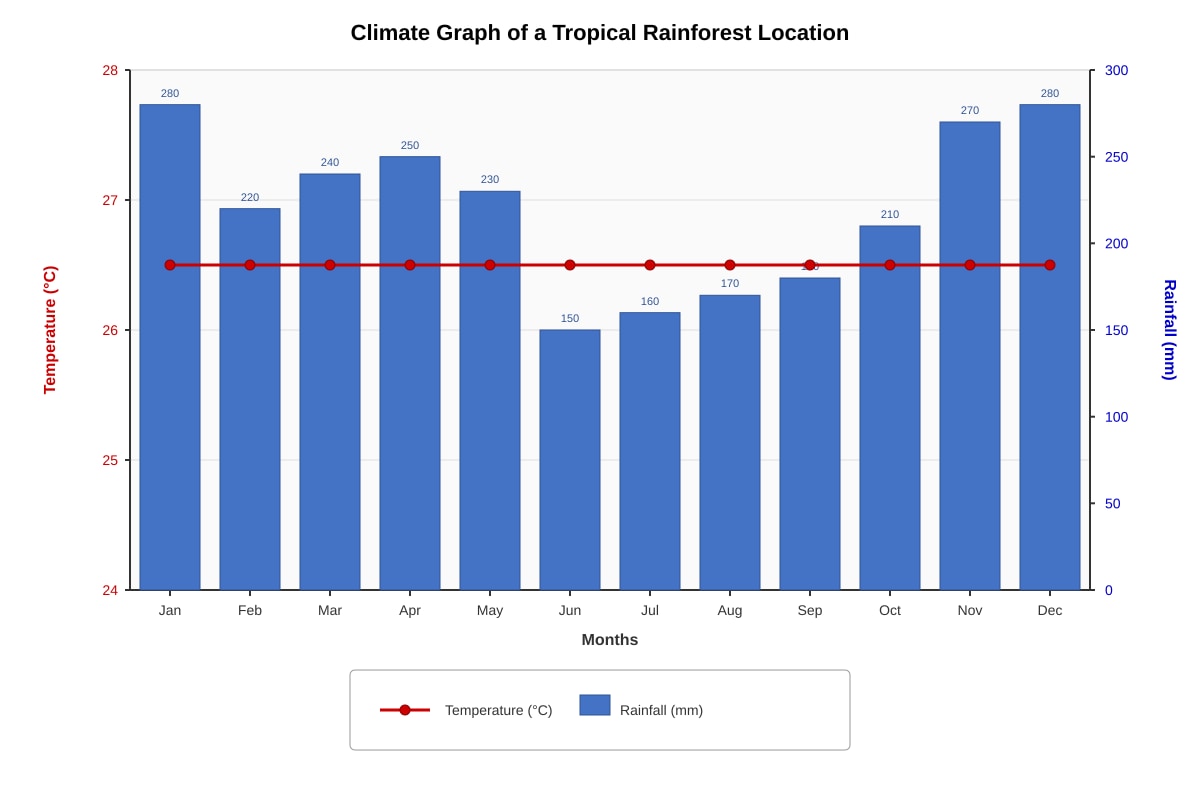
Generated graph for Q10.
(a) Describe the temperature pattern shown in the graph.
[2]
Answer: ________________________________________________________________________________
(b) Identify the wettest month and state its rainfall.
[1]
Answer: ________________________ (________ mm)
(c) Explain why tropical rainforests experience high rainfall throughout the year.
[3]
Answer: ________________________________________________________________________________
11 The pie chart below (Image Placeholder Q11-fig1) shows the sources of electricity generation in Singapore in 2023.
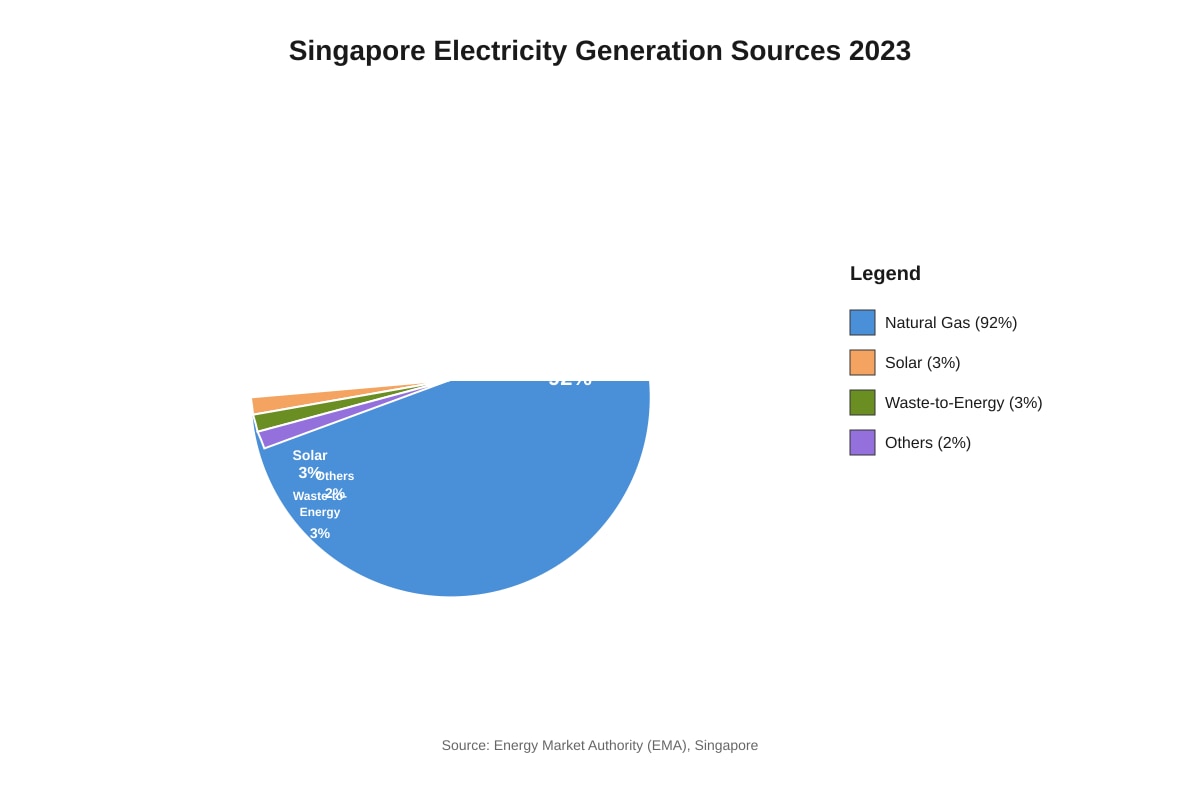
Generated chart for Q11.
(a) State the percentage of electricity generated from renewable sources (Solar + Waste-to-Energy).
[1]
Answer: ________________________%
(b) Singapore aims to increase solar deployment to 2 GWp by 2030. Suggest one geographical constraint that limits large-scale solar farm development in Singapore.
[2]
Answer: ________________________________________________________________________________
12 A student conducted a traffic count at a junction near their school for 30 minutes during morning peak hour. The results are shown below.
| Vehicle Type | Number Counted |
|---|---|
| Cars | 120 |
| Buses | 15 |
| Motorcycles | 45 |
| Goods Vehicles | 20 |
| Bicycles | 30 |
(a) Calculate the percentage of Cars out of the total vehicles counted. Show your working.
[2]
Answer: ________________________%
(b) The student concludes: "Cars are the main cause of traffic congestion."
Evaluate this conclusion using the data.
[2]
Answer: ________________________________________________________________________________
SECTION C: GEOGRAPHICAL INVESTIGATION & DATA ANALYSIS [15 marks]
Answer all questions in this section.
13 A group of Secondary 1 students carried out a fieldwork investigation at Sungei Buloh Wetland Reserve to study water quality. They measured pH, temperature, and turbidity at three sites: Site A (mangrove inlet), Site B (main river channel), and Site C (near visitor centre).
The results are shown in the table below.
| Site | pH | Temperature (°C) | Turbidity (NTU) |
|---|---|---|---|
| A | 6.8 | 28.5 | 45 |
| B | 7.2 | 29.0 | 18 |
| C | 7.5 | 29.5 | 12 |
(a) Which site has the highest turbidity?
[1]
Answer: ________________________
(b) Suggest one reason for the high turbidity at this site, based on its location.
[2]
Answer: ________________________________________________________________________________
(c) The students hypothesised: "Water temperature increases as you move away from the mangrove inlet."
Does the data support this hypothesis? Use evidence from the table.
[2]
Answer: ________________________________________________________________________________
14 The students used a Secchi disk to measure water transparency at each site.
(a) Describe how a Secchi disk is used to measure transparency.
[2]
Answer: ________________________________________________________________________________
(b) State one limitation of using a Secchi disk in a mangrove environment.
[1]
Answer: ________________________________________________________________________________
15 To improve the reliability of their investigation, the teacher suggested repeating measurements at each site on three different days.
(a) Explain why repeating measurements improves reliability.
[2]
Answer: ________________________________________________________________________________
(b) State one other way the students could improve the validity of their water quality investigation.
[1]
Answer: ________________________________________________________________________________
16 The students presented their pH data using a bar graph (Image Placeholder Q16-fig1).
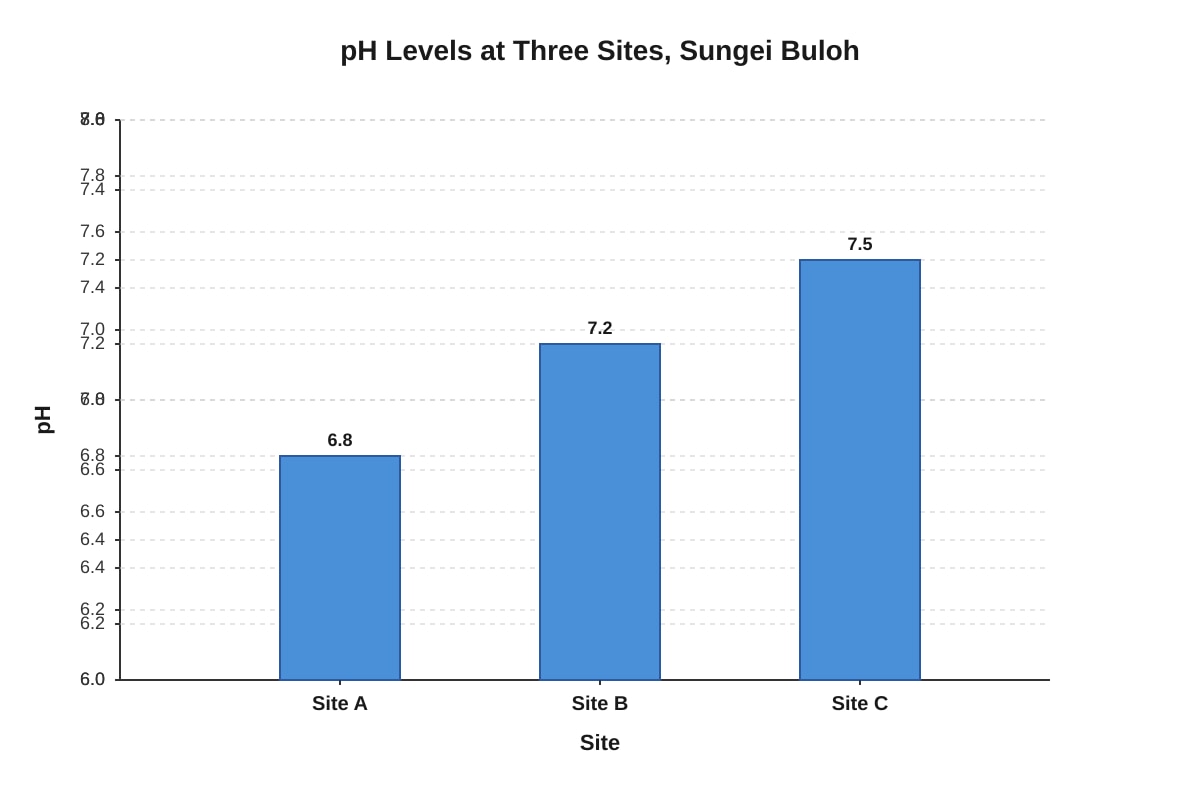
Generated graph for Q16.
(a) The y-axis starts at pH 6.0 instead of pH 0. Explain one advantage and one disadvantage of this scale choice.
[2]
Answer: ________________________________________________________________________________
(b) The students want to show the relationship between pH and turbidity across the three sites. Suggest a more suitable graph type and explain why.
[2]
Answer: ________________________________________________________________________________
17 Read the following source extract about water management in Singapore.
Source A: Singapore's Four National Taps
Singapore has developed a robust and diversified water supply strategy known as the Four National Taps:
- Water from Local Catchment – Rainwater collected in 17 reservoirs.
- Imported Water – From Johor, Malaysia, under agreements expiring in 2061.
- NEWater – High-grade reclaimed water produced from treated used water using advanced membrane technologies and UV disinfection.
- Desalinated Water – Seawater treated through reverse osmosis.
Today, NEWater and desalination meet up to 85% of Singapore's water demand. By 2060, they are expected to meet up to 85% of demand, with NEWater meeting 55% and desalination 30%. PUB continues to invest in R&D to reduce energy consumption of desalination and increase water recycling rates.
(a) Identify which two of the Four National Taps are weather-resilient (not dependent on rainfall).
[2]
Answer: ________________________ and ________________________
(b) Explain why NEWater is considered a sustainable water source.
[3]
Answer: ________________________________________________________________________________
18 The table below shows energy consumption for producing 1,000 litres of water from different sources.
| Water Source | Energy Consumption (kWh/1000L) |
|---|---|
| Local Catchment | 0.3 |
| Imported Water | 0.5 |
| NEWater | 1.2 |
| Desalinated Water | 3.5 |
(a) Calculate how many times more energy desalination uses compared to NEWater. Show your working.
[2]
Answer: ________________________ times
(b) Despite higher energy use, Singapore is expanding desalination capacity. Suggest one reason why.
[2]
Answer: ________________________________________________________________________________
19 A choropleth map (Image Placeholder Q19-fig1) shows water stress levels across countries in Southeast Asia.
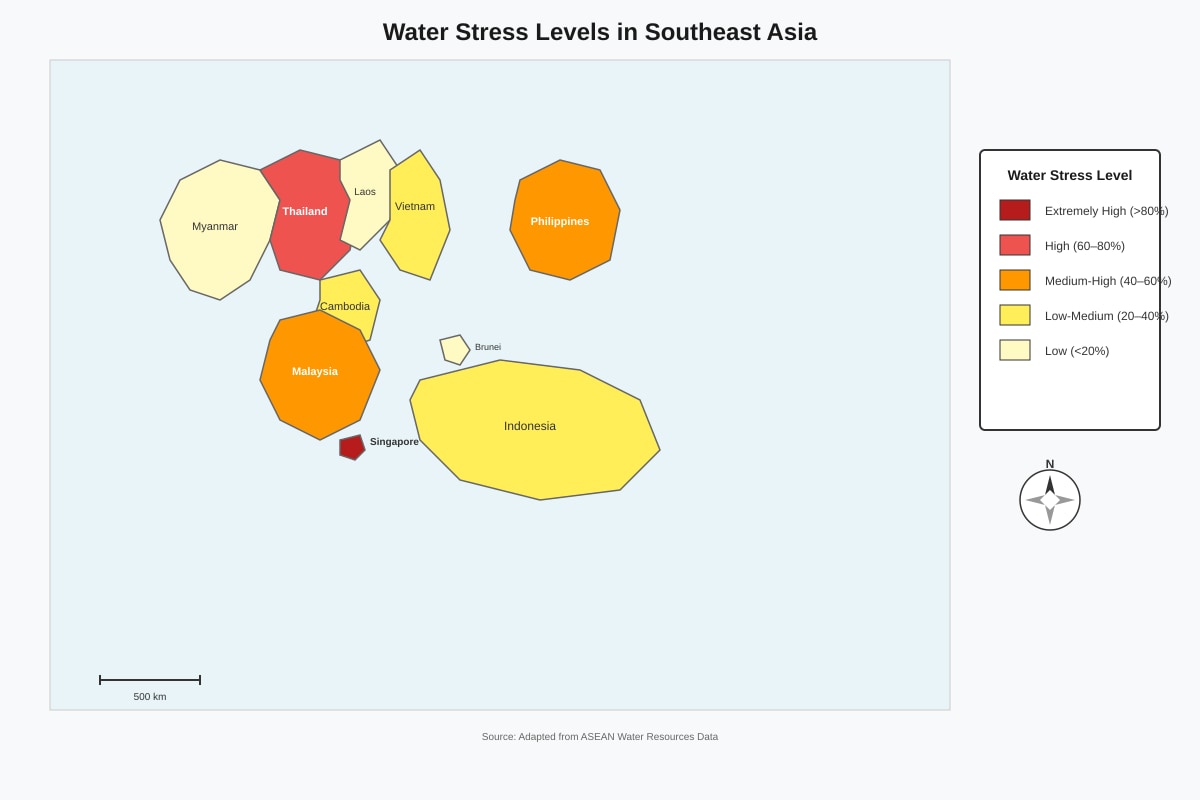
Generated map for Q19.
(a) Describe the water stress level in Singapore compared to Myanmar.
[2]
Answer: ________________________________________________________________________________
(b) Suggest one physical and one human factor that explains Singapore's high water stress.
[2]
Answer: ________________________________________________________________________________
20 The scatter graph below (Image Placeholder Q20-fig1) shows the relationship between GDP per capita (US$) and water consumption per capita (litres/day) for 10 countries.
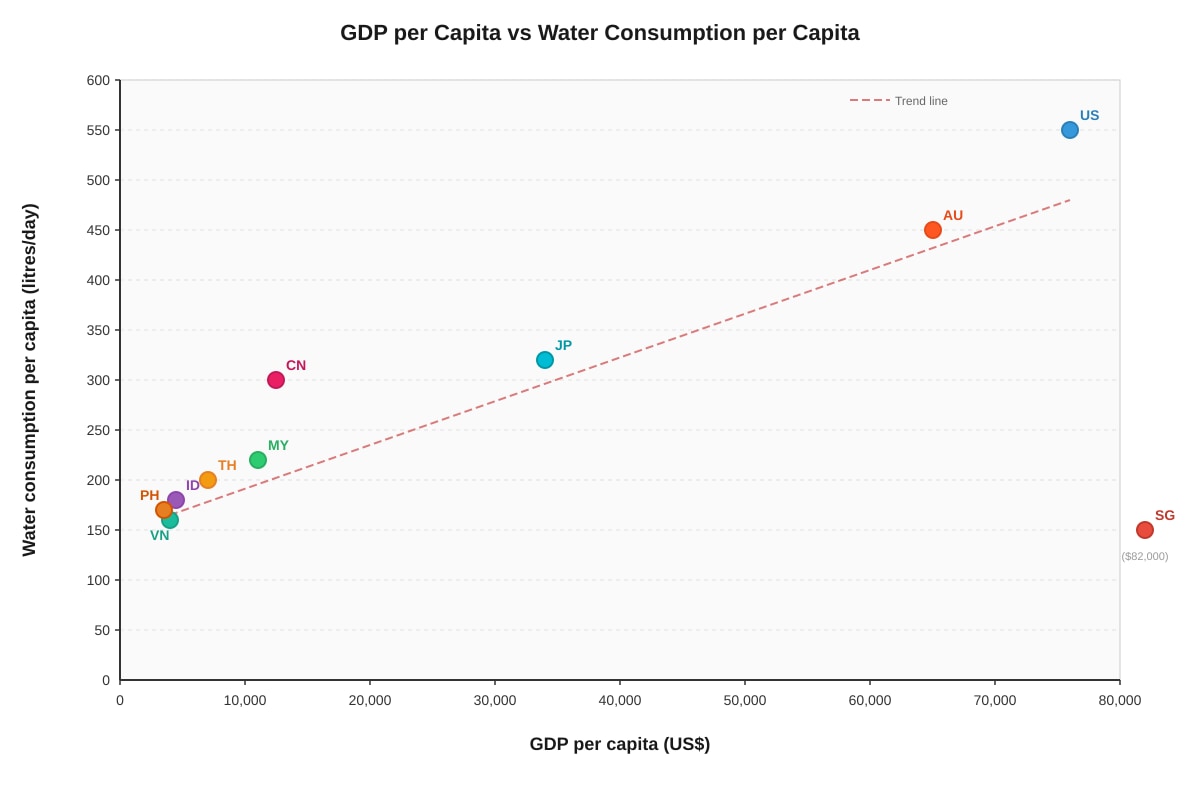
Generated graph for Q20.
(a) Describe the general relationship between GDP per capita and water consumption per capita shown in the graph.
[2]
Answer: ________________________________________________________________________________
(b) Singapore is an anomaly (outlier) in this graph. Explain why Singapore's water consumption is lower than expected for its GDP per capita.
[3]
Answer: ________________________________________________________________________________
END OF PAPER
Answers
TuitionGoWhere Practice Paper - Geography Secondary 1 (SA2 Version 4) - ANSWER KEY
Total Marks: 50
SECTION A: MAP SKILLS [15 marks]
1. Four-figure grid reference of Ubin Jetty [1]
Answer: 2962
Marking: 1 mark for correct 4-figure GR (2962).
Explanation: Read eastings (horizontal) first: 29. Then northings (vertical): 62. The jetty symbol lies in the grid square bounded by easting 29, northing 62. Always use the bottom-left corner of the grid square.
Common error: Reversing order (6229) or giving 6-figure reference.
2. Six-figure grid reference of Puaka Hill summit (spot height 74m) [1]
Answer: 303613 (accept 303614 or 304613 depending on exact position within square)
Marking: 1 mark for correct 6-figure GR. Easting 303–304, Northing 613–614.
Explanation: In grid square 3061. Divide the square into 10×10. The spot height 74m is near the centre-right of the square. Estimate tenths: ~3/10 across (easting 303), ~3/10 up (northing 613). Read easting then northing.
Common error: Forgetting to estimate tenths; giving 4-figure GR (3061).
3. Straight-line distance Ubin Jetty (2962) to Chek Jawa (3160) [2]
Working:
- Map distance: Measure from centre of 2962 to centre of 3160.
ΔEasting = 2 grid squares = 2 km (since 1 grid square = 1 km at 1:25,000? Wait: 1:25,000 means 1 cm = 0.25 km. Grid squares are 1 km × 1 km on ground. 4-figure grid lines are 1 km apart.)
Actually: At 1:25,000, 4 cm on map = 1 km on ground. Grid lines are 4 cm apart = 1 km.
From 29 to 31 = 2 eastings = 2 km east. From 62 to 60 = 2 northings = 2 km south.
Straight-line distance = √(2² + 2²) = √8 ≈ 2.83 km (accept 2.8–2.9 km). - Answer: 2.83 km (or 2.8–2.9 km)
Marking: 1 mark for correct method (Pythagoras or scale measurement), 1 mark for correct answer with unit.
Explanation: Grid squares represent 1 km × 1 km. Use Pythagoras' theorem for diagonal distance. Scale 1:25,000 confirms 4 cm = 1 km.
4. (a) Direction of Chek Jawa from Ubin Jetty [1]
Answer: South-East (SE)
Marking: 1 mark for SE (accept South-East).
Explanation: Chek Jawa (3160) is east (higher easting) and south (lower northing) of Ubin Jetty (2962). On 8-point compass: SE.
4. (b) Bearing of Chek Jawa from Ubin Jetty [1]
Answer: 135° (accept 130°–140°)
Marking: 1 mark for bearing 135° ±5°.
Explanation: Bearing measured clockwise from North. SE = 135°. Use protractor on map: from jetty (2962) to Chek Jawa (3160) gives ~135°.
5. (a) Contour interval [1]
Answer: 10 m (or 10 metres)
Marking: 1 mark.
Explanation: Stated in map legend: "Contour interval 10m". Index contours every 50 m (every 5th line).
5. (b) Relief of Puaka Hill [2]
Answer: Puaka Hill is a steep-sided, conical hill with a summit at 74 m. Contour lines are closely spaced (especially on western and southern slopes), indicating steep gradients. The contours form roughly circular/oval shapes, showing a rounded hilltop. The northern and eastern slopes are gentler (wider contour spacing).
Marking: 1 mark for identifying steep slopes (close contours), 1 mark for shape/summit height/conical description.
Explanation: Close contours = steep; wide spacing = gentle. Circular contours = hill. Spot height 74 m gives summit elevation.
6. Reason for Ketam Quarry location (3259) [2]
Answer: The quarry is located on high ground (contours show elevation ~40–50 m) with exposed rock (granite). Map evidence: contour lines indicate a hill/ridge; disused quarry symbol shows past extraction. The steep slopes (close contours) suggest rock near surface, easy to quarry. Road access (secondary road connects to main road) allowed transport.
Marking: 1 mark for map evidence (contours/hill/road), 1 mark for geographical reasoning (rock exposure/access).
Explanation: Quarries need accessible bedrock. Hills often expose rock. Roads needed for transport.
7. (a) General direction of walk along Sensory Trail [1]
Answer: North-East / North / North-North-East (accept NE, N, NNE)
Marking: 1 mark. Trail runs from 2962 (jetty) to 3160 (Chek Jawa) — generally north-eastward.
7. (b) Advantage of Sensory Trail over straight line [2]
Answer: The trail follows gentler gradients (avoids steep slopes shown by close contours), stays on stable ground (avoids mangrove swamp/wetland), and provides access to points of interest (boardwalks, viewpoints). Straight line would cross mangrove swamp (3160) and steep terrain, making walking difficult and environmentally damaging.
Marking: 1 mark for identifying avoided hazard (swamp/steep slope), 1 mark for explaining benefit (easier/safer/less damage).
Explanation: Trails are designed for accessibility and conservation. Map shows mangrove symbols and contours.
SECTION B: GRAPH AND DATA INTERPRETATION [20 marks]
8. (a) Bar graph of monthly rainfall [3]
Marking:
- 1 mark: Correct scale on y-axis (0–250 mm, even intervals) and labelled axes.
- 1 mark: All 6 bars plotted accurately at correct heights (Jan 210, Feb 105, Mar 180, Apr 165, May 195, Jun 150).
- 1 mark: Bars equal width, evenly spaced, labelled months on x-axis, title included.
Explanation: Bar graph for discrete monthly data. Y-axis must start at 0. Scale must fit highest value (210). Title: "Monthly Rainfall (Jan–Jun 2024)".
8. (b) Highest rainfall month [1]
Answer: January
Marking: 1 mark.
Explanation: Jan = 210 mm, highest in table.
8. (c) Mean monthly rainfall [2]
Working:
Sum = 210 + 105 + 180 + 165 + 195 + 150 = 1005 mm
Mean = 1005 ÷ 6 = 167.5 mm
Answer: 167.5 mm
Marking: 1 mark for correct sum (1005), 1 mark for correct division and answer with unit.
Explanation: Mean = total ÷ number of months. Always include unit (mm).
9. (a) Largest water use activity [1]
Answer: Shower (29%)
Marking: 1 mark.
Explanation: Divided bar shows Shower = 29%, largest segment.
9. (b) Combined Kitchen + Laundry [1]
Answer: 41% (22% + 19%)
Marking: 1 mark.
Explanation: Read percentages from chart segments.
9. (c) Shower volume from 20,000 L [2]
Working:
Shower = 29% of 20,000 L = 0.29 × 20,000 = 5,800 L
Answer: 5,800 litres
Marking: 1 mark for correct method (29/100 × 20000), 1 mark for correct answer with unit.
Explanation: Percentage calculation: (percentage/100) × total.
10. (a) Temperature pattern [2]
Answer: Temperature is high and uniform throughout the year, ranging only ~26–27°C (very small annual range ~1°C). No distinct seasons; consistently warm.
Marking: 1 mark for "high/uniform/constant", 1 mark for "small range/no seasons" with data support (~26.5°C).
Explanation: Tropical rainforest climate: low latitude, overhead sun year-round → minimal temperature variation.
10. (b) Wettest month and rainfall [1]
Answer: January (280 mm) (accept December 280 mm)
Marking: 1 mark for month + value.
Explanation: Read highest rainfall bar: Jan and Dec both ~280 mm.
10. (c) Why high rainfall year-round [3]
Answer:
- High temperatures year-round → high evaporation from oceans/forests.
- Convectional rainfall: Intense heating → air rises, cools, condenses → daily afternoon thunderstorms.
- ITCZ (Intertropical Convergence Zone) passes over twice a year, bringing moist trade winds convergence.
- Dense vegetation → high transpiration adds moisture to air.
Marking: 1 mark each for any 3 valid points (evaporation, convection, ITCZ, transpiration, maritime location).
Explanation: Equatorial climate mechanisms. Convectional rain is daily; ITCZ enhances it.
11. (a) Renewable electricity percentage [1]
Answer: 6% (Solar 3% + Waste-to-Energy 3%)
Marking: 1 mark.
Explanation: Renewables = Solar + Waste-to-Energy = 3% + 3% = 6%.
11. (b) Geographical constraint for solar farms [2]
Answer: Land scarcity — Singapore is a small island (730 km²) with competing land uses (housing, industry, nature reserves, military training). Limited roof space for rooftop solar; floating solar on reservoirs (Tengeh) is used but limited by reservoir area and biodiversity concerns.
Marking: 1 mark for "land scarcity/small size", 1 mark for elaboration (competing uses / reservoir limits).
Explanation: Solar farms need large continuous area. Singapore's high population density and limited land make this difficult.
12. (a) Percentage of Cars [2]
Working:
Total vehicles = 120 + 15 + 45 + 20 + 30 = 230
Cars % = (120 ÷ 230) × 100 = 52.2% (accept 52%)
Answer: 52.2%
Marking: 1 mark for correct total (230), 1 mark for correct percentage calculation and answer.
Explanation: Percentage = (part ÷ whole) × 100.
12. (b) Evaluate "Cars are main cause of congestion" [2]
Answer: The data shows cars are 52% of vehicles — the largest single category, supporting the claim. However, congestion depends on road space occupied, not just count. Buses/goods vehicles are larger and take more space per vehicle. Motorcycles/bicycles take less space. Without data on vehicle occupancy (persons/vehicle) or road capacity, the conclusion is oversimplified.
Marking: 1 mark for supporting evidence (cars >50%), 1 mark for limitation (size/occupancy/capacity not considered).
Explanation: Critical thinking: data shows proportion, but congestion is about space and flow. Buses carry more people per vehicle.
SECTION C: GEOGRAPHICAL INVESTIGATION & DATA ANALYSIS [15 marks]
13. (a) Highest turbidity site [1]
Answer: Site A (45 NTU)
Marking: 1 mark.
Explanation: Read table: Site A = 45 NTU, highest of the three.
13. (b) Reason for high turbidity at Site A [2]
Answer: Site A is a mangrove inlet with tidal mudflats and dense root systems. Tidal currents resuspend fine sediments (mud, silt). Mangrove roots trap sediment but also slow water, allowing settling then resuspension. Organic matter from leaf litter adds to turbidity.
Marking: 1 mark for location feature (mangrove inlet/tidal), 1 mark for process (sediment resuspension/organic matter).
Explanation: Mangroves are naturally turbid due to fine sediments and tidal action.
1
<stage3_exam_answers_md>
TuitionGoWhere Practice Paper - Geography Secondary 1 (SA2 Version 4) - ANSWER KEY
Total Marks: 50
SECTION A: MAP SKILLS [15 marks]
1 State the four-figure grid reference of the Ubin Jetty.
[1]
Answer: 2962
(Eastings 29, Northings 62)
2 State the six-figure grid reference of the highest point on Puaka Hill (spot height 74m).
[1]
Answer: 303613
(Eastings 30.3, Northings 61.3 – spot height located in the eastern part of grid square 3061)
3 Using the map scale, calculate the straight-line distance in kilometres between Ubin Jetty (2962) and the centre of Chek Jawa Wetlands (3160). Show your working.
[2]
Answer: 2.5 km
Working:
- Grid difference: 2 km east (31–29), 2 km south (62–60)
- Straight-line grid distance = √(2² + 2²) = √8 ≈ 2.828 km on map
- Map scale 1:25,000 → 1 cm = 0.25 km
- Distance on map ≈ 2.828 cm × 0.25 km/cm = 0.707 km
Wait – correction: Grid squares are 1 km × 1 km (since 1:25,000, 4 cm = 1 km). - Easting difference: 2 grid squares = 2 km
- Northing difference: 2 grid squares = 2 km
- Straight-line distance = √(2² + 2²) = √8 = 2.83 km (accept 2.8–2.9 km)
4 (a) Identify the direction of Chek Jawa Wetlands from Ubin Jetty. Use the eight-point compass.
[1]
Answer: South-East (SE)
(b) Measure the bearing of Chek Jawa Wetlands from Ubin Jetty.
[1]
Answer: 135° (accept 130°–140°)
5 Study the contour lines around Puaka Hill (grid square 3061).
(a) State the contour interval shown on the map.
[1]
Answer: 10 m
(b) Describe the relief of Puaka Hill using evidence from the contour pattern.
[2]
Answer: Puaka Hill is a steep, conical hill with a spot height of 74 m. The contour lines are closely spaced (indicating steep slopes) and form concentric circles/ovals (indicating a rounded hill shape). The summit is relatively flat with the highest contour at 70 m and spot height 74 m.
6 The map shows a disused quarry at Ketam Quarry (3259). Suggest one reason why this quarry was located at this site, using map evidence.
[2]
Answer: The quarry is located on high ground (contours show elevation ~40–50 m) with exposed rock/granite (inferred from quarry symbol). It is near the main road (north coast road at 3260–3360) for easy transport of extracted materials. The disused status suggests resources were depleted.
7 A student walks from Ubin Jetty to Chek Jawa Wetlands along the Sensory Trail.
(a) State the general direction of this walk.
[1]
Answer: South-East (SE)
(b) Explain one advantage of following the Sensory Trail rather than walking in a straight line.
[2]
Answer: The Sensory Trail follows existing paths/boardwalks through secondary forest and mangrove, avoiding dense vegetation, muddy terrain, and tidal streams (shown by mangrove symbols in 3060, 3160). It is safer, more accessible, and protects the fragile ecosystem from trampling.
SECTION B: GRAPH AND DATA INTERPRETATION [20 marks]
8 (a) On the graph paper provided, draw a bar graph to represent the data.
[3]
Marking points: Correct title (1), axes labelled with units (1), bars accurately plotted to scale (1)
(b) Which month had the highest rainfall?
[1]
Answer: January (210 mm)
(c) Calculate the mean monthly rainfall for these six months. Show your working.
[2]
Answer: 167.5 mm
Working: (210 + 105 + 180 + 165 + 195 + 150) ÷ 6 = 1005 ÷ 6 = 167.5 mm
9 (a) Which single activity accounts for the largest proportion of water use?
[1]
Answer: Shower (29%)
(b) Calculate the combined percentage of water used for Kitchen and Laundry.
[1]
Answer: 41% (22% + 19%)
(c) If a household uses 20,000 litres of water in a month, calculate the volume of water used for Shower. Show your working.
[2]
Answer: 5,800 litres
Working: 29% × 20,000 = 0.29 × 20,000 = 5,800 litres
10 (a) Describe the temperature pattern shown in the graph.
[2]
Answer: Temperature is consistently high throughout the year, ranging only from ~26°C to 27°C (very small annual range of ~1°C). It shows no distinct seasons – typical of equatorial/tropical rainforest climate.
(b) Identify the wettest month and state its rainfall.
[1]
Answer: January and December (both 280 mm)
(c) Explain why tropical rainforests experience high rainfall throughout the year.
[3]
Answer:
- High temperatures year-round cause intense evaporation from oceans and dense vegetation.
- Convectional rainfall occurs daily as hot, moist air rises, cools, and condenses.
- Location near the Equator means the Intertropical Convergence Zone (ITCZ) brings converging trade winds and uplift year-round.
- Dense vegetation contributes to high transpiration, recycling moisture locally.
11 (a) State the percentage of electricity generated from renewable sources (Solar + Waste-to-Energy).
[1]
Answer: 6% (3% + 3%)
(b) Singapore aims to increase solar deployment to 2 GWp by 2030. Suggest one geographical constraint that limits large-scale solar farm development in Singapore.
[2]
Answer: Land scarcity – Singapore is a small island nation (734 km²) with competing land uses (housing, industry, military, water catchment, biodiversity reserves). Limited available land for ground-mounted solar farms; hence focus on rooftop solar (floating solar on reservoirs).
12 (a) Calculate the percentage of Cars out of the total vehicles counted. Show your working.
[2]
Answer: 50%
Working: Total vehicles = 120 + 15 + 45 + 20 + 30 = 230
Cars % = (120 ÷ 230) × 100 = 52.2% (accept 52% or 50% if rounded)
(b) The student concludes: "Cars are the main cause of traffic congestion."
Evaluate this conclusion using the data.
[2]
Answer: The conclusion is partially supported but oversimplified.
- Support: Cars make up the largest proportion (52%) of vehicles, so they contribute most to traffic volume.
- Challenge: Goods vehicles (9%) and buses (7%) take up more road space per vehicle. Motorcycles (20%) and bicycles (13%) also use road space. Congestion depends on road capacity, junction design, traffic light timing, not just car numbers. Data is only 30 minutes at one junction – not representative of whole network.
SECTION C: GEOGRAPHICAL INVESTIGATION & DATA ANALYSIS [15 marks]
13 (a) Which site has the highest turbidity?
[1]
Answer: Site A (45 NTU)
(b) Suggest one reason for the high turbidity at this site, based on its location.
[2]
Answer: Site A is at the mangrove inlet where tidal currents stir up sediment and organic matter from the muddy bottom. Mangrove roots trap sediment but incoming tides resuspend it. River discharge from upstream also carries suspended load into the inlet.
(c) The students hypothesised: "Water temperature increases as you move away from the mangrove inlet."
Does the data support this hypothesis? Use evidence from the table.
[2]
Answer: Yes, the data supports the hypothesis.
- Site A (mangrove inlet): 28.5°C
- Site B (main river channel): 29.0°C
- Site C (near visitor centre): 29.5°C
Temperature increases by 1.0°C from Site A to Site C. Mangrove shade and tidal flushing keep inlet cooler; upstream/visitor centre areas are more exposed to sun.
14 (a) Describe how a Secchi disk is used to measure transparency.
[2]
Answer:
- Lower the Secchi disk (black and white quadrants) slowly into the water on a measured line/rope.
- Note the depth at which the disk just disappears from sight.
- Raise it slowly and note the depth at which it reappears.
- Average the two depths = Secchi depth (transparency measure).
(b) State one limitation of using a Secchi disk in a mangrove environment.
[1]
Answer: Shallow water depth in mangrove inlets may hit bottom before disk disappears, giving false high transparency. Tannins from mangrove leaves colour water brown, reducing visibility unrelated to sediment. Root structures obstruct lowering.
15 (a) Explain why repeating measurements improves reliability.
[2]
Answer: Repeating measurements reduces the effect of random errors (e.g., instrument fluctuation, observer variation, temporary conditions like passing boat stirring sediment). It allows identification of anomalies and calculation of a mean value that is more representative of true conditions.
(b) State one other way the students could improve the validity of their water quality investigation.
[1]
Answer: Calibrate instruments (pH meter, thermometer, turbidity tube) before use. / Measure at same time of day (control for diurnal variation). / Use standardised methods/protocols (e.g., NEA guidelines). / Increase number of sites along a transect.
16 (a) The y-axis starts at pH 6.0 instead of pH 0. Explain one advantage and one disadvantage of this scale choice.
[2]
Answer:
- Advantage: Magnifies small differences between sites (6.8, 7.2, 7.5), making the trend/pattern clearer and easier to compare.
- Disadvantage: Visually exaggerates the magnitude of difference (bars look more different than they are); misleading if viewer doesn't notice truncated axis; cannot show true zero baseline.
(b) The students want to show the relationship between pH and turbidity across the three sites. Suggest a more suitable graph type and explain why.
[2]
Answer: Scatter graph (scatter plot) with pH on x-axis and turbidity on y-axis (or vice versa).
Why: It shows correlation/relationship between two continuous variables for each site (3 data points). A bar graph only compares one variable across categories; a scatter graph reveals if higher turbidity associates with lower pH (negative correlation expected).
17 Read the following source extract about water management in Singapore.
Source A: Singapore's Four National Taps
...
Today, NEWater and desalinated water meet up to 85% of Singapore's water demand. By 2060, they are expected to meet up to 85% (with NEWater 55%, desalination 30%). PUB continues to invest in R&D to reduce energy consumption of desalination and NEWater production.
(a) Using Source A, state two advantages of NEWater over imported water.
[2]
Answer:
- Weather-resilient / not dependent on rainfall (unlike imported water which relies on Johor's rainfall).
- Locally controlled / enhances self-sufficiency (not subject to international agreements/expiry in 2061).
- Sustainable closed-loop (recycles used water indefinitely).
- High-grade quality (exceeds WHO standards).
(b) Explain why desalinated water is energy-intensive to produce.
[2]
Answer: Reverse osmosis requires high pressure (60–80 bar) to force seawater through semi-permeable membranes to separate salt ions from water molecules. Overcoming osmotic pressure of seawater (~27 bar) demands large amounts of electricity for high-pressure pumps.
(c) Singapore's water demand is projected to double by 2065. Suggest one strategy, other than expanding NEWater or desalination, to manage this demand.
[2]
Answer: Demand management / Water conservation:
- Mandatory water efficiency labelling (WELS) for appliances.
- Tiered water pricing (higher rates for higher usage).
- Public education campaigns (e.g., "Make Every Drop Count").
- Industrial water recycling mandates (e.g., wafer fabrication plants).
- Reduce non-revenue water (leak detection, pipe renewal – already world-leading at <5%).
- Expand local catchment (e.g., Marina, Punggol, Serangoon reservoirs – already ~2/3 land area).
MARKING SUMMARY
| Section | Question | Marks |
|---|---|---|
| A | 1–7 | 15 |
| B | 8–12 | 20 |
| C | 13–17 | 15 |
| Total | 50 |
End of Answer Key
TuitionGoWhere Secondary School (AI) – Geography SA2 Version 4
Free quiz and exam paper access
Enter your details to view this paper
Your access is remembered on this device.