From Real Exams Exam Paper
Secondary 1 Geography Semestral Assessment 2 (End of Year) Paper 3
Free Sec 1 Geography SA2 Paper 3, HY3 Exam version, with questions, answers, and syllabus-aligned practice for Singapore students.
These static practice materials are generated from the site's syllabus and paper-generation workflow, with source and model context shown so students and parents can evaluate the material before use.
Questions
TuitionGoWhere Exam Practice (AI) — SA2 Geography Secondary 1
School: TuitionGoWhere Secondary School (AI)
Subject: Geography
Level: Secondary 1
Paper: SA2 Practice Paper (Version 3 of 5)
Duration: 60 minutes
Total Marks: 60
Name: ________________________
Class: ________
Date: ____________
Instructions:
- Answer all questions in the spaces provided.
- Read each question carefully and use the figures, tables, and maps given.
- For map questions, give grid references as easting then northing.
- Marks for each question are shown in brackets [ ].
- Section marks and total marks are given at the end of each section.
Section A: Map Reading (20 marks)
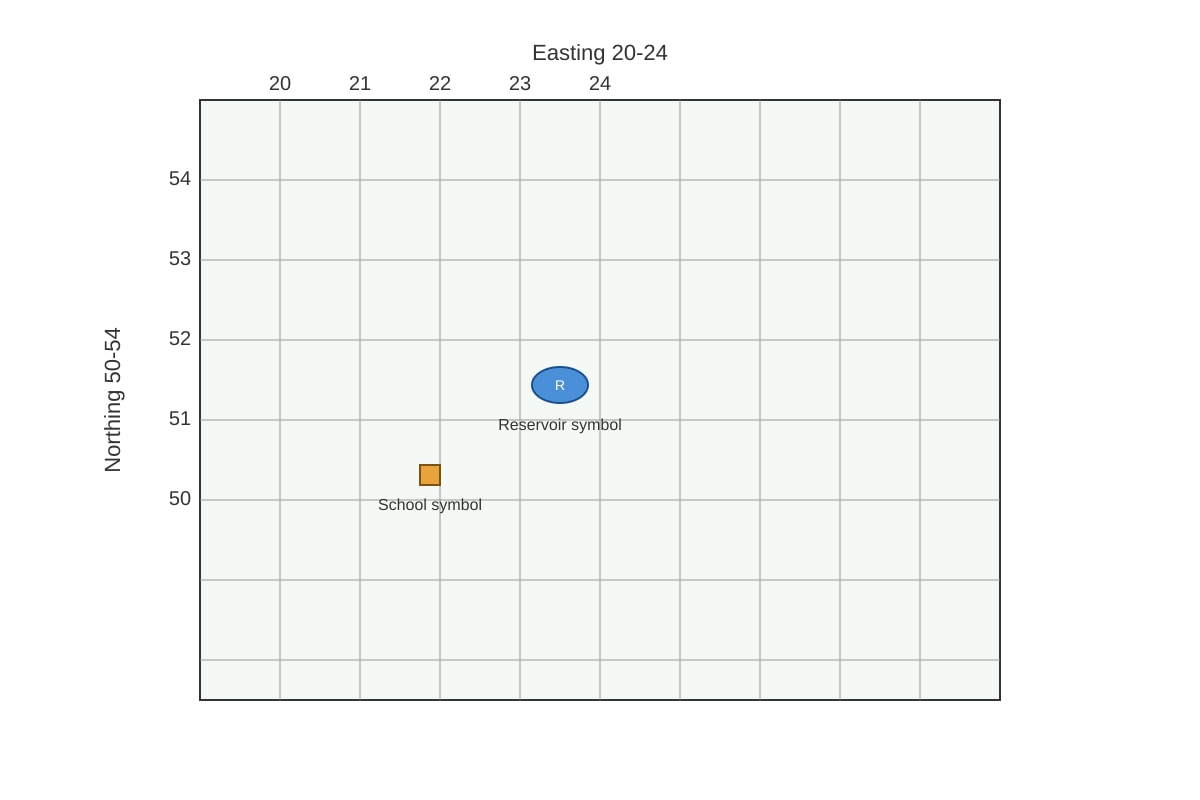
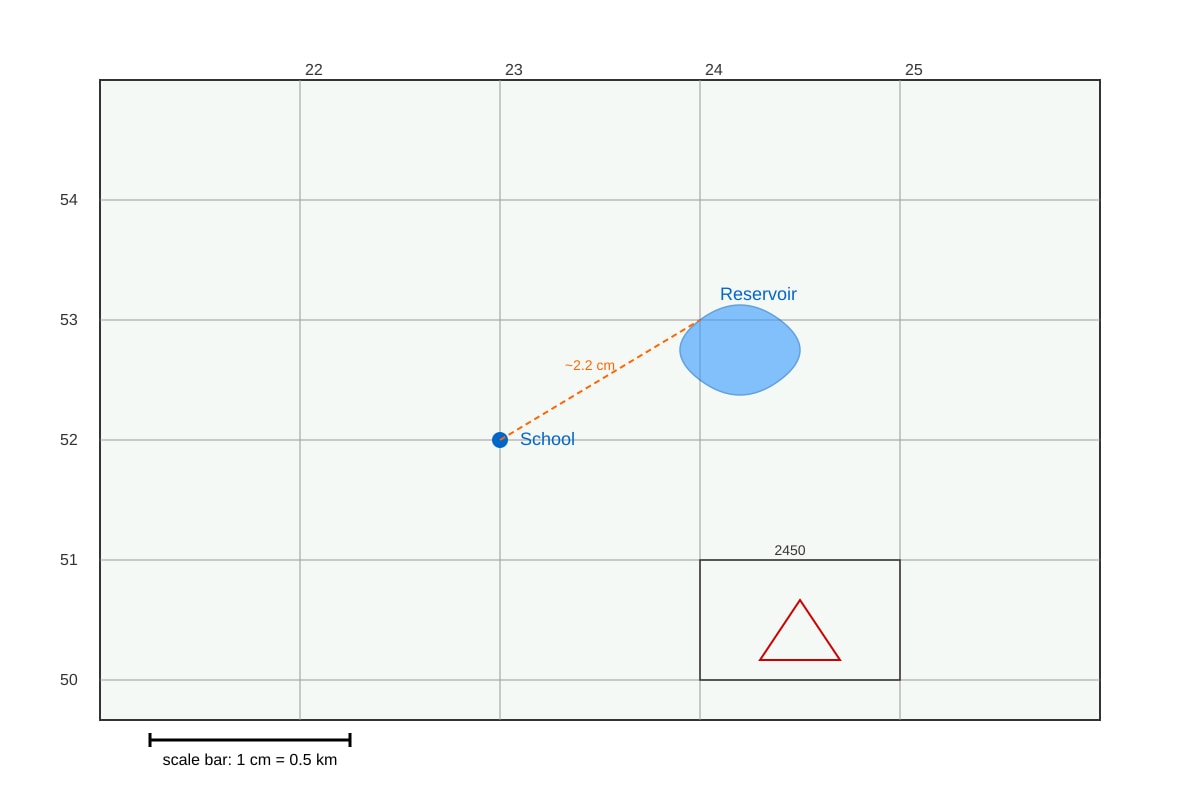
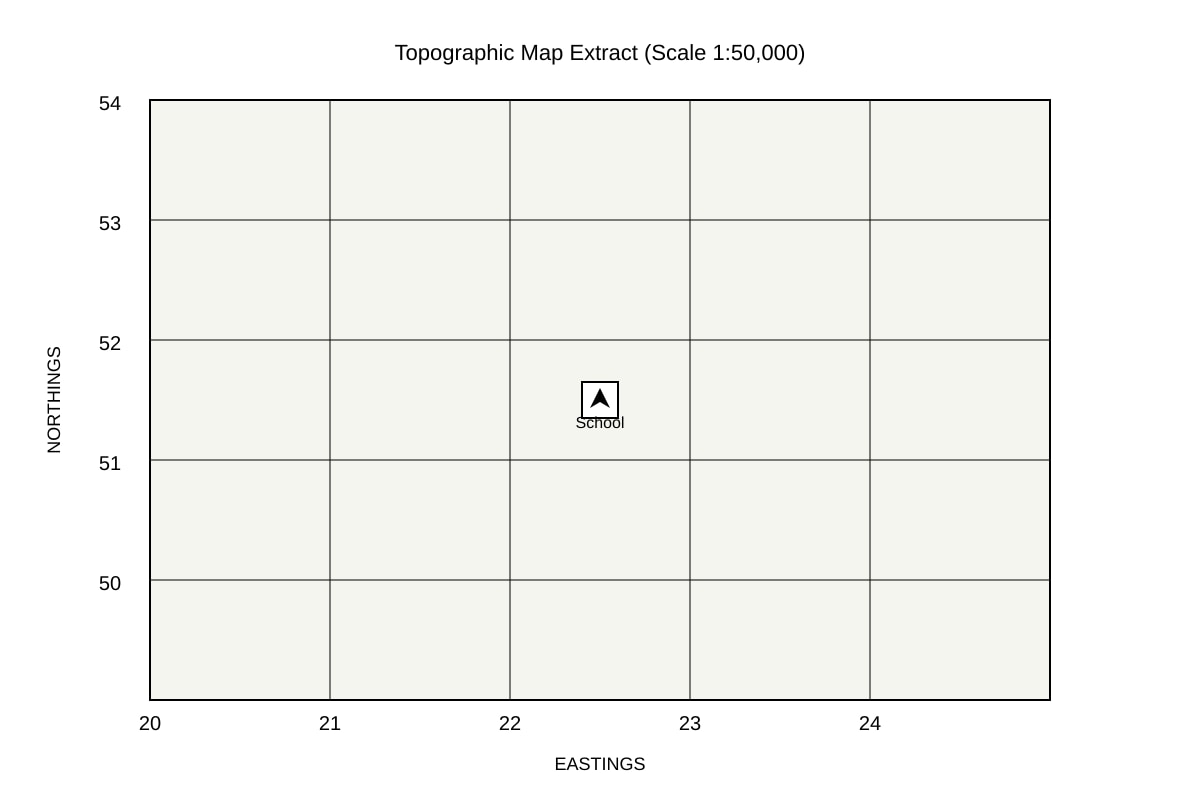
1. Study the map extract below. State the 4-figure grid reference of the school. [1]
Image pending generation: map for Q1.
2. State the 4-figure grid reference of the reservoir shown on the map extract. [1]
Image pending generation: map for Q2.
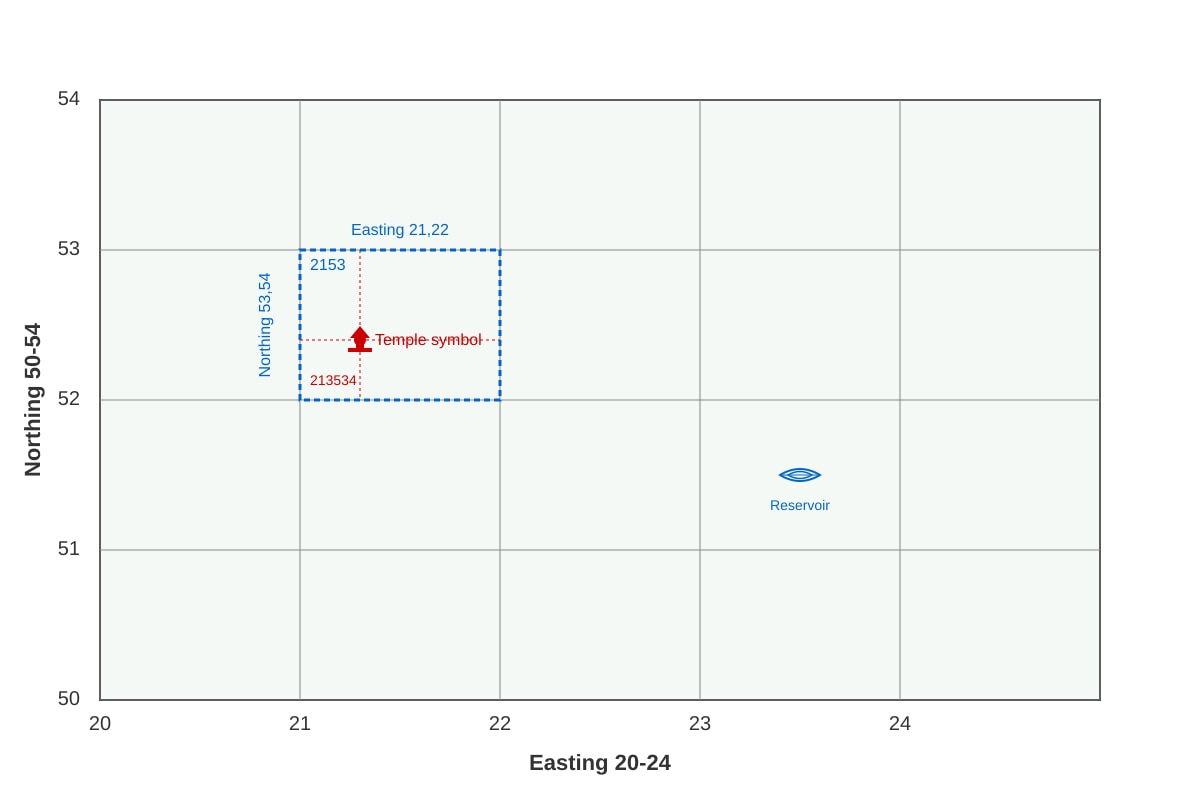
3. State the six-figure grid reference of the temple marked on the map. [1]
Image pending generation: map for Q3.
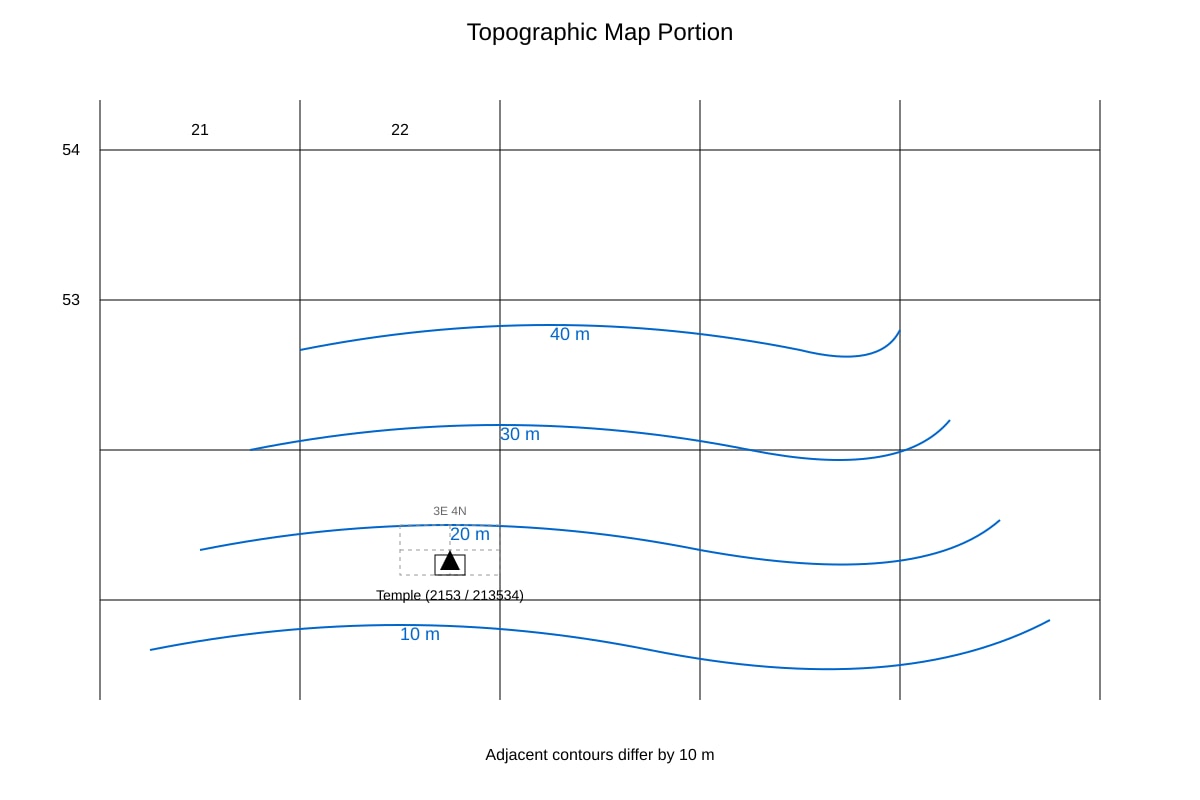
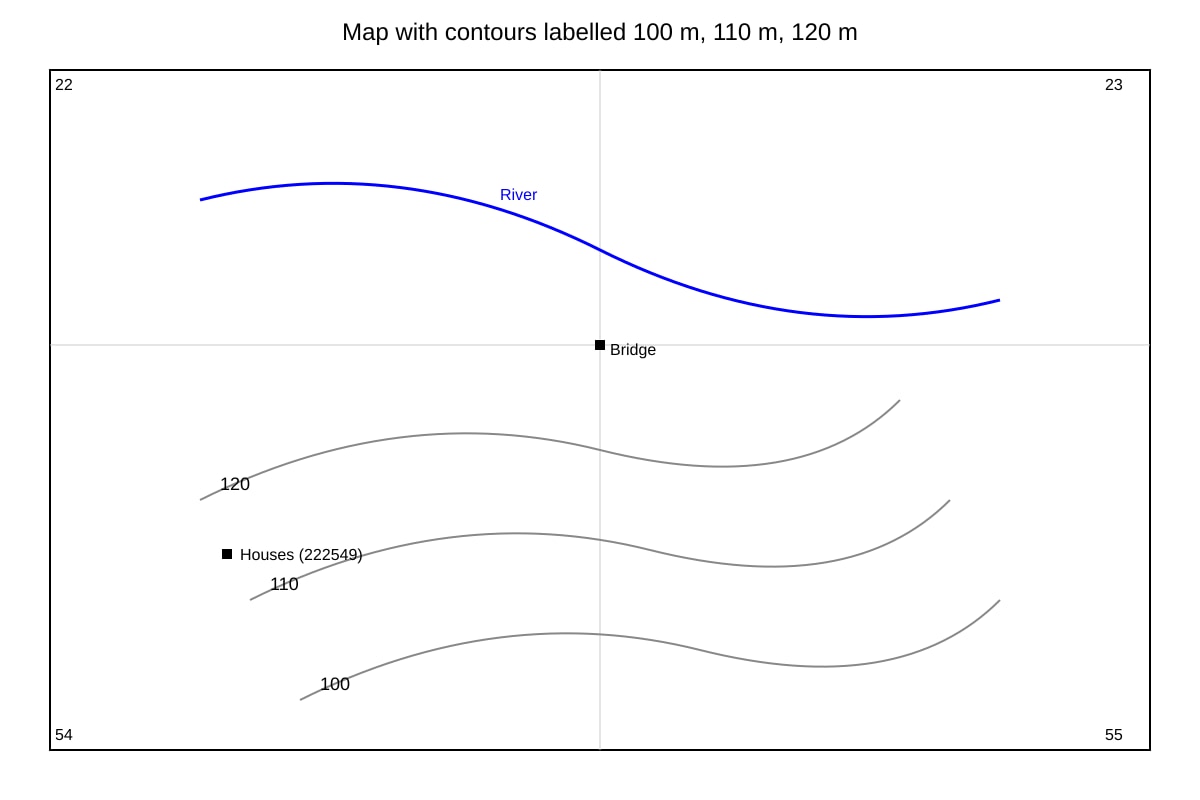
4. State the contour interval of the map shown. [1]
Image pending generation: map for Q4.
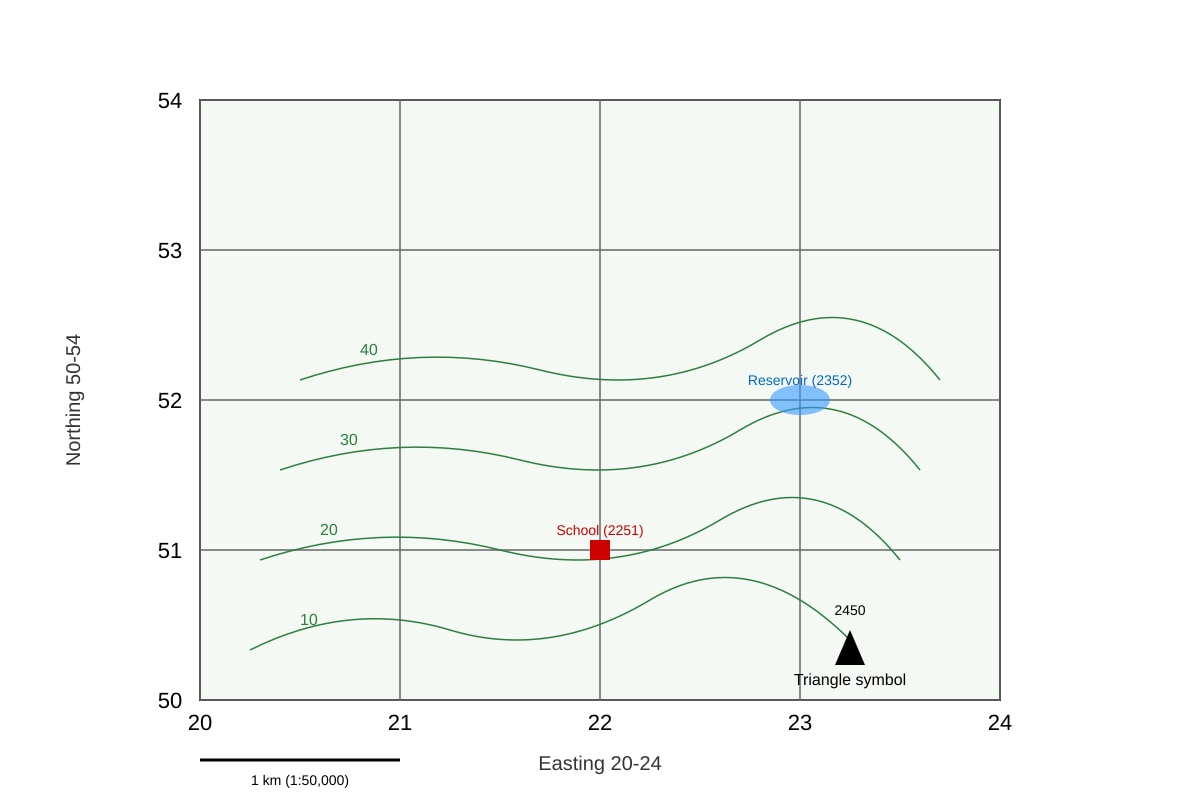
5. Give the 4-figure grid reference of the highest point marked with a triangle on the map. [1]
Image pending generation: map for Q5.
6. Measure the straight-line distance from the school (2251) to the reservoir (2352) using the map scale of 1:50,000. Give your answer in km. [2]
Image pending generation: map for Q6.
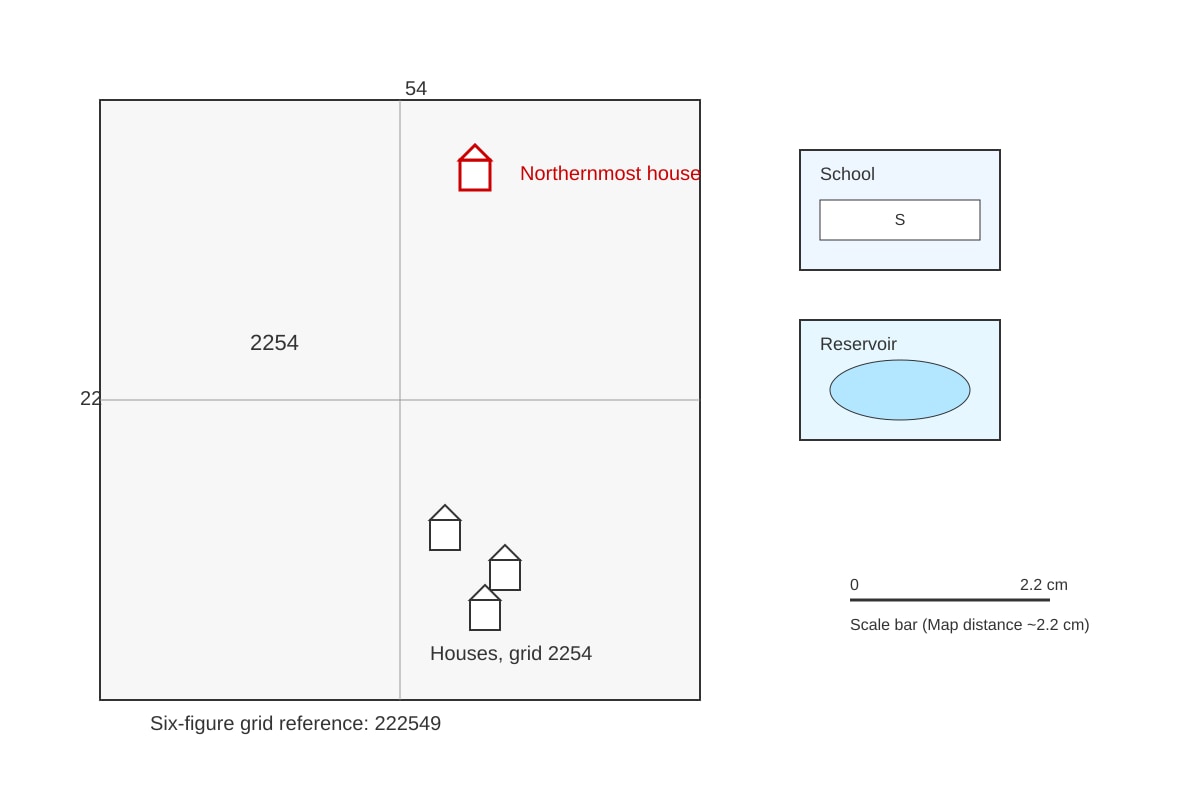
7. State the six-figure grid reference of the northernmost house on the map. [1]
Image pending generation: map for Q7.
8. What is the contour interval shown on the map below? [1]
Image pending generation: map for Q8.
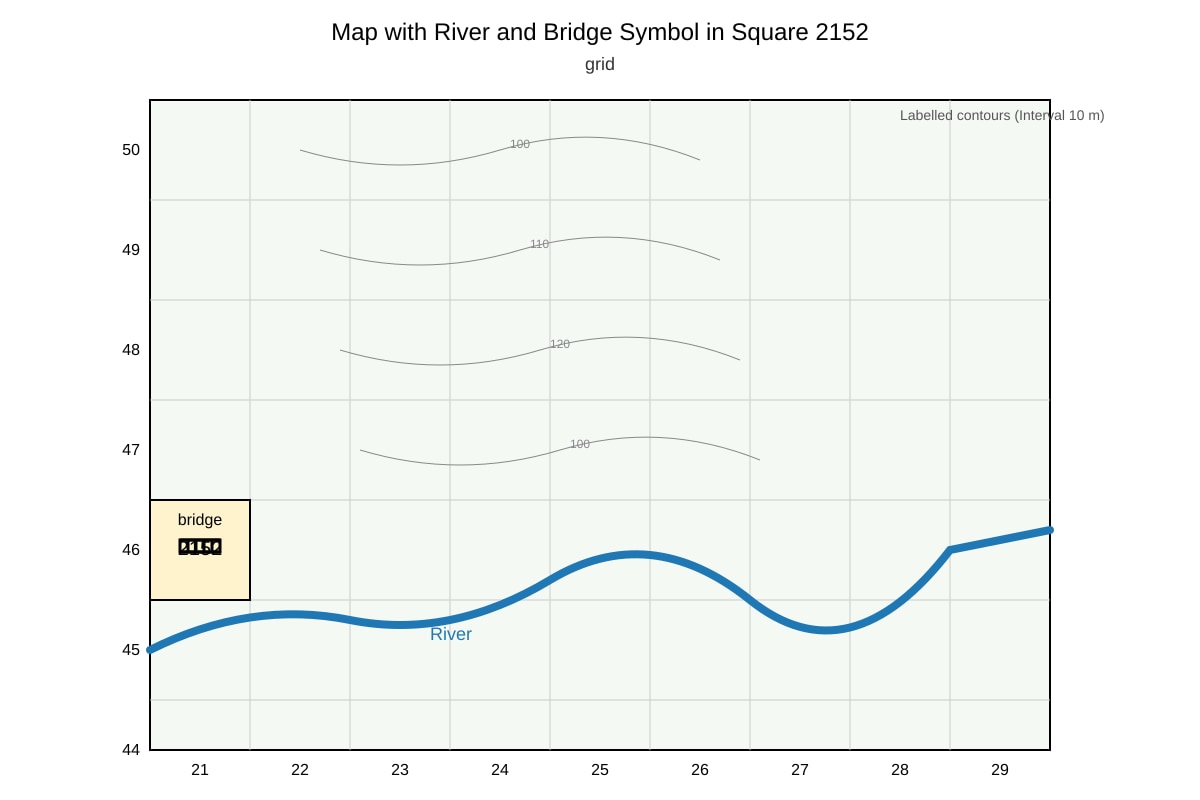
9. State the 4-figure grid reference of the bridge crossing the river. [1]
Image pending generation: map for Q9.
10. Describe one difference between a 4-figure and a 6-figure grid reference. [2]
Section A Total: 20 marks
Section B: Graph and Data Interpretation (20 marks)
11. Study the table below showing rainfall in mm over five months. State the month with the highest rainfall. [1]
| Month | Jan | Feb | Mar | Apr | May |
|---|---|---|---|---|---|
| Rainfall (mm) | 120 | 90 | 200 | 150 | 80 |
12. Using the table in Q11, calculate the mean monthly rainfall. [2]
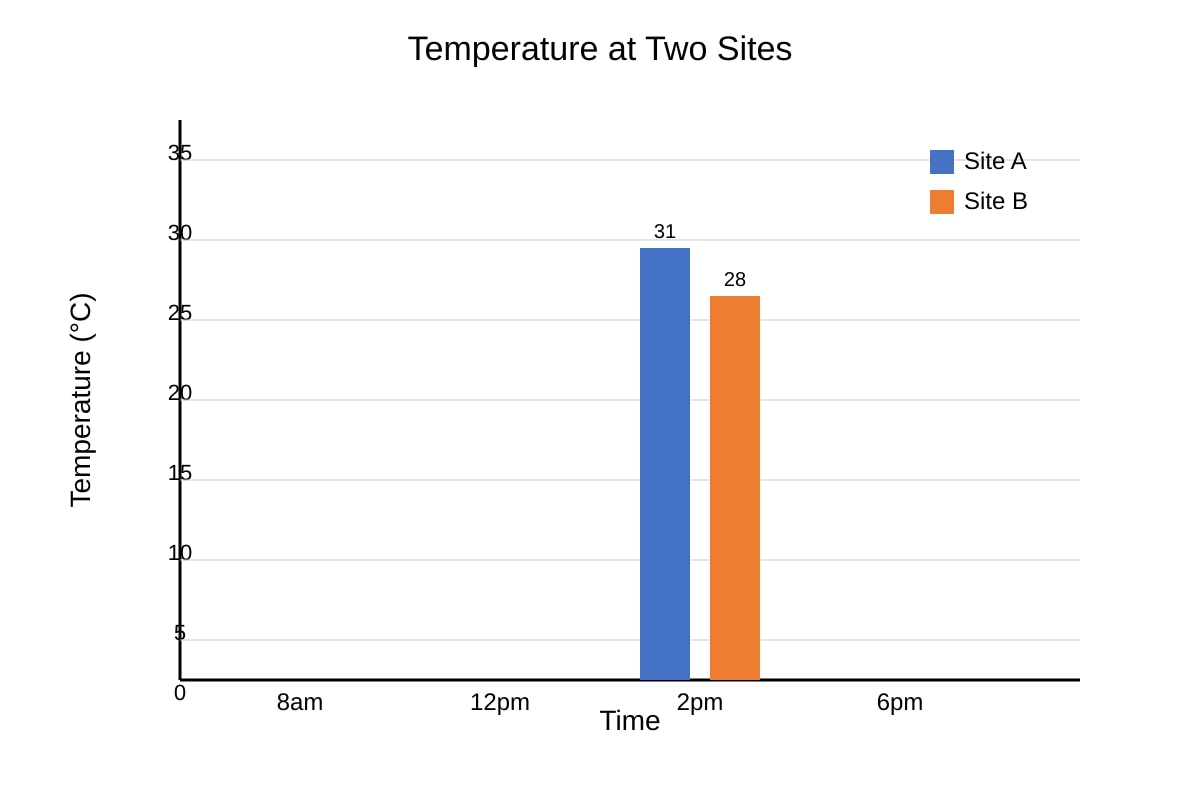
13. Study the bar graph of temperature at two sites. State which site has a higher temperature at 2 pm. [1]
Image pending generation: graph for Q13.
14. With reference to the graph in Q13, describe the temperature pattern of Site A from 8 am to 6 pm. [3]
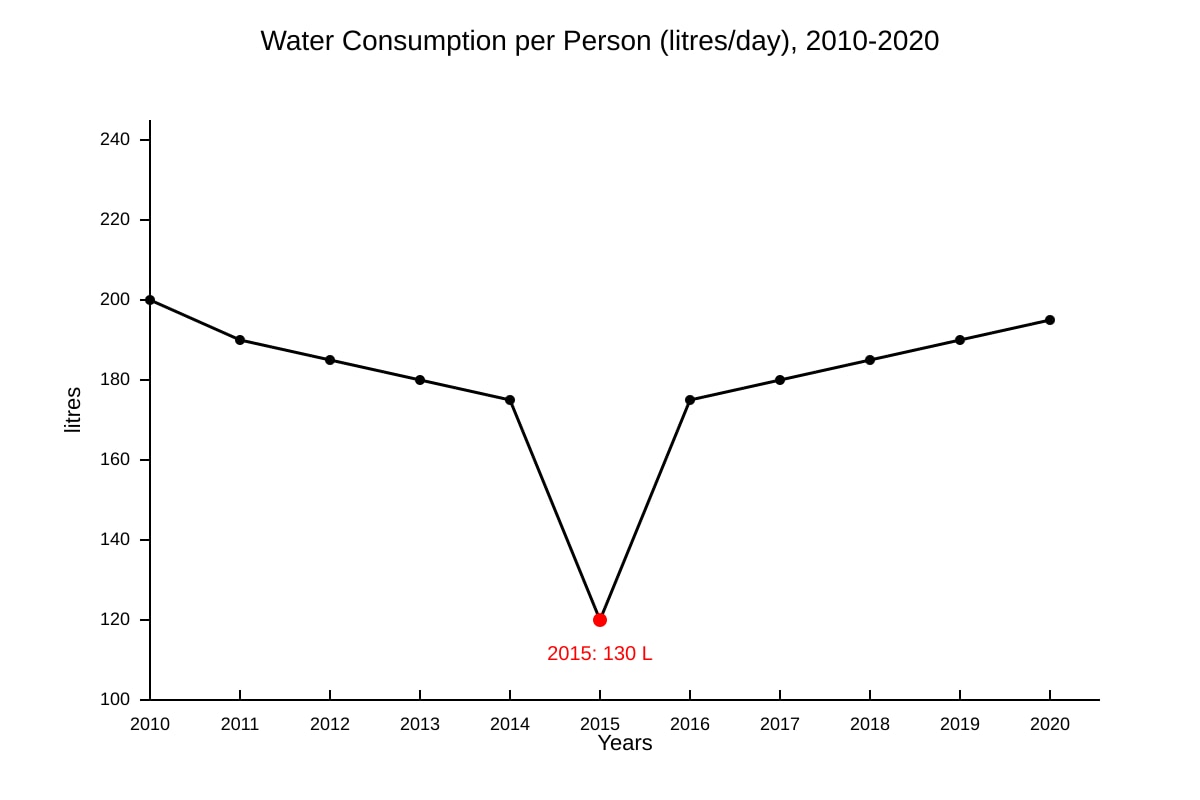
15. Study the line graph of water consumption per person (litres/day) from 2010 to 2020. State the year when consumption was lowest. [1]
Image pending generation: graph for Q15.
16. Using the graph in Q15, describe the trend in water consumption from 2010 to 2020. [3]
17. The table shows dissolved oxygen (mg/L) at two river sites. Which site has better water quality? Give a reason. [2]
| Site | X | Y |
|---|---|---|
| Dissolved oxygen (mg/L) | 4 | 8 |
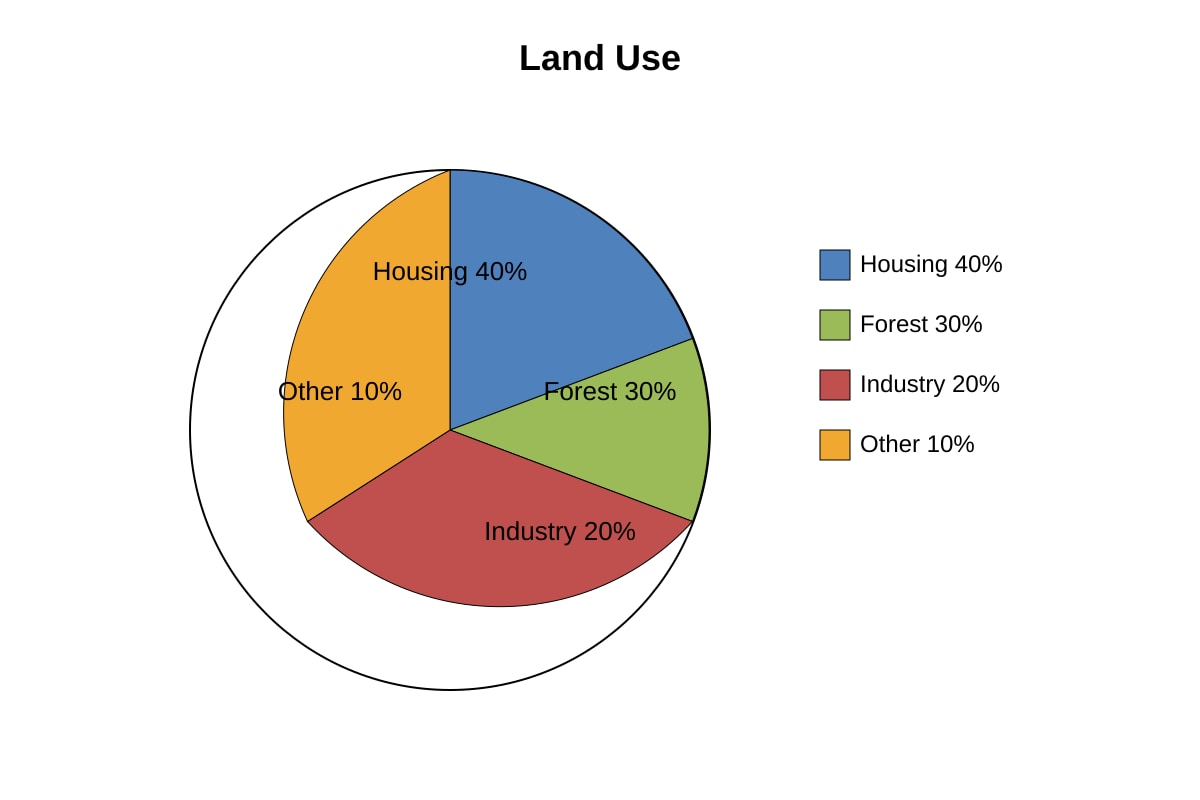
18. Study the pie chart of land use. State the percentage of land used for housing. [1]
Image pending generation: chart for Q18.
19. Using the pie chart in Q18, calculate the angle of the housing slice. [2]
20. A class tested turbidity (NTU) at two sites: Site P = 15, Site Q = 5. Explain which site is healthier for aquatic life. [3]
Section B Total: 20 marks
Section C: Integrated Map and Data Skills (20 marks)
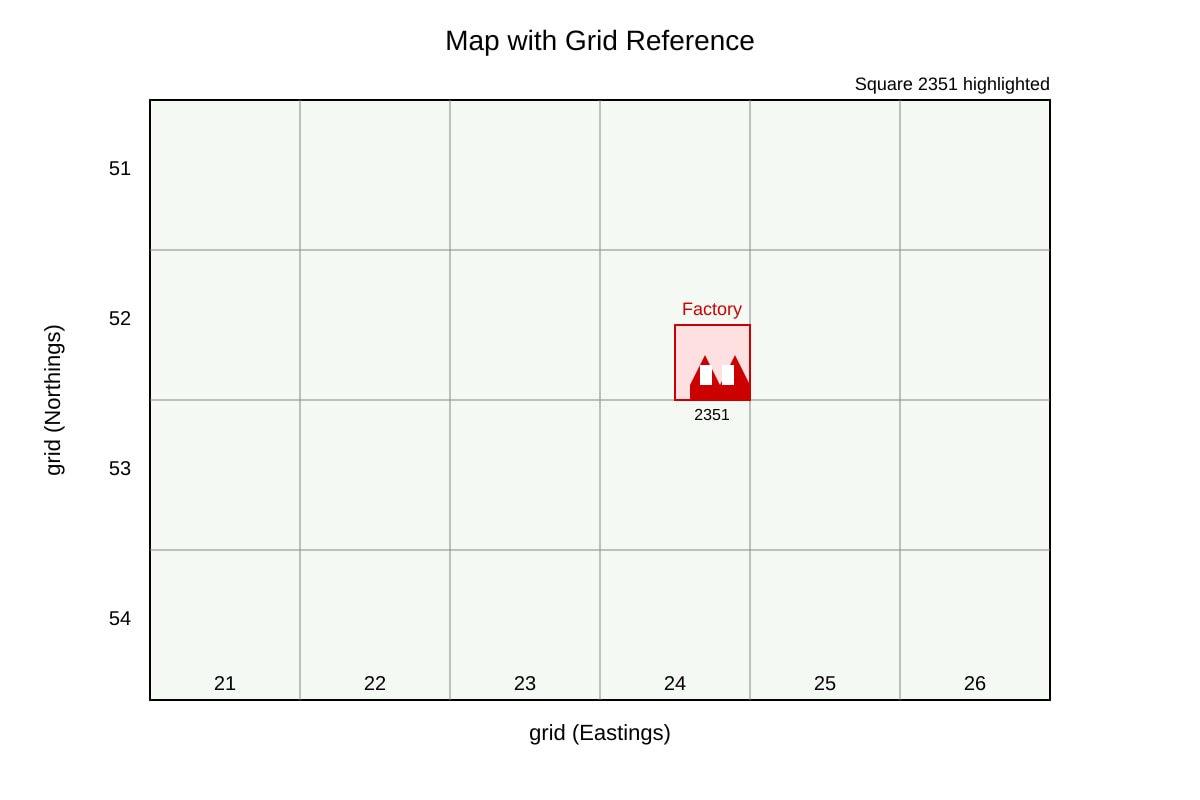
21. Study the map and table. State the 4-figure grid reference of the polluted factory. [1]
Image pending generation: map for Q21.
| Site | Near factory (2351) | Away (2153) |
|---|---|---|
| Turbidity (NTU) | 20 | 6 |
22. Using the table in Q21, state which site has lower turbidity. [1]
23. Explain why the site near the factory has higher turbidity using map evidence. [2]
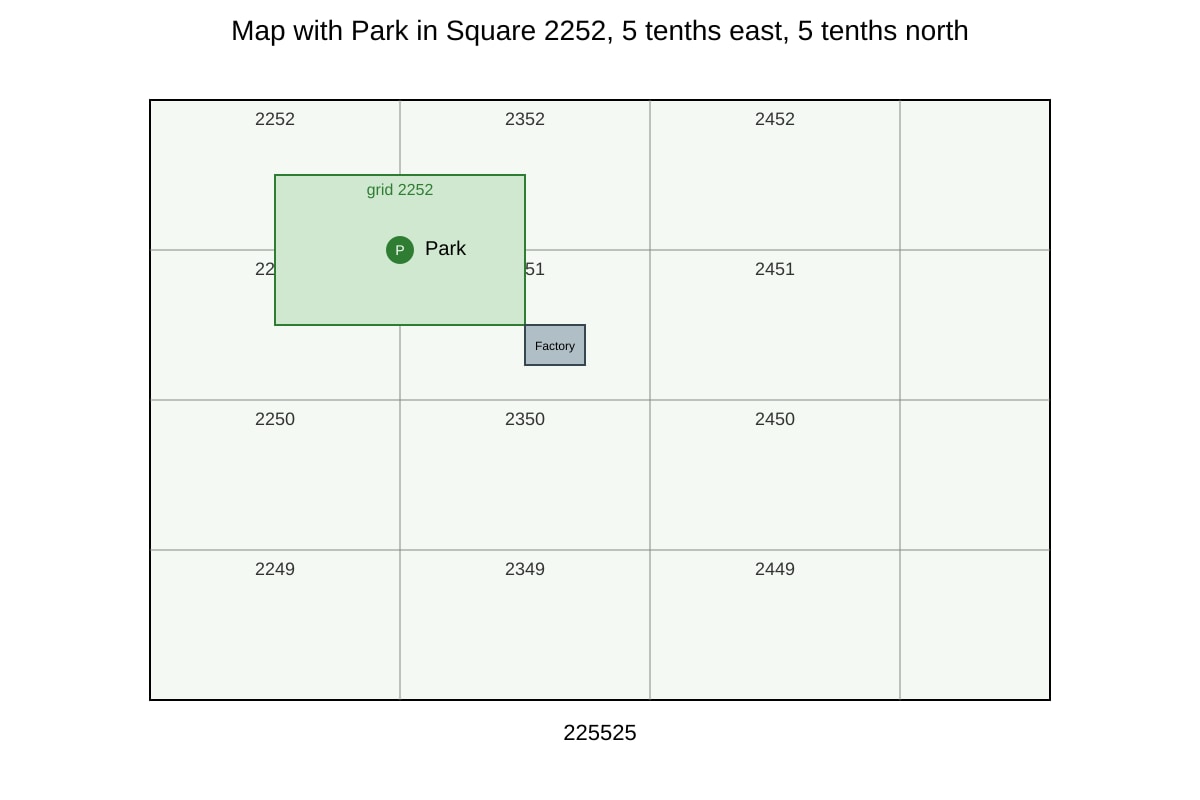
24. State the 6-figure grid reference of the park on the map. [1]
Image pending generation: map for Q24.
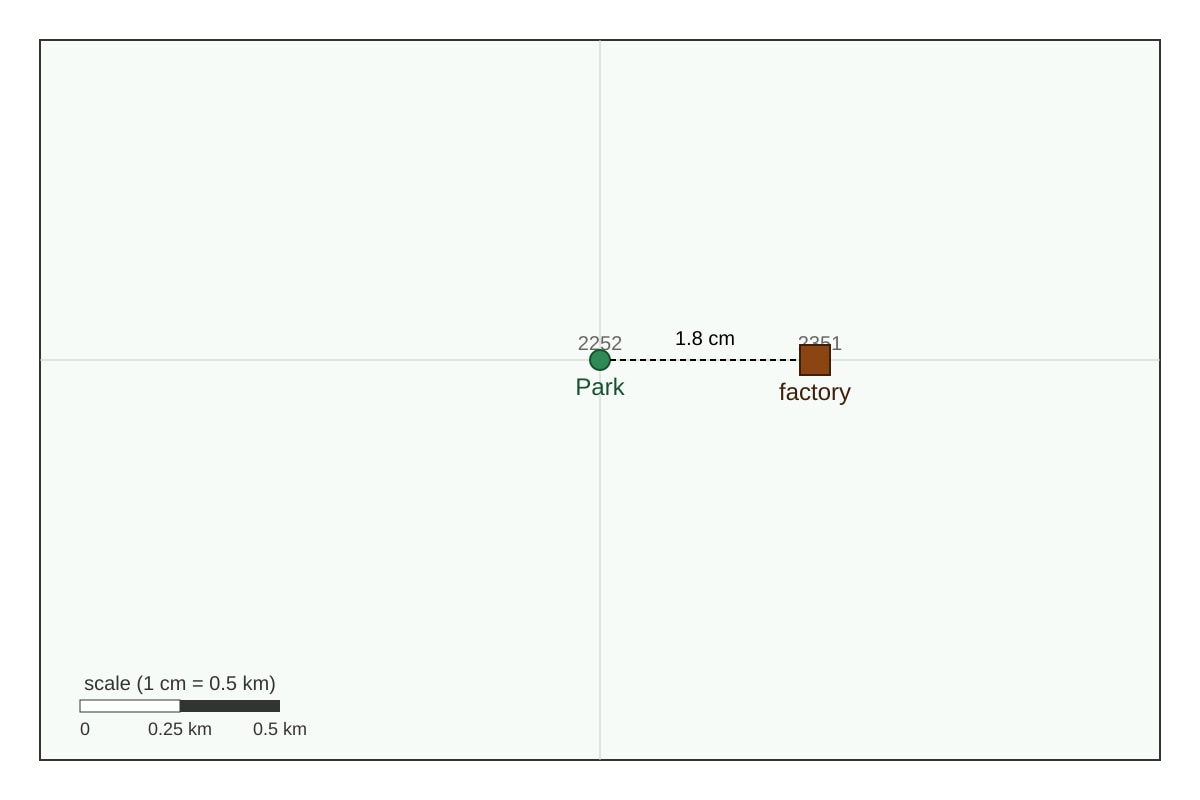
25. Measure the distance from the park (2252) to the factory (2351) using 1:50,000 scale. [2]
Image pending generation: map for Q25.
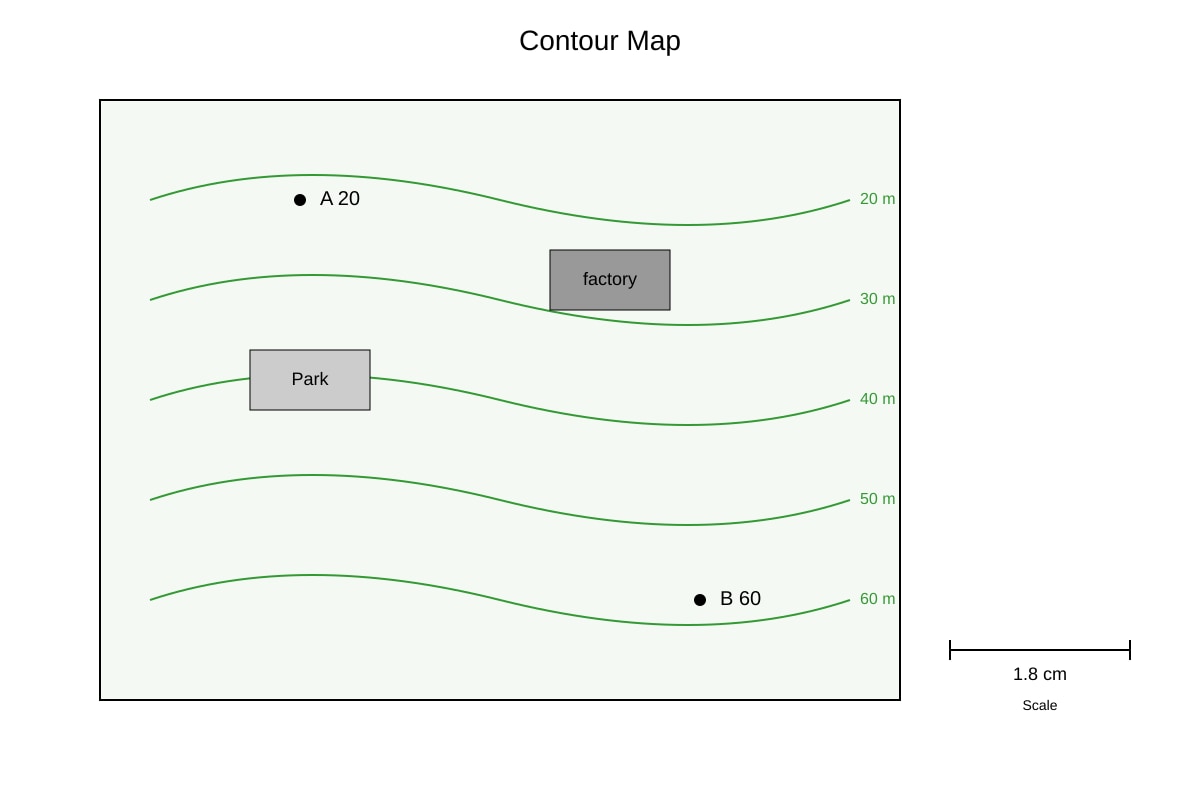
26. Study the contour map. State the relief (difference in height) between point A (20 m) and point B (60 m). [1]
Image pending generation: map for Q26.
27. Describe the pattern shown in the table of mangrove tree height by distance from shore. [3]
| Distance from shore (m) | 0 | 50 | 100 | 150 |
|---|---|---|---|---|
| Tree height (m) | 2 | 5 | 8 | 10 |
28. State the contour interval of the map in Q26. [1]
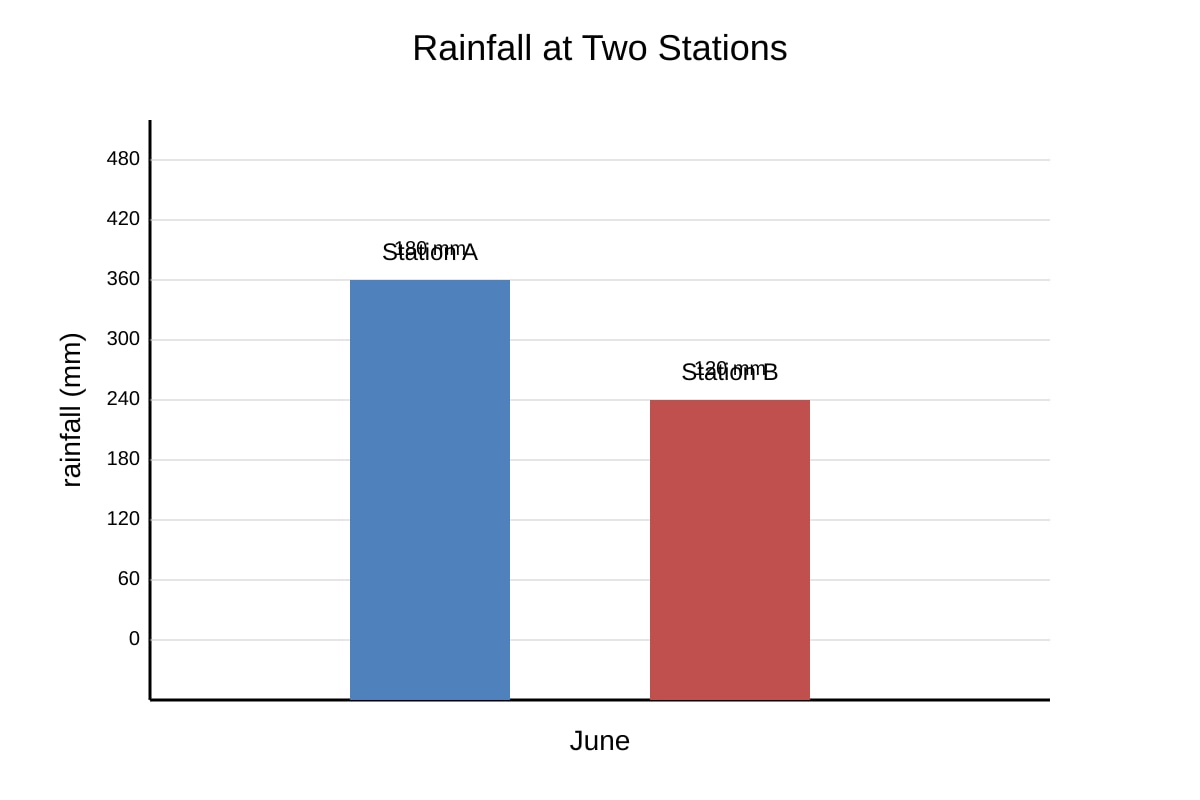
29. Using the bar graph of rainfall at two stations, state which station is wetter in June. [1]
Image pending generation: graph for Q29.
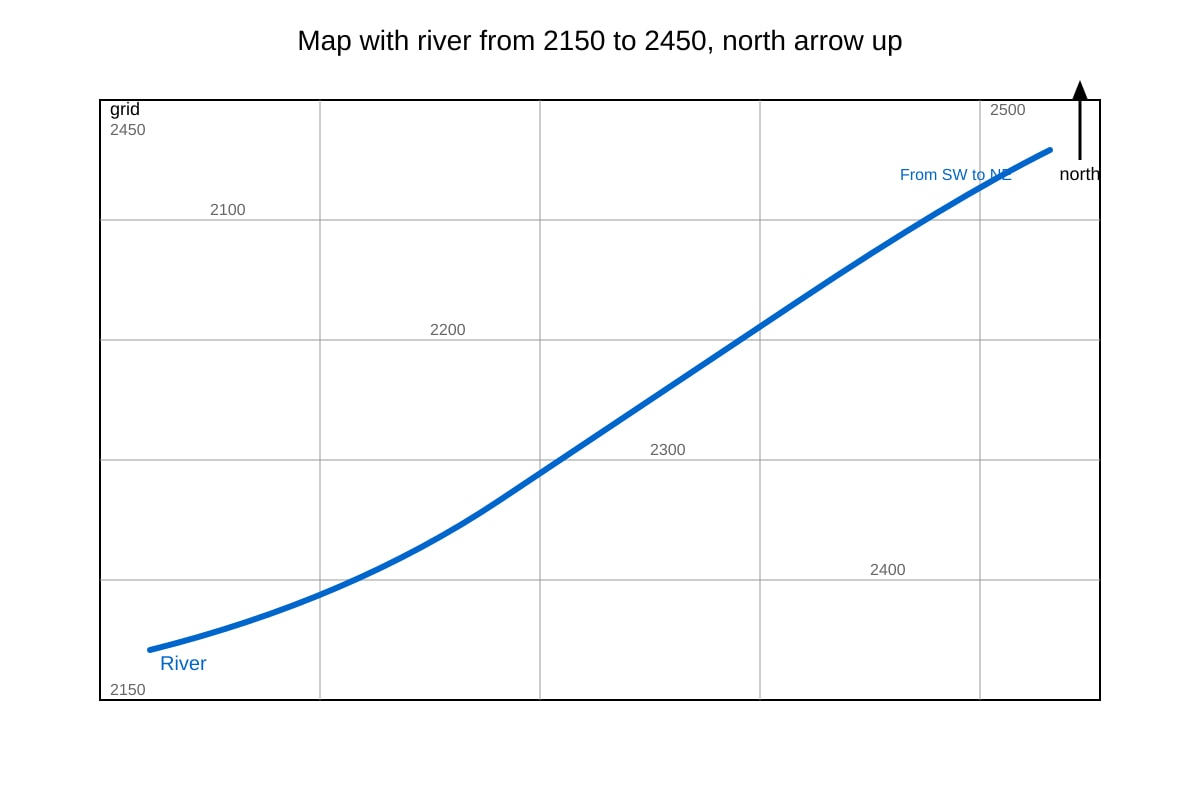
30. A map shows a river flowing from grid 2150 to 2450. State the direction of flow. [2]
Image pending generation: map for Q30.
31. Using the table below, describe the trend in forest area from 2000 to 2020. [3]
| Year | 2000 | 2010 | 2020 |
|---|---|---|---|
| Forest area (km²) | 500 | 350 | 200 |
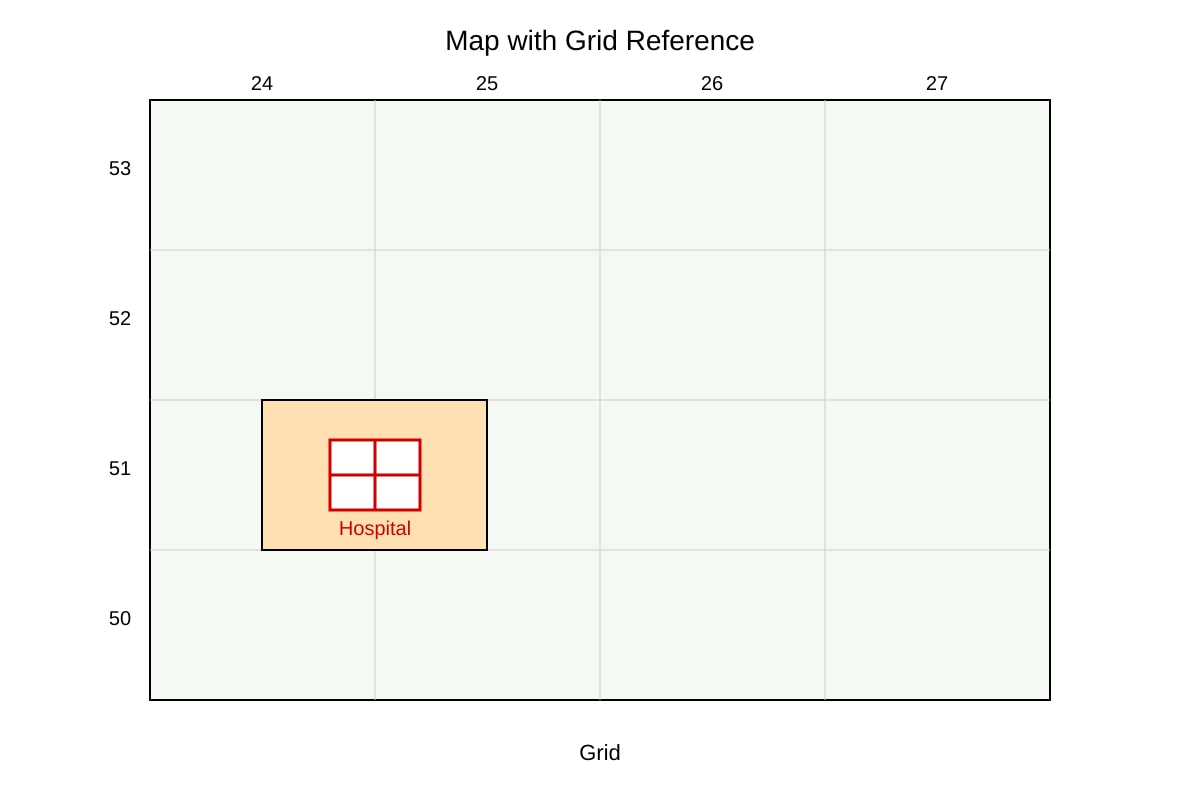
32. State the 4-figure grid reference of the hospital. [1]
Image pending generation: map for Q32.
33. Calculate the mean of the following water pH readings: 6.5, 7.0, 7.5. [2]
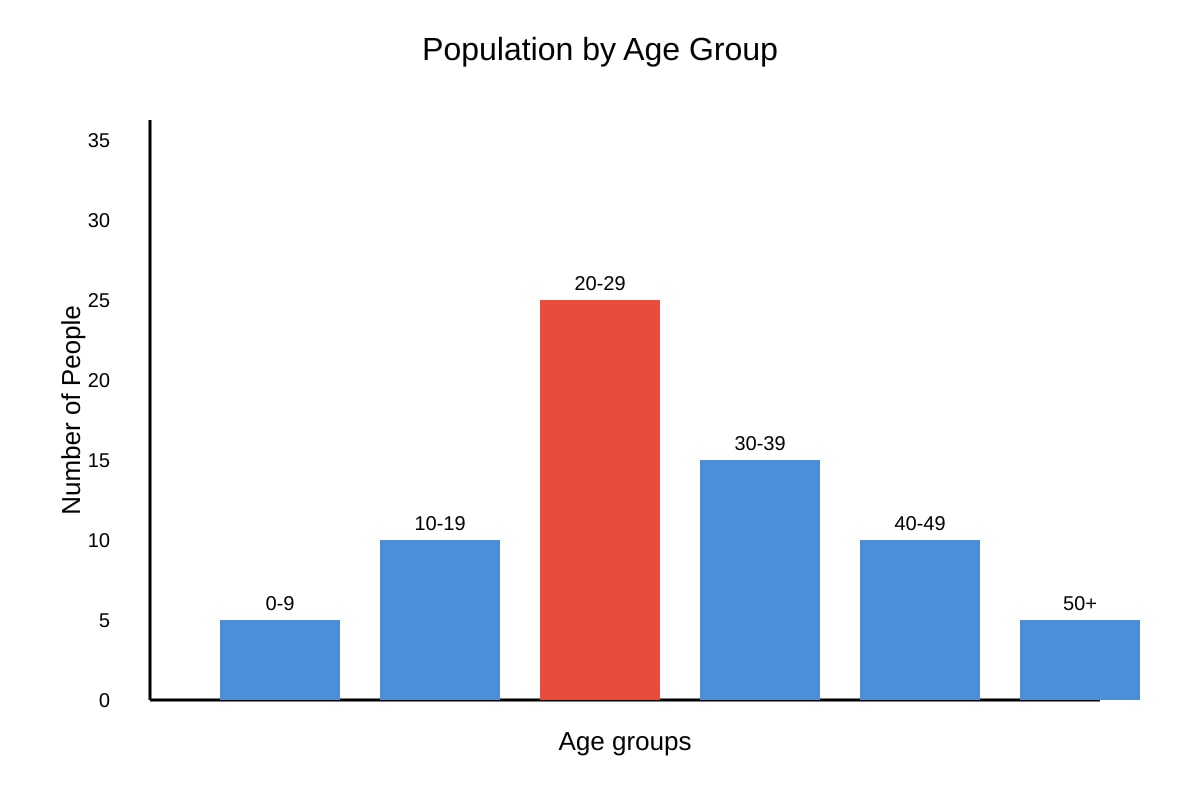
34. Study the graph of population by age group. State the largest group. [1]
Image pending generation: graph for Q34.
35. Explain how a 6-figure grid reference helps locate a point more precisely than a 4-figure reference. [2]
Section C Total: 20 marks
Total Marks: 60
Answers
TuitionGoWhere Exam Practice (AI) — SA2 Geography Secondary 1 (Version 3) Answer Key
Section A: Map Reading (20 marks)
1. [1] 2251
Teaching note: Grid reference is read easting (across, 22) then northing (up, 51). Use lower-left corner of the square containing the school.
2. [1] 2352
Teaching note: Easting 23, northing 52 from lower-left of reservoir square.
3. [1] 213534
Teaching note: 4-fig base = 2153. Temple is 3/10 east (→3) and 4/10 north (→4), so 213534. Common mistake: reversing easting/northing order.
4. [1] 10 m
Teaching note: Contour interval = difference between adjacent labelled contours (20−10 = 10 m).
5. [1] 2450
Teaching note: Triangle (spot height) is in square with lower-left 24 east, 50 north.
6. [2] 1.1 km
Working: Map distance = 2.2 cm. Scale 1:50,000 → 1 cm = 0.5 km. 2.2 × 0.5 = 1.1 km.
Marking: 1 mark measurement, 1 mark conversion.
7. [1] 222549
Teaching note: Base 2254, northernmost house 2/10 east, 9/10 north → 222549.
8. [1] 10 m
Teaching note: 110−100 = 10 m.
9. [1] 2152
Teaching note: Bridge in square 21 east, 52 north.
10. [2] A 4-figure grid reference gives a 1 km × 1 km square (on 1:50,000 map); a 6-figure gives a precise point within that square by dividing it into 100 smaller parts.
Marking: 1 mark each for identifying precision difference.
Section A Total: 20 marks
Section B: Graph and Data Interpretation (20 marks)
11. [1] March
Teaching note: Highest value in table = 200 mm (Mar).
12. [2] 128 mm
Working: (120+90+200+150+80) ÷ 5 = 640 ÷ 5 = 128 mm.
Marking: 1 mark sum, 1 mark division.
13. [1] Site A
Teaching note: At 2 pm, Site A = 31°C > Site B = 28°C.
14. [3] Site A rises from 8 am to a peak at 2 pm (31°C), then falls by 6 pm.
Marking: 1 mark rise, 1 mark peak stated, 1 mark fall/description with values.
15. [1] 2015
Teaching note: Lowest point on line graph = 130 L at 2015.
16. [3] Consumption was 160 L in 2010, fell to 130 L by 2015, then rose slightly to 140 L by 2020; overall a decrease then partial recovery.
Marking: 1 mark start, 1 mark low, 1 mark end/trend.
17. [2] Site Y; higher dissolved oxygen (8 mg/L) means better water quality.
Marking: 1 mark site, 1 mark reason.
18. [1] 40%
Teaching note: Housing slice labelled 40%.
19. [2] 144°
Working: 40% of 360° = 0.40 × 360 = 144°.
Marking: 1 mark % use, 1 mark answer.
20. [3] Site Q is healthier (turbidity 5 NTU < 15 NTU). Lower turbidity means clearer water, more light, better for aquatic plants and animals.
Marking: 1 mark site, 2 marks reasoning.
Section B Total: 20 marks
Section C: Integrated Map and Data Skills (20 marks)
21. [1] 2351
Teaching note: Factory in square 23 east, 51 north.
22. [1] Away (2153)
Teaching note: Turbidity 6 < 20.
23. [2] Factory may release waste into river increasing suspended particles; map shows factory at 2351 near water.
Marking: 1 mark cause, 1 mark map link.
24. [1] 225525
Teaching note: Base 2252, 5/10 east, 5/10 north → 225525.
25. [2] 0.9 km
Working: 1.8 cm × 0.5 km/cm = 0.9 km.
26. [1] 40 m
Teaching note: 60 − 20 = 40 m.
27. [3] Tree height increases with distance from shore: 2 m at 0 m to 10 m at 150 m.
Marking: 1 mark start, 1 mark end, 1 mark trend.
28. [1] 20 m (or as labelled; from Q26 contours 20,40,60 → interval 20 m)
Teaching note: If contours are 20,40,60 then interval = 20 m.
29. [1] Station A
Teaching note: June 180 > 120 mm.
30. [2] South-west to north-east (or NE)
Teaching note: From 2150 (SW) to 2450 (NE). 1 mark start, 1 mark direction.
31. [3] Forest area fell from 500 km² (2000) to 200 km² (2020), a continuous decline.
Marking: 1 mark 2000, 1 mark 2020, 1 mark trend.
32. [1] 2453
Teaching note: Hospital in square 24 east, 53 north.
33. [2] 7.0
Working: (6.5+7.0+7.5) ÷ 3 = 21 ÷ 3 = 7.0.
34. [1] 20–29 years
Teaching note: Largest bar.
35. [2] 6-figure splits the 1 km square into 10×10, locating point to 100 m accuracy vs 1 km for 4-figure.
Marking: 1 mark subdivision, 1 mark accuracy.
Section C Total: 20 marks
Total Marks: 60
Free quiz and exam paper access
Enter your details to view this paper
Your access is remembered on this device.