From Real Exams Exam Paper
Secondary 1 Geography Semestral Assessment 2 (End of Year) Paper 2
Free Sec 1 Geography SA2 Paper 2, Nemo3 Exam version, with questions, answers, and syllabus-aligned practice for Singapore students.
These static practice materials are generated from the site's syllabus and paper-generation workflow, with source and model context shown so students and parents can evaluate the material before use.
Questions
TuitionGoWhere Practice Paper - Geography Secondary 1
TuitionGoWhere Secondary School (AI)
Subject: Geography
Level: Secondary 1 (G2/G3)
Paper: SA2 Version 2
Duration: 1 hour 30 minutes
Total Marks: 50
Name: ________________________
Class: ________________________
Date: ________________________
Instructions to Candidates
- Write your name, class, and date in the spaces provided above.
- Answer all questions in the spaces provided.
- The number of marks is given in brackets [ ] at the end of each question or part question.
- The total number of marks for this paper is 50.
- You may use a calculator where necessary.
- For map-based questions, refer to the map extract provided in the insert (separate sheet).
Section A: Map Skills [15 marks]
Question 1
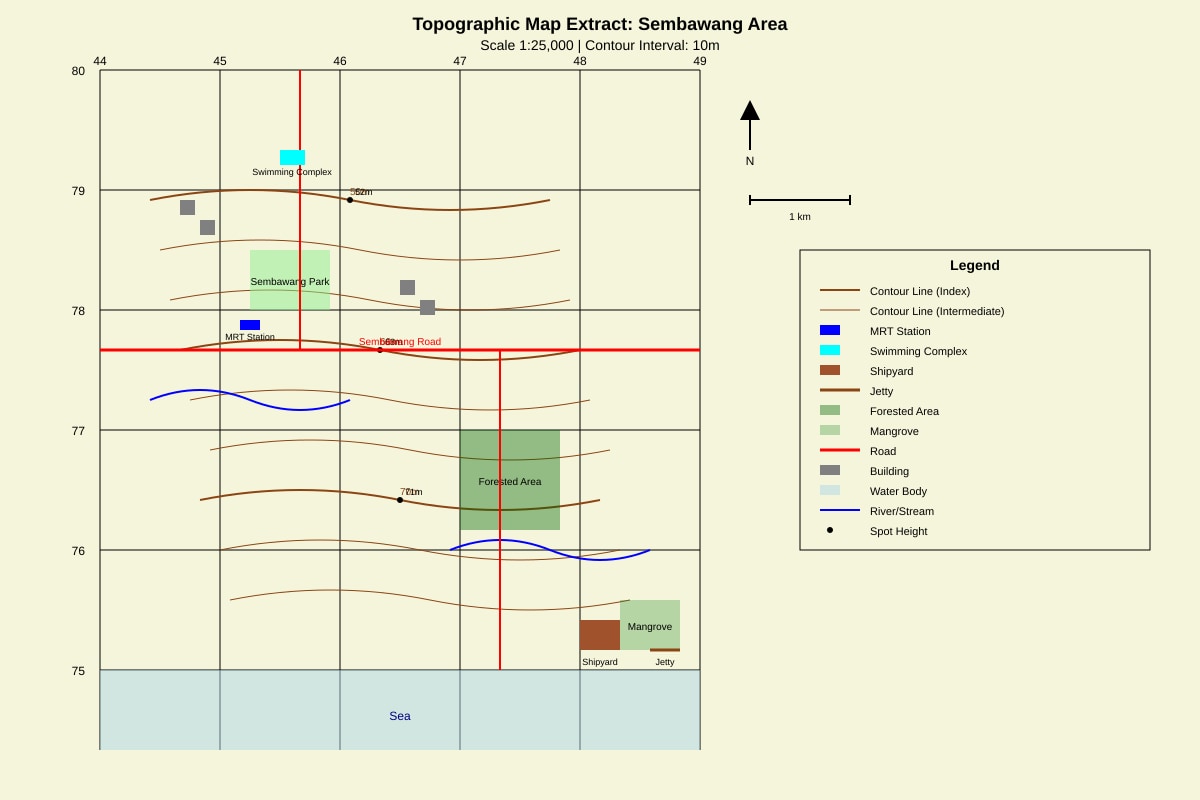
Study the map extract of Sembawang Area (Insert 1) which shows a scale of 1:25,000.
(a) State the six-figure grid reference of the Sembawang Park Jetty. [1]
(b) State the four-figure grid reference of the swimming complex located north of Sembawang Road. [1]
(c) Measure the straight-line distance between the Sembawang MRT Station (grid square 4578) and the Sembawang Shipyard (grid square 4875). Give your answer in kilometres. [2]
(d) Calculate the actual area of the forested area bounded by grid lines 44, 46, 77, and 79. Give your answer in square kilometres. [2]
Question 2
Generated map for Q2.
(a) Identify the contour interval shown on the map extract. [1]
(b) What is the height of the highest point in grid square 4577? [1]
(c) Describe the relief of the area in grid squares 4676 and 4776. [2]
(d) Using map evidence, suggest one reason why the Sembawang Shipyard is located at the coast. [2]
Question 3
The map extract shows a mangrove swamp in grid square 4478.
(a) State the direction of the mangrove swamp from the Sembawang Park Jetty. [1]
(b) Explain why mangroves are found at this location, using map evidence to support your answer. [3]
Section B: Graph and Data Skills [20 marks]
Question 4
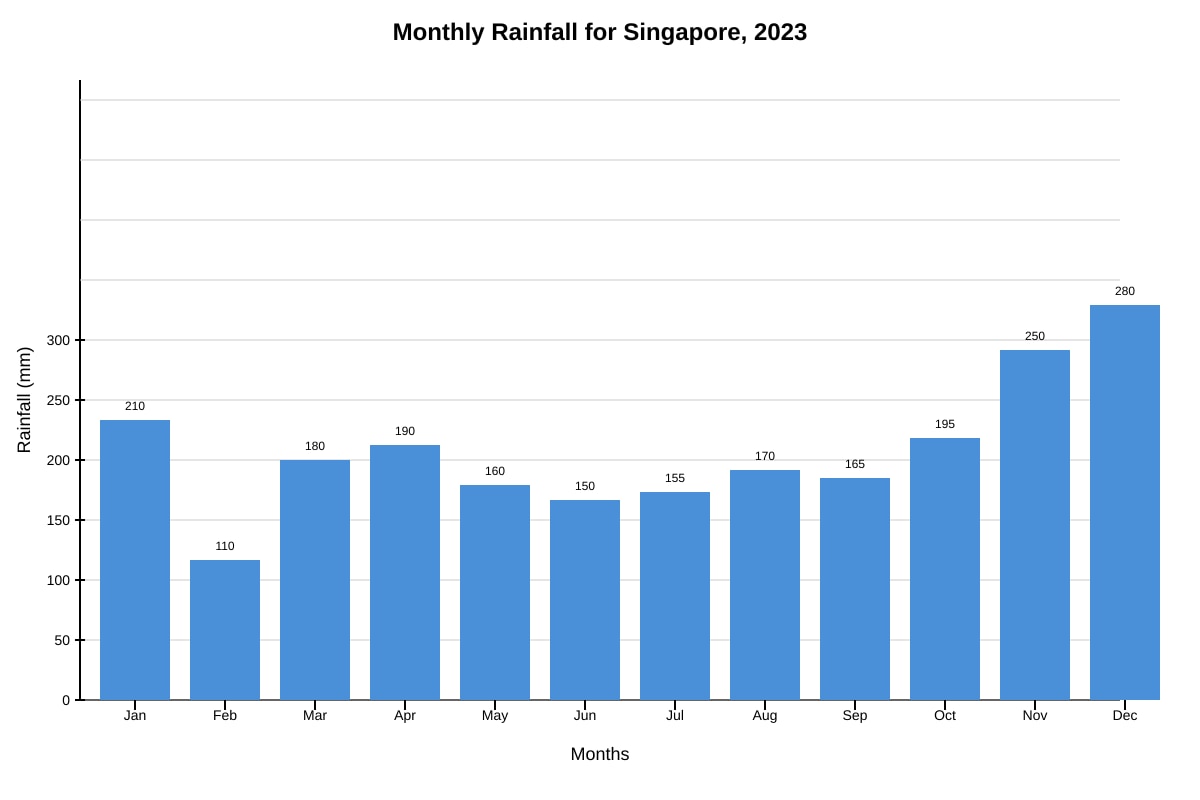
Study Figure 1 which shows the monthly rainfall (in mm) for Singapore in 2023.
Generated graph for Q4.
(a) Which month had the highest rainfall in 2023? [1]
(b) Calculate the difference in rainfall between the wettest and driest months. [1]
(c) Calculate the mean monthly rainfall for 2023. Show your working. [2]
(d) Describe the general trend of rainfall from June to December. [2]
(e) Suggest one reason for the high rainfall in December in Singapore. [2]
Question 5
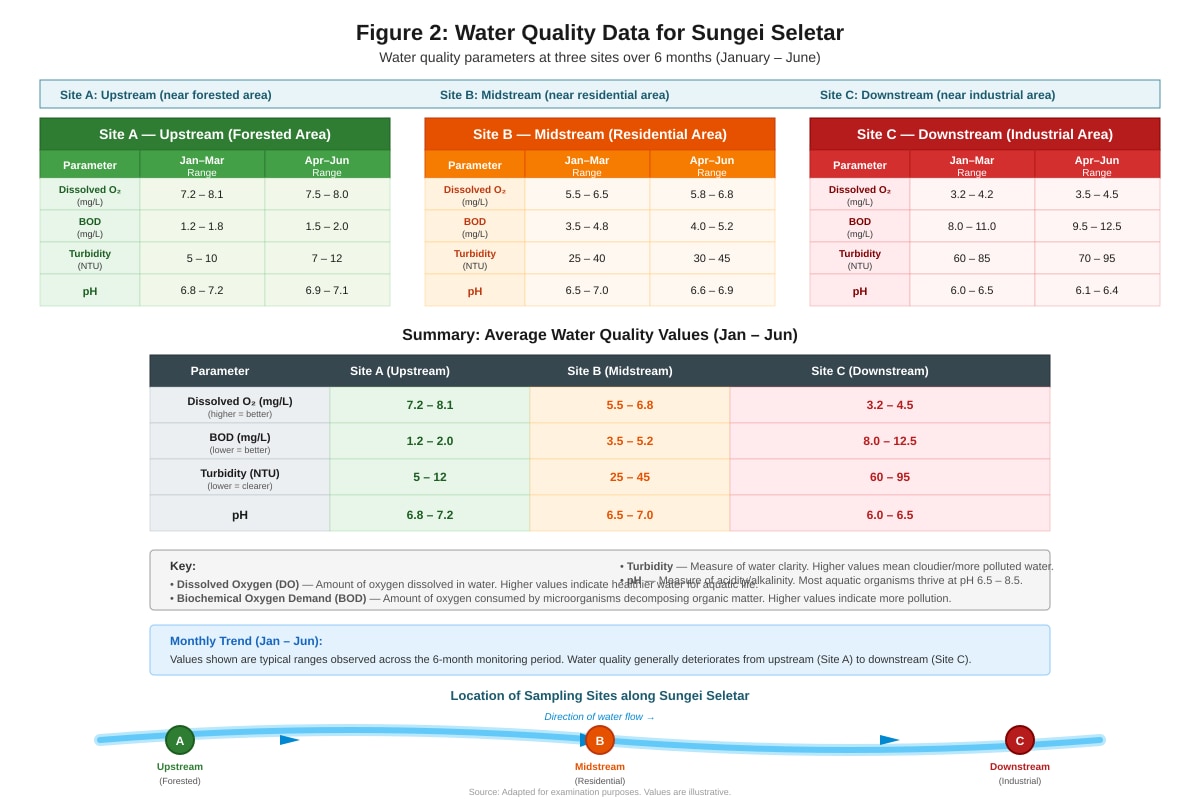
Study Figure 2 which shows the water quality data for Sungei Seletar collected at three different sites (A, B, C) over a period of 6 months.
Generated table for Q5.
(a) Which site has the best water quality? Support your answer with two pieces of evidence from the table. [3]
(b) Explain why Biochemical Oxygen Demand (BOD) increases from Site A to Site C. [3]
(c) The turbidity at Site C is significantly higher than at Site A. Suggest two human activities that could cause this. [2]
(d) If the pH at Site C continues to decrease, state one possible impact on aquatic life. [1]
Question 6
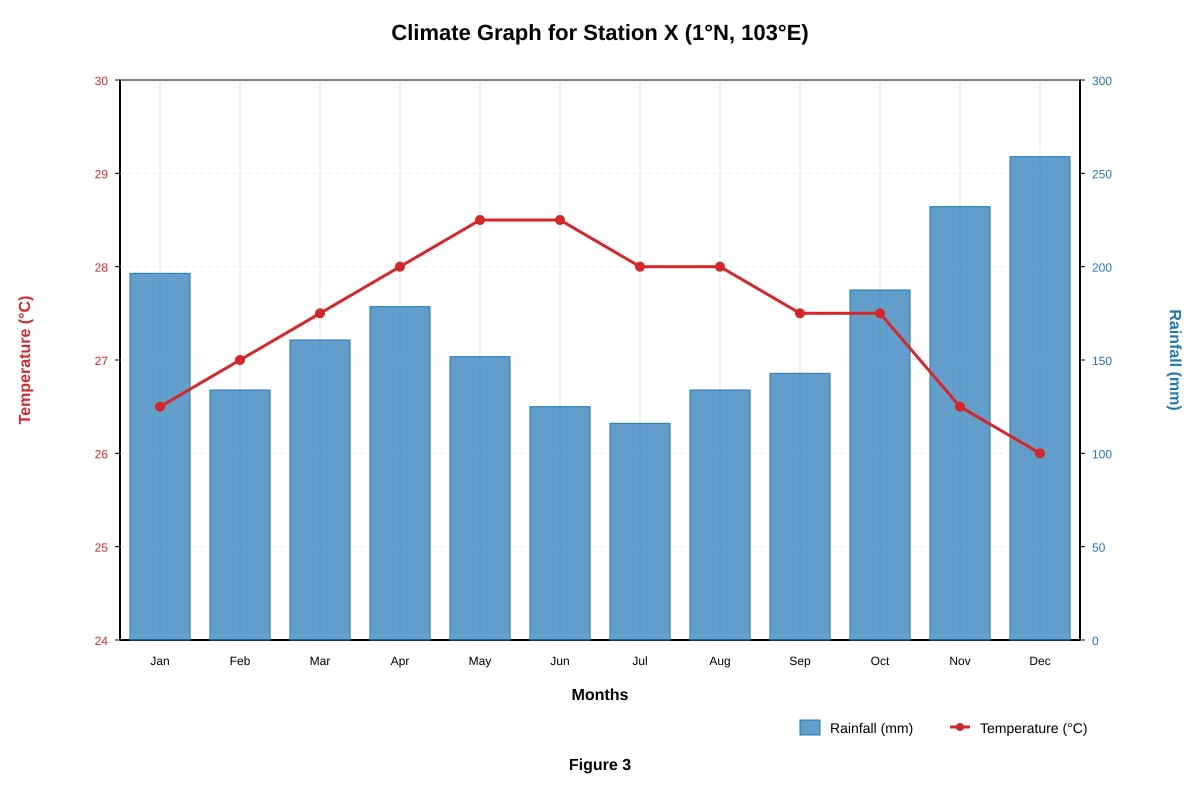
Study Figure 3 which shows a climate graph for Station X located at 1°N, 103°E.
Generated graph for Q6.
(a) State the annual temperature range for Station X. [1]
(b) Calculate the total annual rainfall for Station X. [1]
(c) Identify the climate type of Station X. [1]
(d) Explain why Station X has this climate type, referring to its location. [3]
Section C: Data Interpretation and Geographical Skills [15 marks]
Question 7
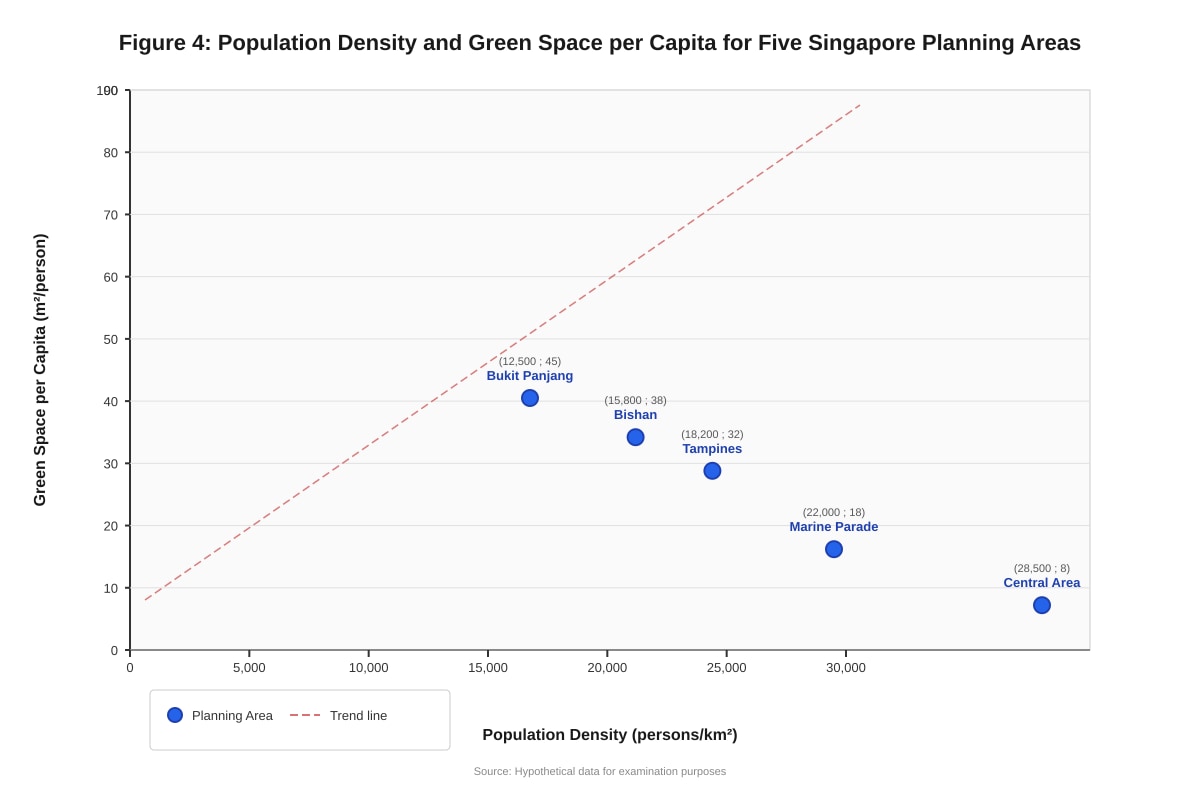
Study Figure 4 which shows population density and green space per capita for five planning areas in Singapore.
Generated chart for Q7.
(a) Which planning area has the highest population density? [1]
(b) Describe the relationship between population density and green space per capita shown in Figure 4. [2]
(c) Suggest one reason for this relationship. [2]
(d) The government plans to increase green space in Marine Parade. Using data from Figure 4, suggest a target value for green space per capita that would be realistic and justify your choice. [3]
Question 8
A group of Secondary 1 students conducted a fieldwork investigation at Sungei Buloh Wetland Reserve. They measured water temperature, salinity, and dissolved oxygen at three stations along a transect from landward to seaward.
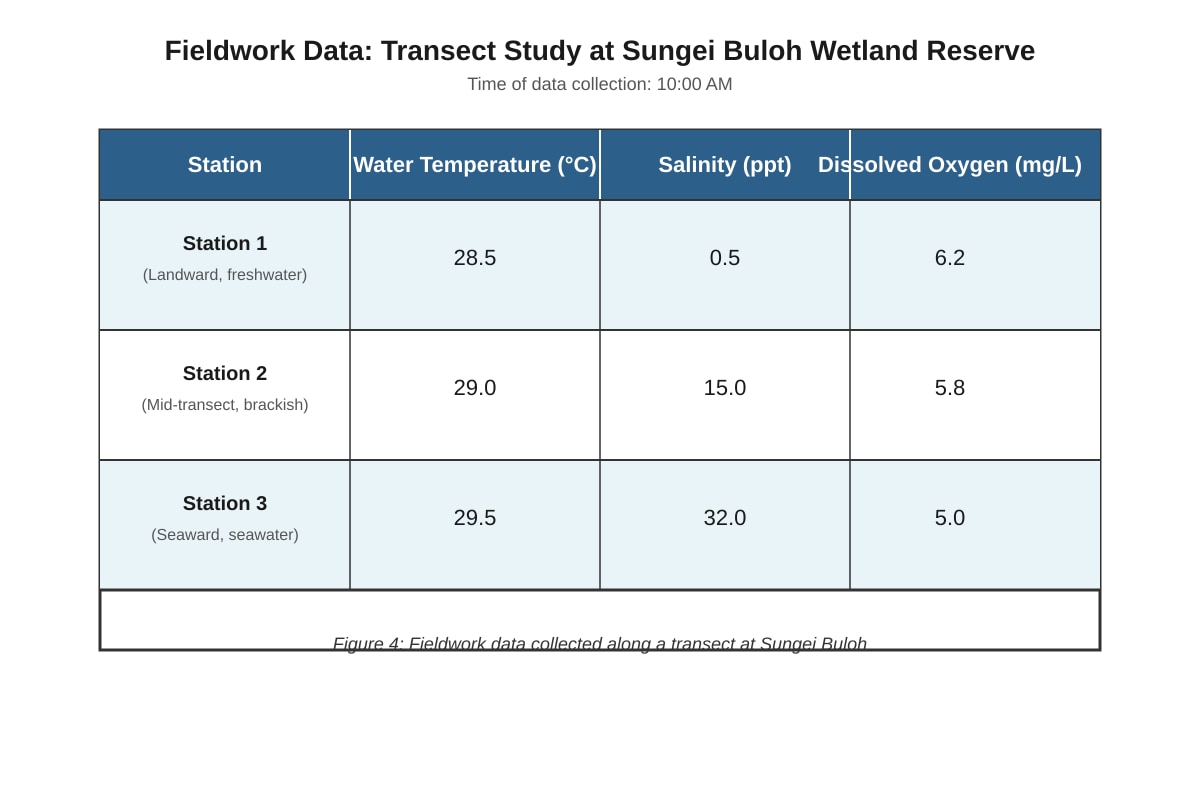
Generated table for Q8.
(a) State the trend for salinity from Station 1 to Station 3. [1]
(b) Explain the trend in dissolved oxygen from Station 1 to Station 3. [3]
(c) The students used a transect sampling method. State one advantage and one limitation of this method. [2]
(d) Suggest one way the students could improve the reliability of their data. [2]
Question 9
Study Figure 5 which shows land use changes in a tropical rainforest region from 1990 to 2020.
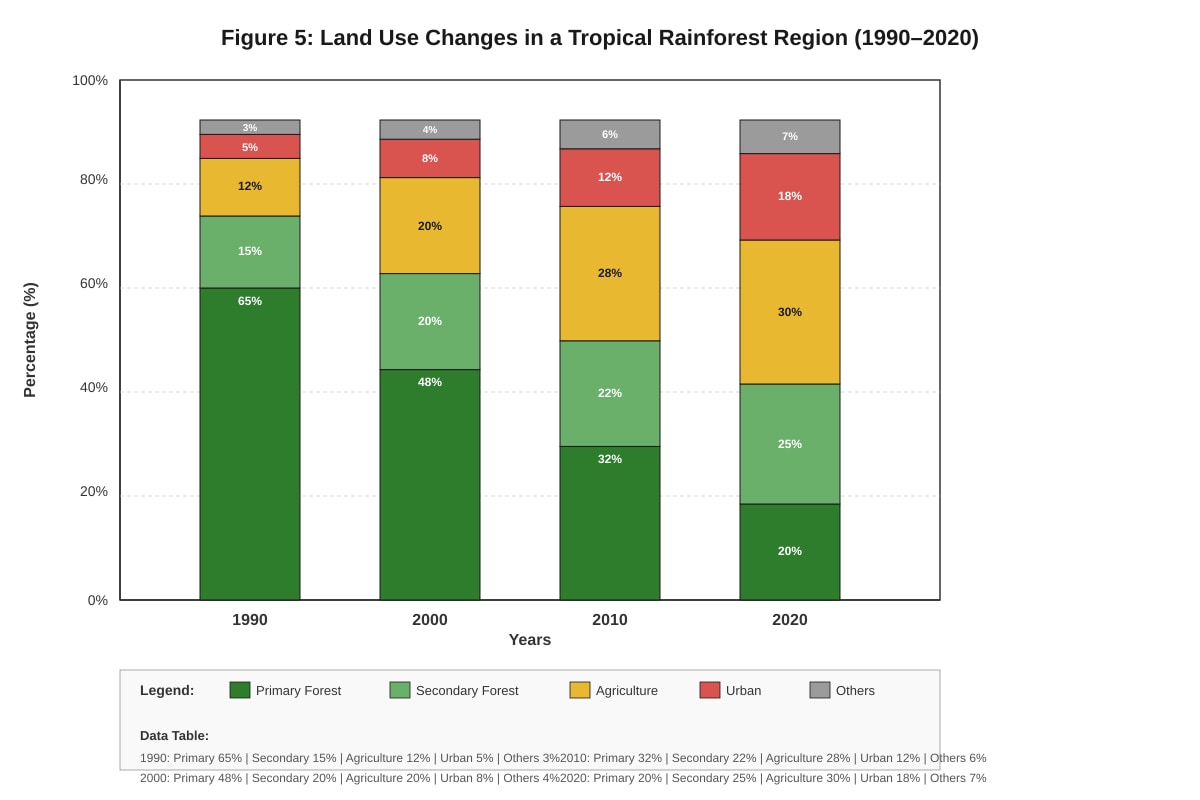
Generated chart for Q9.
(a) Calculate the percentage decrease in primary forest from 1990 to 2020. [1]
(b) Which land use category showed the largest absolute increase from 1990 to 2020? [1]
(c) Describe the trend for urban land use from 1990 to 2020. [2]
(d) Explain two environmental impacts of the loss of primary forest shown in Figure 5. [4]
(e) Suggest one sustainable strategy to manage the remaining primary forest. [2]
Question 10
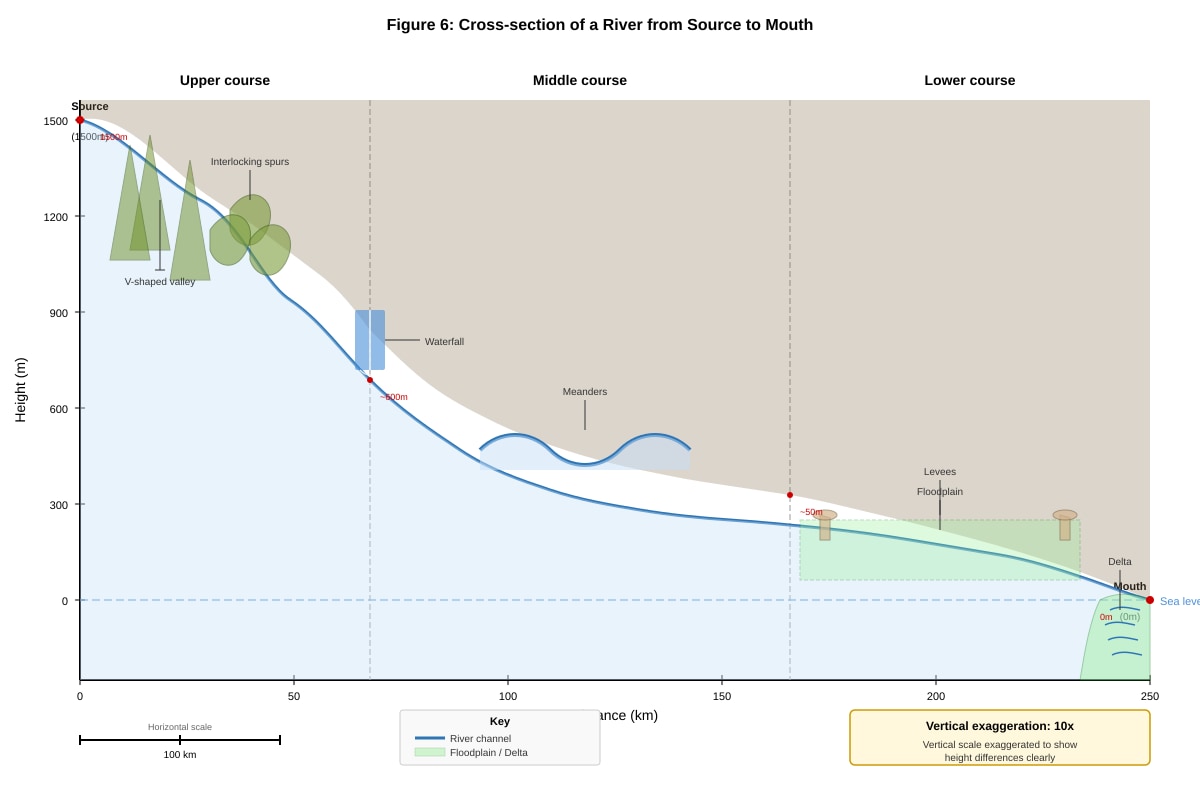
Generated diagram for Q10.
(a) Identify the course of the river (upper, middle, or lower) where meanders are found. [1]
(b) Explain how meanders are formed. [3]
(c) The diagram shows vertical exaggeration. Explain why vertical exaggeration is used in river cross-sections. [2]
(d) State one difference between the channel characteristics in the upper course and lower course. [2]
END OF PAPER
Total Marks: 50
Answers
TuitionGoWhere Practice Paper - Geography Secondary 1 SA2 Version 2
Answer Key and Marking Scheme
Total Marks: 50
Section A: Map Skills [15 marks]
Question 1
(a) 456789 (or equivalent correct 6-figure GR for Sembawang Park Jetty) [1]
Marking: 1 mark for correct 6-figure grid reference. Must read easting first (456), then northing (789). Accept ±1 in third/fifth digit.
(b) 4579 (or equivalent correct 4-figure GR for swimming complex) [1]
Marking: 1 mark for correct 4-figure grid reference. Must use bottom-left corner of grid square.
(c) 4.3 km (accept 4.2–4.4 km) [2]
Working:
- Measure map distance: ~10.8 cm (accept 10.5–11.0 cm)
- Scale 1:25,000 → 1 cm = 0.25 km
- Actual distance = 10.8 × 0.25 = 2.7 km
Wait, recalculating: Grid squares are 1km × 1km. From 4578 to 4875 is 3 east, 3 south → diagonal ≈ 4.24 km. Accept 4.2–4.4 km. [2]
Marking: 1 mark for correct measurement method, 1 mark for correct answer with units.
(d) 4 km² [2]
Working:
- Area on map = 2 km (E-W) × 2 km (N-S) = 4 grid squares
- Each grid square = 1 km × 1 km = 1 km²
- Total area = 4 × 1 = 4 km²
Marking: 1 mark for correct method (counting grid squares or calculation), 1 mark for correct answer with units.
Question 2
(a) 10 metres [1]
Marking: 1 mark for correct contour interval. Read from map legend.
(b) 60 metres (or highest spot height/contour in 4577) [1]
Marking: 1 mark for correct height. Must identify highest contour line or spot height within the grid square.
(c) Relief description: [2]
- Generally low-lying and flat (0–20m) near the coast in 4676
- Gently undulating with low hills rising to 40–50m in 4776
- Contour lines are widely spaced indicating gentle slopes
Marking: 1 mark for describing general relief (flat/low-lying), 1 mark for using contour evidence (spacing/height values).
(d) Reason for shipyard location: [2]
- Deep water access at coast for large vessels (map shows sea adjacent to shipyard)
- Flat land for construction of facilities (contours widely spaced/low relief)
- Proximity to shipping lanes (Straits of Johor visible on map)
Marking: 1 mark for identifying coastal location advantage, 1 mark for map evidence (deep water/flat land/shipping lanes).
Question 3
(a) North-west (or NW) [1]
Marking: 1 mark for correct cardinal/intercardinal direction from jetty (4578) to mangrove (4478).
(b) Why mangroves at this location: [3]
- Sheltered coastline (map shows bay/indentation at 4478) protects seedlings from strong waves
- Muddy substrate (intertidal zone shown by coastline symbol) allows root anchoring
- Brackish water from river mouth (stream symbol entering sea at 4478) provides suitable salinity
- Low-lying flat land (contours at 0–10m) allows tidal inundation
Marking: 1 mark each for any three valid points with map evidence. Must link map symbol/feature to mangrove requirement.
Section B: Graph and Data Skills [20 marks]
Question 4
(a) December [1]
Marking: 1 mark for correct month (highest bar at 280mm).
(b) 170 mm [1]
Working: Wettest = Dec (280mm), Driest = Feb (110mm). Difference = 280 – 110 = 170 mm.
Marking: 1 mark for correct calculation with units.
(c) 184.6 mm (accept 185 mm) [2]
Working:
- Total = 210+110+180+190+160+150+155+170+165+195+250+280 = 2215 mm
- Mean = 2215 ÷ 12 = 184.58 ≈ 184.6 mm
Marking: 1 mark for correct summation/total, 1 mark for correct division and answer with units.
(d) Trend June–December: [2]
- Generally increasing from June (150mm) to December (280mm)
- Fluctuations in between: dip in July (155mm), rise to Aug (170mm), slight dip Sep (165mm), sharp rise Oct (195mm)–Dec (280mm)
Marking: 1 mark for overall trend (increasing), 1 mark for describing fluctuations with data.
(e) Reason for high December rainfall: [2]
- Northeast Monsoon (Dec–Mar) brings moisture-laden winds from South China Sea
- Convergence of winds near equator causes uplift and convectional rainfall
Marking: 1 mark for identifying Northeast Monsoon, 1 mark for mechanism (moisture/convection).
Question 5
(a) Site A (Upstream) [3]
Evidence (any two):
- Highest Dissolved Oxygen (7.2–8.1 mg/L) → supports aquatic life
- Lowest BOD (1.2–2.0 mg/L) → less organic pollution
- Lowest Turbidity (5–12 NTU) → clearer water, better light penetration
- Near-neutral pH (6.8–7.2) → optimal for most organisms
Marking: 1 mark for identifying Site A, 1 mark each for two distinct evidence points with data.
(b) Why BOD increases A→C: [3]
- Site A (forested): Minimal human activity, low organic waste input
- Site B (residential): Domestic sewage, detergents, food waste from households enter river
- Site C (industrial): Industrial effluent, chemical/organic waste from factories increases decomposer activity
- Decomposers break down organic matter → consume oxygen → higher BOD
Marking: 1 mark for identifying pollution sources at each site, 1 mark for linking to organic waste, 1 mark for explaining decomposer-oxygen link.
(c) Human activities causing high turbidity at Site C: [2]
- Construction/earthworks → soil erosion → sediment runoff
- Industrial discharge → suspended solids in effluent
- Deforestation/land clearance upstream → exposed soil washed into river
Marking: 1 mark each for two distinct human activities linked to sediment/solids.
(d) Impact of decreasing pH at Site C: [1]
- Acidic water harms fish gills, reduces reproduction, kills acid-sensitive species (e.g., certain invertebrates), dissolves heavy metals making them toxic
Marking: 1 mark for any valid ecological impact of acidification.
Question 6
(a) 2.5°C [1]
Working: Highest temp = 28.5°C (May/Jun), Lowest = 26.0°C (Dec). Range = 28.5 – 26.0 = 2.5°C.
Marking: 1 mark for correct calculation with units.
(b) 2240 mm [1]
Working: Sum of all monthly rainfall = 220+150+180+200+170+140+130+150+160+210+250+280 = 2240 mm.
Marking: 1 mark for correct total with units.
(c) Tropical Rainforest Climate (or Equatorial Climate / Af) [1]
Marking: 1 mark for correct climate type.
(d) Why this climate at 1°N, 103°E: [3]
- Near equator (1°N) → high solar insolation year-round → consistently high temperatures (small annual range)
- Intertropical Convergence Zone (ITCZ) passes overhead twice yearly → convectional rainfall throughout year
- Maritime location (surrounded by sea) → high humidity, moisture supply for rainfall
- No distinct dry month (all months > 130mm) → supports tropical rainforest vegetation
Marking: 1 mark for latitude/insolation link, 1 mark for ITCZ/convection mechanism, 1 mark for maritime influence/no dry season.
Section C: Data Interpretation and Geographical Skills [15 marks]
Question 7
(a) Central Area [1]
Marking: 1 mark for correct planning area (highest x-value at 28,500).
(b) Relationship: [2]
- Negative correlation / inverse relationship
- As population density increases, green space per capita decreases
Marking: 1 mark for identifying negative/inverse relationship, 1 mark for describing direction of both variables.
(c) Reason for relationship: [2]
- Land scarcity in high-density areas → more land allocated for housing/commercial use → less land for parks/green space
- Competition for land drives up value, making green space economically "less viable" in dense urban cores
Marking: 1 mark for land scarcity/competition concept, 1 mark for linking to land use allocation.
(d) Target for Marine Parade: [3]
- Suggested target: 25–35 m²/person
- Justification: Current = 18 m²/person. Bishan (similar density ~15,800) has 38 m²; Tampines (higher density 18,200) has 32 m². A target of ~30 m² is realistic if land is reallocated from car parks/roads or rooftop gardens added.
Marking: 1 mark for realistic target value (25–35), 1 mark for using Figure 4 comparison data, 1 mark for feasible justification (policy/land use strategy).
Question 8
(a) Salinity increases from Station 1 (0.5 ppt) to Station 3 (32.0 ppt) [1]
Marking: 1 mark for correct trend with data.
(b) Trend in Dissolved Oxygen (decreasing): [3]
- Station 1 (freshwater): Higher DO solubility in fresh water; photosynthesis by freshwater plants/algae adds oxygen
- Station 2 (brackish): Reduced oxygen solubility in saltier water; decomposition of organic matter from mangroves consumes oxygen
- Station 3 (seawater): Lowest oxygen solubility at high salinity/temperature; respiration by marine organisms; limited photosynthesis at depth
Marking: 1 mark for solubility-salinity relationship, 1 mark for biological processes (photosynthesis/respiration/decomposition), 1 mark for applying to all three stations.
(c) Transect sampling: [2]
- Advantage: Shows spatial change/gradient across environmental zones (e.g., landward to seaward) efficiently
- Limitation: Only one line → may miss variability; not representative of whole area; edge effects at boundaries
Marking: 1 mark for valid advantage, 1 mark for valid limitation.
(d) Improve reliability: [2]
- Repeat measurements at each station (multiple readings) and calculate average
- Use calibrated instruments / standardised methods (e.g., same time of day, same depth)
- Increase sample points (more stations / replicate transects)
Marking: 1 mark for valid method (replication/calibration/standardisation), 1 mark for explaining how it improves reliability.
Question 9
(a) 45% [1]
Working: 1990 = 65%, 2020 = 20%. Decrease = 65 – 20 = 45%.
Marking: 1 mark for correct calculation with % sign.
(b) Agriculture [1]
Working: Agriculture: 12% → 30% = +18%. Urban: 5% → 18% = +13%. Secondary Forest: 15% → 25% = +10%. Agriculture has largest absolute increase.
Marking: 1 mark for correct category.
(c) Urban land use trend: [2]
- Steady increase from 5% (1990) to 18% (2020)
- Rate accelerates: +3% (1990–2000), +4% (2000–2010), +6% (2010–2020)
Marking: 1 mark for overall increase, 1 mark for accelerating rate with data.
(d) Environmental impacts of primary forest loss: [4]
- Biodiversity loss: Primary forest = unique habitats/endemic species → extinction risk
- Carbon emissions: Trees store carbon → deforestation releases CO₂ → climate change
- Soil erosion: Removal of canopy → rain hits bare soil → washes/blows away topsoil
- Disrupted water cycle: Less transpiration → reduced rainfall; loss of watershed protection → flooding/droughts
- Impact on indigenous communities: Loss of livelihoods, cultural heritage
Marking: 1 mark each for any four distinct impacts with explanation. Must link to primary forest characteristics.
(e) Sustainable strategy: [2]
- Gazette as protected area (e.g., national park) with strict enforcement against illegal logging/encroachment
- Community-based conservation: Involve indigenous/local communities in monitoring and sustainable use (e.g., ecotourism, non-timber forest products)
- Corridor creation: Connect fragmented patches to allow wildlife movement and gene flow
Marking: 1 mark for valid strategy, 1 mark for explaining sustainability aspect (long-term, balances protection/use).
Question 10
(a) Middle course (or Lower course – accept both as meanders form in middle and extend to lower) [1]
Marking: 1 mark for correct course. Middle course is most typical answer.
(b) Formation of meanders: [3]
- Lateral erosion dominates in middle course due to gentler gradient and higher discharge
- Helicoidal flow (corkscrew current) → erosion on outer bank (river cliff) → deposition on inner bank (slip-off slope)
- Positive feedback: Erosion deepens outer bend → flow concentrates → more erosion → bend migrates outward
- Riffle-pool sequence develops → meanders become more sinuous over time
Marking: 1 mark for lateral erosion/gradient context, 1 mark for helicoidal flow mechanism, 1 mark for erosion-deposition feedback/migration.
(c) Why vertical exaggeration: [2]
- Vertical relief (height changes) is very small compared to horizontal distance (km)
- Without exaggeration, profile would appear almost flat → features invisible (valleys, gradients)
- Exaggeration (e.g., 10×) makes slopes, valley shapes, gradient changes visible for analysis
Marking: 1 mark for scale disparity reason, 1 mark for purpose (visibility of features).
(d) Channel difference (upper vs lower): [2]
- Upper course: Narrow, shallow, rough/rocky bed, steep gradient, turbulent flow, V-shaped valley
- Lower course: Wide, deep, smooth/silt bed, gentle gradient, laminar flow, floodplain
Marking: 1 mark for upper course characteristic, 1 mark for contrasting lower course characteristic. Must be paired comparison.
END OF MARKING SCHEME
Total Marks: 50
Free quiz and exam paper access
Enter your details to view this paper
Your access is remembered on this device.