From Real Exams Exam Paper
Secondary 1 Geography Semestral Assessment 2 (End of Year) Paper 2
Free Sec 1 Geography SA2 Paper 2, Kimi2.6 Exam version, with questions, answers, and syllabus-aligned practice for Singapore students.
These static practice materials are generated from the site's syllabus and paper-generation workflow, with source and model context shown so students and parents can evaluate the material before use.
Questions
TuitionGoWhere Exam Practice (AI) - Secondary 1 Geography
Subject: Geography
Level: Secondary 1
Paper: SA2 Practice Paper
Version: 2 of 5
Duration: 1 hour 15 minutes
Total Marks: 60
Name: _________________________
Class: _________________________
Date: _________________________
INSTRUCTIONS
- Write your name, class, and date in the spaces provided.
- This paper consists of THREE sections: A, B, and C.
- Answer ALL questions.
- Write your answers in the spaces provided. If space is insufficient, you may use additional paper.
- For questions involving calculations, show all your working clearly.
SECTION A: Multiple Choice Questions [10 marks]
Answer ALL questions. Each question carries 1 mark.
Time allocation: 10 minutes
1. Which of the following is the correct 4-figure grid reference for a feature located at easting 34 and northing 67?
| A | 6734 |
| B | 3467 |
| C | 340067 |
| D | 670034 |
Answer: _________________________
2. On a 1:50 000 scale map, a straight road measures 8 cm. What is the actual ground distance?
| A | 0.4 km |
| B | 4 km |
| C | 40 km |
| D | 400 km |
Answer: _________________________
3. The contour interval on a topographical map is 20 metres. Two adjacent contour lines are labelled 240 m and 260 m. What is the contour interval being used?
| A | 10 m |
| B | 20 m |
| C | 240 m |
| D | 500 m |
Answer: _________________________
4. Which type of graph would be most appropriate to show changes in average monthly rainfall over a 12-month period?
| A | Pie chart |
| B | Bar graph |
| C | Line graph |
| D | Scatter graph |
Answer: _________________________
5. A six-figure grid reference provides greater accuracy than a four-figure grid reference by dividing the grid square into how many smaller squares?
| A | 10 |
| B | 100 |
| C | 1000 |
| D | 10 000 |
Answer: _________________________
6. Which statement about map scales is correct?
| A | A large-scale map shows a larger area with less detail |
| B | A small-scale map shows a smaller area with more detail |
| C | A large-scale map shows a smaller area with more detail |
| D | Scale has no effect on the level of detail shown |
Answer: _________________________
7. On a climate graph, which visual element typically represents temperature?
| A | Bars |
| B | A line |
| C | Pie slices |
| D | Scatter points |
Answer: _________________________
8. What does a steep gradient on a topographical map indicate?
| A | Contour lines far apart |
| B | Contour lines close together |
| C | Flat land |
| D | A river valley |
Answer: _________________________
9. A bar graph shows population data for five ASEAN countries. Which of the following must be included for the graph to be complete?
| A | A legend showing colours for each country |
| B | A title, labelled axes, and a scale |
| C | A north arrow |
| D | Grid references |
Answer: _________________________
10. When measuring bearing on a map, which direction is always taken as 0°?
| A | South |
| B | East |
| C | West |
| D | North |
Answer: _________________________
SECTION B: Structured Data Response [30 marks]
Answer ALL questions. Write your answers in the spaces provided.
Time allocation: 35 minutes
11. Study the extract of the topographical map below.
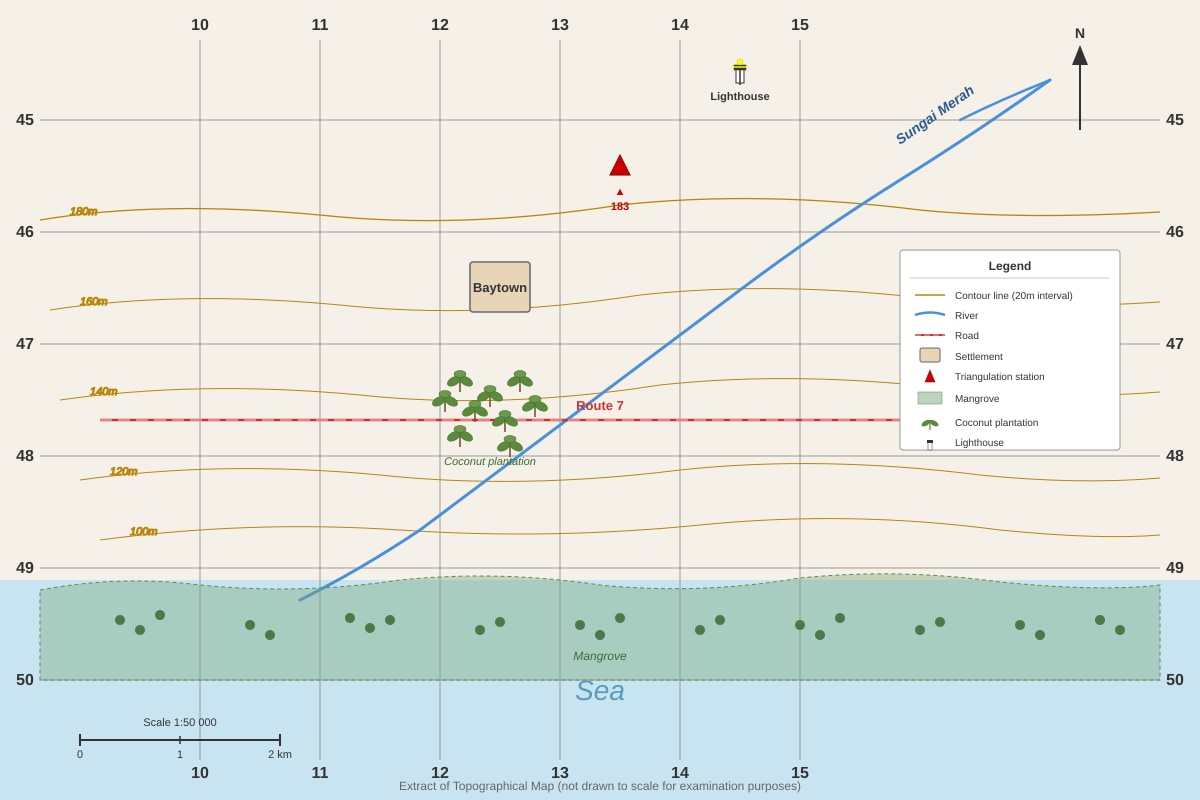
Generated map for Q11.
(a) State the 4-figure grid reference of Baytown. [1]
(b) Calculate the actual distance in kilometres between Baytown (grid 1247) and the triangulation station at 1346. The measured map distance is 3.5 cm. Show your working. [2]
(c) Describe the relief (shape of the land) in the area shown by the contour lines between eastings 13 and 15, northings 45 to 48. [2]
(d) Identify the land use found at grid square 1445. Suggest one reason why this land use is located at this particular site. [2]
12. The table below shows rainfall and temperature data for Station X, a location near the equator.
| Month | Rainfall (mm) | Temperature (°C) |
|---|---|---|
| January | 320 | 27 |
| February | 280 | 27 |
| March | 245 | 28 |
| April | 180 | 29 |
| May | 150 | 29 |
| June | 120 | 29 |
| July | 95 | 28 |
| August | 110 | 28 |
| September | 140 | 28 |
| October | 195 | 28 |
| November | 260 | 27 |
| December | 305 | 27 |
(a) Calculate the total annual rainfall for Station X. Show your working. [2]
(b) Identify the wettest month and the driest month at Station X. [1]
(c) Describe the pattern of temperature throughout the year at Station X. [2]
(d) Using the data, explain why a climate graph (combo graph) is more suitable than a bar graph alone for showing this climate data. [2]
13. Study the pie chart below showing land use in Singapore in 2023.
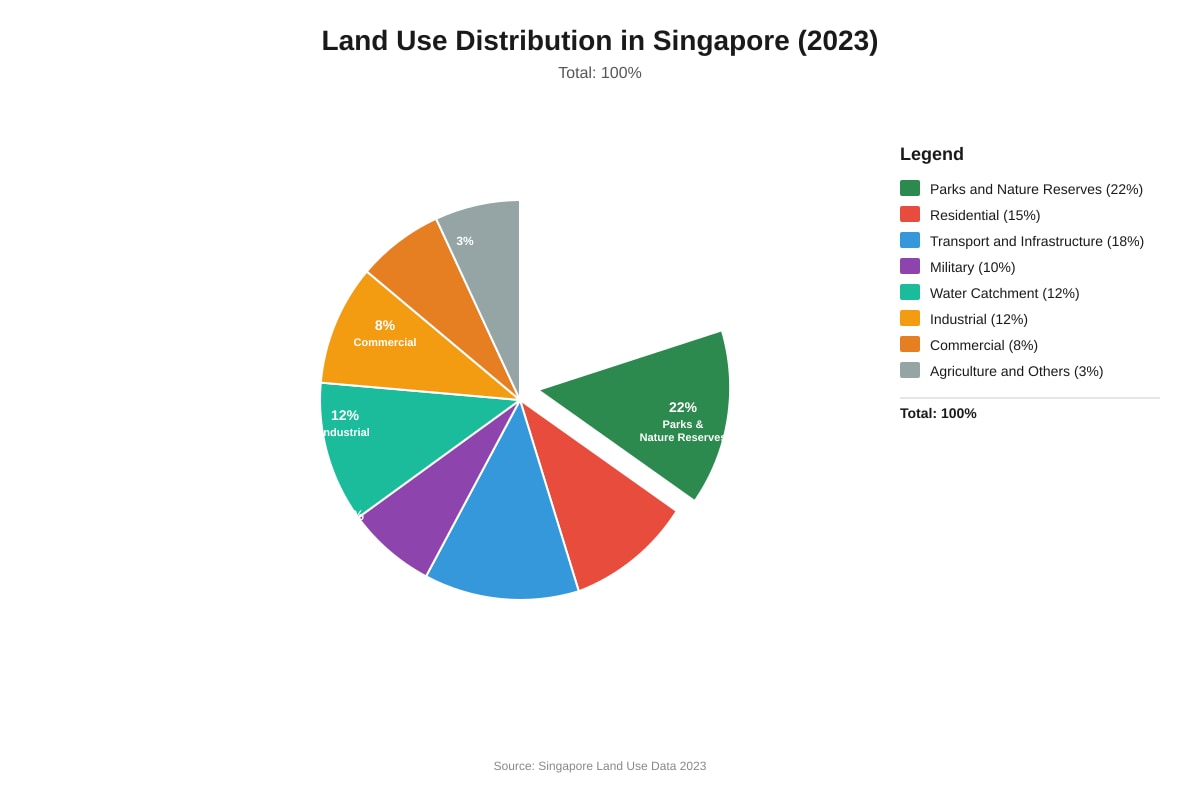
Generated chart for Q13.
(a) Which land use occupies the largest proportion of Singapore's land area? [1]
(b) Calculate the combined percentage of land used for residential, commercial, and industrial purposes. [1]
(c) Suggest two reasons why parks and nature reserves occupy a large proportion of Singapore's land. [2]
(d) A student claims that "Singapore has very little land for agriculture." Use evidence from the pie chart to evaluate this statement. [2]
14. Study the line graph showing Singapore's population growth from 1970 to 2020.
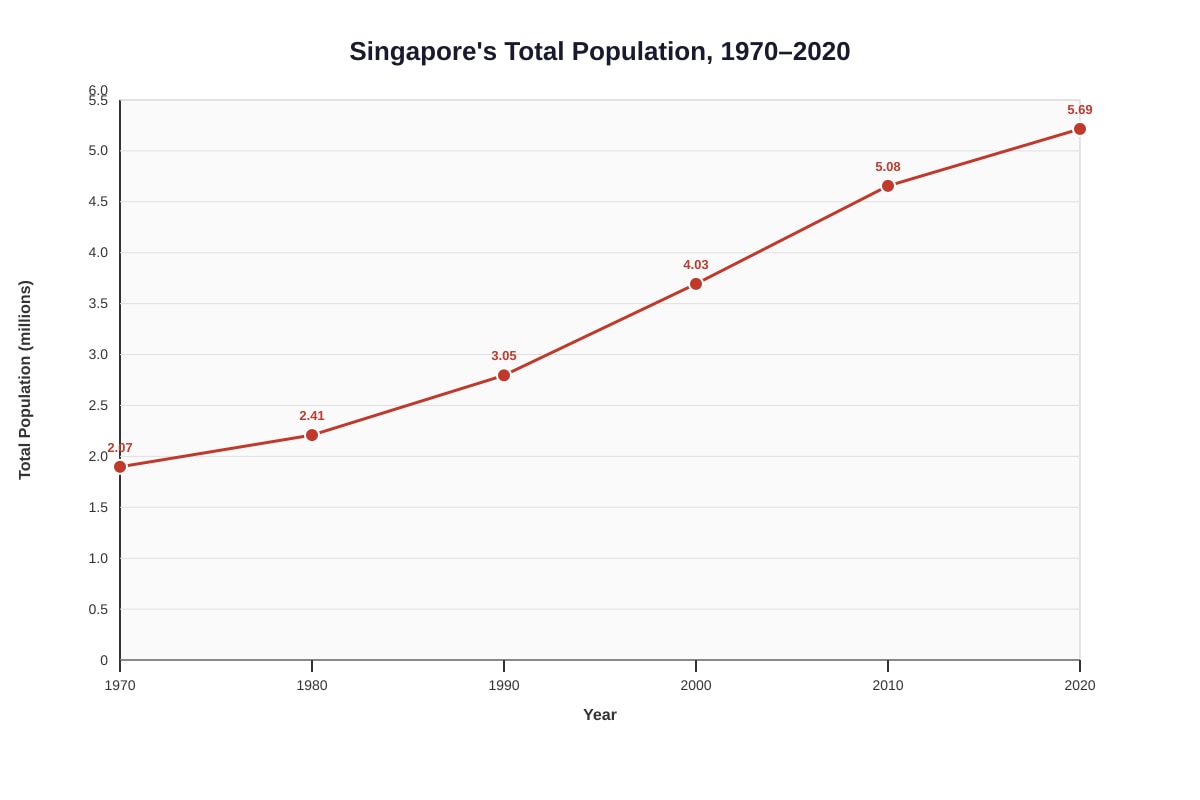
Generated graph for Q14.
(a) State the total population of Singapore in 1990. [1]
(b) Calculate the population increase between 2000 and 2010. Show your working. [1]
(c) Describe the overall trend shown by the graph. Use data to support your answer. [2]
(d) Suggest one reason why the rate of population growth slowed between 2010 and 2020 compared to earlier decades. [1]
15. Study the photograph below showing a coastal landscape.
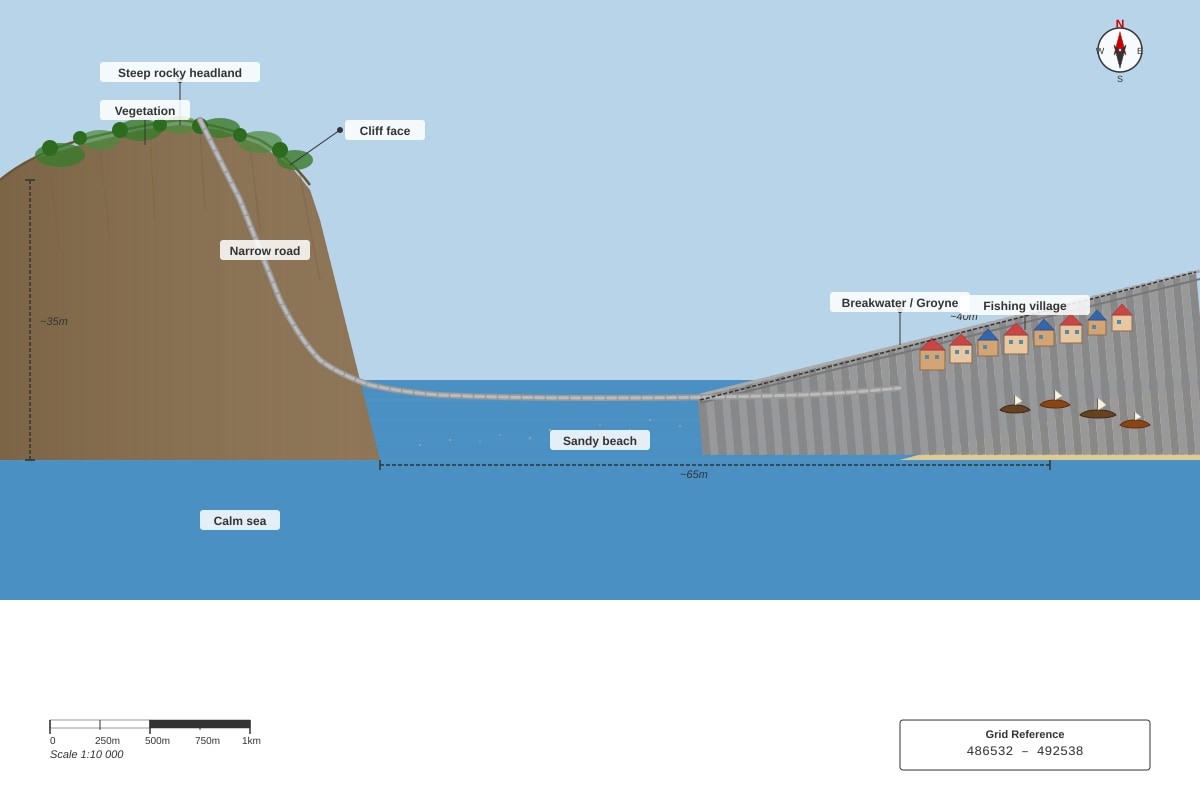
Generated source_image for Q15.
(a) Identify two physical features visible in the photograph. [2]
(b) Identify two human features visible in the photograph. [2]
(c) Suggest one reason why a groyne structure has been built at this location. [1]
SECTION C: Extended Data Skills and Evaluation [20 marks]
Answer ALL questions. Write your answers in the spaces provided.
Time allocation: 25 minutes
16. The scatter graph below shows the relationship between average annual temperature and annual rainfall for 12 cities around the world.
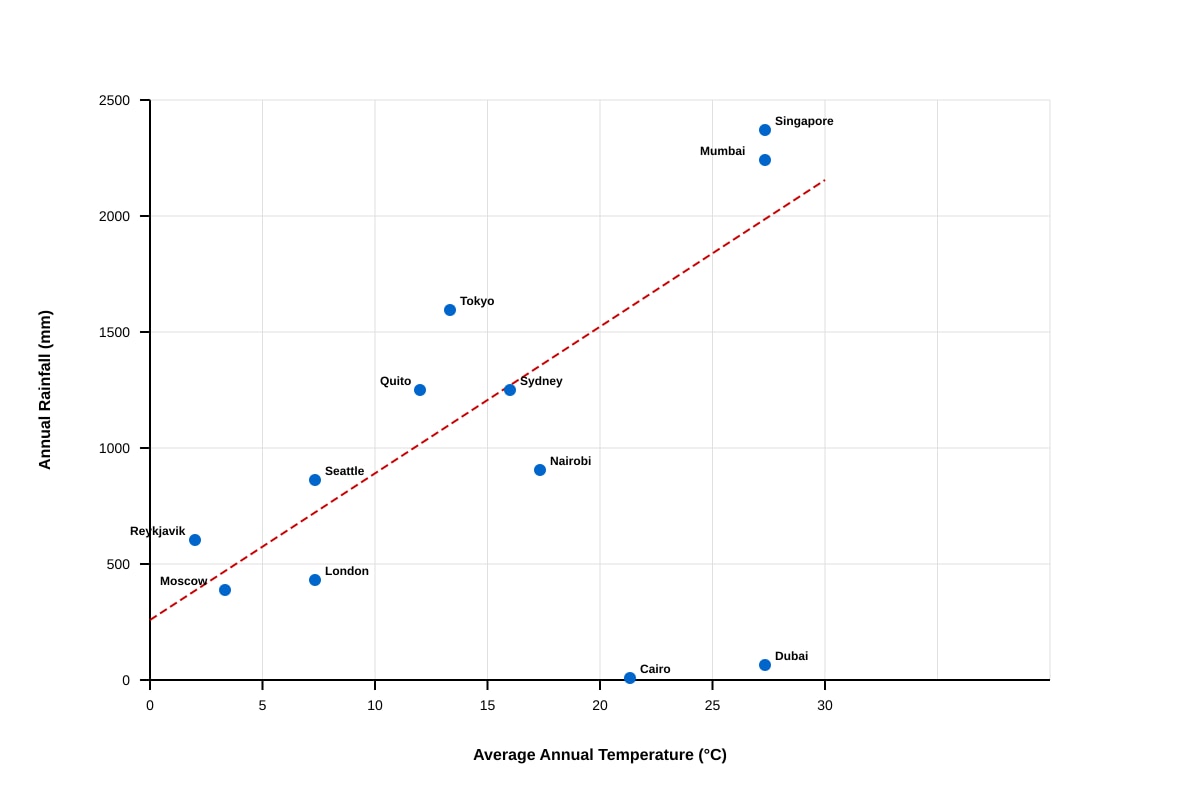
Generated graph for Q16.
(a) Identify the city with the highest annual rainfall. [1]
(b) Compare the climate of Dubai and Singapore using evidence from the scatter graph. [3]
(c) What type of correlation, if any, is shown between temperature and rainfall in this data set? Explain your answer using evidence from the graph. [3]
(d) Suggest one limitation of using a single temperature and rainfall figure to describe a city's climate. [1]
17. Study the extract of the 1:25 000 topographical map below showing a rural-urban fringe area.
Image pending generation: map for Q17.
(a) State the six-figure grid reference of the school marked 'SCH'. [1]
(b) Describe the location of Tampville in relation to the reservoir. Use compass direction and distance. [2]
(c) Explain why the industrial estate was likely sited to the east of Tampville rather than to the west. [2]
(d) The area between eastings 36-38 and northings 56-57 has been identified as unsuitable for housing development. Explain two reasons why this area is unsuitable, using evidence from the map. [3]
(e) A developer plans to build a new housing estate. Using map evidence, suggest two factors the developer should consider when choosing between Site A (grid square 3554) and Site B (grid square 3656). [4]
18. The table below shows data about water consumption in Singapore for selected years.
| Year | Total Water Consumption (million m³) | Per Capita Water Consumption (litres/day) | Population (millions) |
|---|---|---|---|
| 2000 | 280 | 165 | 4.03 |
| 2005 | 310 | 160 | 4.35 |
| 2010 | 340 | 155 | 5.08 |
| 2015 | 380 | 150 | 5.54 |
| 2020 | 420 | 140 | 5.69 |
(a) Describe two trends shown in the table about water consumption in Singapore. [2]
(b) Calculate the percentage decrease in per capita water consumption between 2000 and 2020. Give your answer to one decimal place. Show your working. [2]
(c) Suggest two reasons why per capita water consumption has decreased while total water consumption has increased. [2]
(d) Singapore's water agency aims to reduce per capita water consumption to 130 litres/day by 2030. Evaluate whether the trends shown in the data suggest this target is achievable. [3]
End of Paper
Total: 60 marks
Answers
TuitionGoWhere Exam Practice (AI) - Secondary 1 Geography
Answer Key and Marking Scheme
Paper: SA2 Practice Paper Version 2 of 5
Total Marks: 60
SECTION A: Multiple Choice Questions [10 marks]
| Question | Answer | Explanation |
|---|---|---|
| 1 | B | 3467. In a 4-figure grid reference, the easting (horizontal line number) always comes first, followed by the northing (vertical line number). Students commonly reverse this order. The easting is 34, the northing is 67, so the correct reference is 3467. |
| 2 | B | 4 km. At 1:50 000 scale, 1 cm on map = 50 000 cm on ground = 0.5 km. Therefore 8 cm × 0.5 km = 4 km. Working: 8 × 50 000 = 400 000 cm = 4 000 m = 4 km. |
| 3 | B | 20 m. The contour interval is the vertical distance between adjacent contour lines. 260 m − 240 m = 20 m. This is a straightforward subtraction test of understanding contour interval definition. |
| 4 | C | Line graph. Line graphs best show changes over continuous time periods. Rainfall over 12 months is continuous data where trends and patterns across time need to be visible. Bar graphs could show each month's rainfall but make trend patterns harder to see. |
| 5 | B | 100. A six-figure grid reference divides each grid square into 100 smaller squares (10 × 10). The third figure estimates tenths of the easting, and the sixth figure estimates tenths of the northing, giving precision to 100 metres on a 1:50 000 map. |
| 6 | C | A large-scale map shows a smaller area with more detail. Large scale = larger representative fraction (e.g., 1:10 000 covers small area, shows buildings). Small scale = smaller fraction (e.g., 1:1 000 000 covers countries, less detail). This is a fundamental map concept often confused by students. |
| 7 | B | A line. Climate graphs (climographs) conventionally use a line graph for temperature and bars for rainfall, allowing two different scales and units on the same graph. The line makes temperature trends clearly visible. |
| 8 | B | Contour lines close together. Close contour lines indicate rapid change in elevation over short horizontal distance = steep slope. Wide spacing = gentle slope. Parallel close lines may indicate a cliff. |
| 9 | B | A title, labelled axes, and a scale. These are essential elements of any graph. A legend is only needed if multiple data series use colours/patterns. North arrows and grid references are map elements, not graph requirements. |
| 10 | D | North. Bearings are always measured clockwise from grid north (000°). This is standard cartographic convention. Bearings range 000° to 360°. |
SECTION B: Structured Data Response [30 marks]
Question 11 [7 marks]
(a) State the 4-figure grid reference of Baytown. [1]
Answer: 1247 (or 1247 ± acceptable if clearly 12×× and 47××)
Marking: 1 mark for correct answer. Note: easting 12, northing 47. Common error: reversing to 4712.
(b) Calculate the actual distance in kilometres. [2]
Answer: 1.75 km (accept 1.7–1.8 km if measurement variation acknowledged)
Working:
- Scale: 1:50 000 means 1 cm = 50 000 cm = 0.5 km
- Map distance = 3.5 cm
- Ground distance = 3.5 × 0.5 = 1.75 km [1 mark for method/scale conversion]
- Or: 3.5 × 50 000 = 175 000 cm = 1 750 m = 1.75 km [1 mark for accurate final answer]
Marking notes: Award 1 mark for correct method (multiplying by scale or converting to km); 1 mark for accurate final answer. Accept working in cm → m → km or direct conversion.
(c) Describe the relief in the area eastings 13–15, northings 45–48. [2]
Answer: The land rises from south/southeast to north/northwest [1] — the contour lines show increasing values from 120 m towards 180 m+ near the triangulation station. The area is hilly to moderately steep [1] as contour lines are relatively close together, especially in the northeast corner of this region.
Marking: 1 mark for correct identification of slope direction/gradient increase; 1 mark for description of steepness or relief character using contour evidence. Accept "hilly," "rising ground," "moderate to steep slope." Must reference contour line spacing or values.
(d) Land use at 1445 and reason. [2]
Answer: Lighthouse [1] or coastal defense/navigation structure.
Reason: Located at the coast/eastern edge of land for maximum visibility to ships [1]; or: positioned at point where boats need guidance entering/leaving coastal waters.
Marking: 1 mark correct identification from map symbols; 1 mark for plausible functional reason linked to coastal location.
Question 12 [7 marks]
(a) Calculate total annual rainfall. [2]
Working: 320 + 280 + 245 + 180 + 150 + 120 + 95 + 110 + 140 + 195 + 260 + 305
Step by step:
- 320 + 280 = 600
- 600 + 245 = 845
- 845 + 180 = 1025
- 1025 + 150 = 1175
- 1175 + 120 = 1295
- 1295 + 95 = 1390
- 1390 + 110 = 1500
- 1500 + 140 = 1640
- 1640 + 195 = 1835
- 1835 + 260 = 2095
- 2095 + 305 = 2400 mm [2 marks]
Marking: 1 mark for correct addition method shown; 1 mark for correct final answer. Deduct 1 if no working shown. Accept minor arithmetic slip with working (1 mark maximum).
(b) Wettest and driest month. [1]
Answer: Wettest: January (320 mm); Driest: July (95 mm)
Note: Both required for 1 mark. Accept "Jan" and "Jul."
(c) Describe temperature pattern. [2]
Answer: Temperatures are high and relatively stable throughout the year [1], ranging only from 27°C to 29°C [1]. There is a very small annual temperature range (only 2°C), with a slight peak in April–June.
Marking: 1 mark for general description (high/stable/little variation/hot year-round); 1 mark for specific data reference or range. "Hot" alone insufficient without data.
(d) Why climate graph more suitable than bar graph alone. [2]
Answer: A climate graph uses bars for rainfall and a line for temperature [1], allowing two different variables with different units (mm and °C) to be shown together with separate scales [1]. A bar graph alone could only show one variable effectively, or would require confusing dual-axis interpretation without clear visual distinction.
Marking: 1 mark for identifying the dual representation; 1 mark for explaining the advantage (different units/scales, clear comparison, visual distinction). Accept reference to ease of seeing relationships between rainfall and temperature patterns.
Question 13 [6 marks]
(a) Largest land use proportion. [1]
Answer: Parks and Nature Reserves (22%)
(b) Combined percentage. [1]
Working: 15% + 8% + 12% = 35%
Answer: 35%
(c) Two reasons for large parks/nature reserves proportion. [2]
Suggested answers (any two):
- Singapore's "City in a Garden" policy promotes greenery and biodiversity conservation [1]
- Limited land means concentrated high-density development, leaving remaining green spaces protected [1]
- Nature reserves protect water catchments and maintain ecological balance [1]
- High population density creates need for recreational green spaces [1]
(d) Evaluate statement about agriculture. [2]
Answer: The statement is supported by evidence [1]: Agriculture and Others occupies only 3% of land, the smallest category by far [1]. This is insufficient for significant food production, making Singapore heavily dependent on food imports. However, "Others" is combined with agriculture, so the pure agricultural figure may be even smaller [additional evaluative point, not required for full marks].
Marking: 1 mark for correct evaluation/claim supported; 1 mark for specific data use (3% or comparison with other sectors).
Question 14 [5 marks]
(a) Population in 1990. [1]
Answer: 3.05 million (accept 3 million if approximate, but 3.05 million preferred)
(b) Population increase 2000–2010. [1]
Working: 5.08 − 4.03 = 1.05 million
Answer: 1.05 million
(c) Overall trend with data support. [2]
Answer: The population shows a steady increase throughout the period [1]. It rose from 2.07 million in 1970 to 5.69 million in 2020, more than doubling over 50 years [1 for data]. The increase was particularly rapid between 1990 and 2010 [additional detail, not required].
Marking: 1 mark for trend description; 1 mark for at least two supporting data points or clear magnitude description.
(d) Reason for slowed growth 2010–2020. [1]
Suggested answers:
- Decreasing birth rates/fertility rate fell below replacement level
- Stricter immigration policies introduced
- Government policies to slow population growth
- Ageing population with fewer young people entering reproductive years
Question 15 [5 marks]
(a) Two physical features. [2]
Answers (any two): Cliff/steep rocky headland; sandy beach; sea/ocean; coastal vegetation on cliff top.
(b) Two human features. [2]
Answers (any two): Fishing village/settlement; boats/vessels; breakwater/groyne; road; lighthouse (if visible).
(c) Reason for groyne. [1]
Answer: To prevent beach erosion by reducing longshore drift [1]; or: to trap sediment and maintain beach width for protection/recreation; or: to protect the village from storm waves.
SECTION C: Extended Data Skills and Evaluation [20 marks]
Question 16 [8 marks]
(a) City with highest rainfall. [1]
Answer: Singapore (2350 mm) — accept if identified by approximate position highest on y-axis.
(b) Compare Dubai and Singapore. [3]
Marking scheme:
- Similarity: Both have high average annual temperatures (~27°C) [1]
- Difference 1: Singapore has much higher rainfall (2350 mm vs ~95 mm); or Dubai has extremely low rainfall [1]
- Difference 2: Singapore is hot and wet/humid; Dubai is hot and dry/arid [1] — this contrast in climate type must be explicit
Sample answer: Both cities experience high temperatures of about 27°C [1]. However, Singapore receives very high annual rainfall of 2350 mm, while Dubai receives almost no rainfall at only about 95 mm per year [1]. This means Singapore has a tropical wet climate, whereas Dubai has a hot desert climate [1].
(c) Type of correlation. [3]
Answer: Weak positive correlation [1]. Generally, as temperature increases, rainfall tends to increase slightly [1], but there are many exceptions — for example, Dubai and Singapore have similar temperatures but vastly different rainfall, and London is cool but wetter than many hotter cities [1]. The best-fit line slopes gently upward but data points are widely scattered.
Marking: 1 mark correct correlation type; 1 mark for general explanation; 1 mark for specific contradictory evidence from the data.
(d) Limitation of single temperature and rainfall figure. [1]
Answers:
- Hides seasonal variations (e.g., monsoon vs dry seasons in Mumbai)
- Averages may not reflect extreme weather events
- Daily temperature ranges not shown (hot days, cool nights in deserts)
- Doesn't show reliability/consistency of rainfall (some places have irregular downpours)
Question 17 [12 marks]
(a) Six-figure grid reference of SCH. [1]
Answer: 335550 or 335554 (depending on precise central positioning within grid square 3355). Accept 3355 with reasonable third/sixth figure, or 334554–336556 range. Standard answer: 335554 (centre of standard school symbol placement).
Teaching note: The third figure estimates tenths across the easting, sixth figure tenths up the northing. A building symbol centred in 3355 would typically be estimated at ~335554.
(b) Location of Tampville relative to reservoir. [2]
Answer: Tampville is west or west-southwest of the reservoir [1]. It is approximately 2.5 to 3 km away [1] — measured distance ~5–6 cm at 1:25 000 scale (1 cm = 0.25 km), so 5 × 0.25 = 1.25 km to 6 × 0.25 = 1.5 km if closer; or by grid difference: from ~3353 to 3756 is roughly 4 grid squares east and 3 north, diagonal distance ~5 squares × 1 km (1:25 000 grid squares are 1 km) = ~5 km. Accept reasonable estimates with working.
Marking: 1 mark correct direction; 1 mark plausible distance with some evidence.
(c) Why industrial estate east of Tampville. [2]
Answers (any two points):
- Prevailing wind direction likely from west (common in Singapore region), so industry placed downwind to reduce air pollution over residential Tampville [1]
- Land to east may be flatter/more suitable for large buildings [1]
- Less valuable land away from established town centre [1]
- Road and rail access available along same corridor [1]
(d) Unsuitable for housing, two reasons. [3]
Marking: 1 mark each for two distinct reasons with map evidence; 1 mark for quality of explanation.
Reason 1: Steep terrain [1]. The close contour lines between eastings 36–38, northings 56–57 indicate steep slopes [1], making construction difficult and expensive, and creating landslide risks during heavy rain [1].
Reason 2: Water catchment/forest protection [1]. The area may include reservoir catchment protection zone [1] — development would risk water pollution [1].
Alternative: Proximity to reservoir may have buffer zone restrictions.
(e) Factors for Site A (3554) vs Site B (3656). [4]
Marking: 2 marks per valid factor with site-specific evidence and clear comparison, max 4 marks.
Factor 1: Slope/Relief
- Site A: Appears relatively flat, suitable for construction [1]
- Site B: Near steep slopes (close contours), more difficult and expensive to build on [1]
Factor 2: Access/Transport
- Site A: Close to railway station at 3354 and Jalan Besar road; good existing infrastructure [1]
- Site B: Further from main road and railway; may need new infrastructure [1]
Factor 3: Existing land use/disamenity
- Site A: Adjacent to existing settlement, facilities available [1]
- Site B: Near industrial estate at 3653; possible noise/air pollution [1]
Factor 4: Distance to services
- Site A: Near school (3355) and church (3454); community facilities [1]
- Site B: More isolated from existing services [1]
Question 18 [8 marks]
(a) Two trends. [2]
Trend 1: Total water consumption increased steadily from 280 million m³ in 2000 to 420 million m³ in 2020 [1].
Trend 2: Per capita water consumption decreased steadily from 165 litres/day in 2000 to 140 litres/day in 2020 [1].
Alternative Trend: Despite population growth, individual water use became more efficient [1].
(b) Percentage decrease in per capita consumption. [2]
Working:
- Decrease = 165 − 140 = 25 litres/day
- Percentage decrease = (25 / 165) × 100
- = 0.1515... × 100
- = 15.2% (to 1 decimal place) [2 marks]
Marking: 1 mark for correct method (decrease ÷ original × 100); 1 mark for accurate final answer. Accept 15.1% or 15.15% if rounding explained.
(c) Two reasons for per capita decrease but total increase. [2]
Reason 1: Population grew faster than efficiency gains — more people using water overall despite each person using less [1].
Reason 2: Water conservation measures implemented (water-efficient appliances, public education campaigns, pricing policies) reduced individual use [1].
Alternative: Industrial/commercial expansion increased non-domestic demand; or: total includes non-domestic sectors where per capita refers to domestic use.
(d) Evaluate 130 litres/day target by 2030. [3]
Marking: 1 mark for supported judgement; 1 mark for trend evidence; 1 mark for reasoned evaluation of 2030 target.
Sample answer: The target appears achievable [1]. Per capita consumption fell from 165 to 140 litres/day over 20 years (2000–2020), a decrease of 25 litres [1]. The target requires a further 10 litres reduction in 10 years, which is a slower rate of decrease than achieved previously [1]. However, continuing conservation efforts and technological improvements make this realistic, though diminishing returns may make further reductions harder to achieve [1].
Alternative (qualified): The target is challenging [1] because previous reductions relied on easy efficiency gains now largely implemented; each further litre saved becomes more difficult [1]. The 20-litre drop in 20 years (2000–2020) slows to needing 10 litres in 10 years, which is actually maintaining pace [1], so it may be achievable with sustained effort [1].
END OF MARKING SCHEME
Total Marks: 60
Free quiz and exam paper access
Enter your details to view this paper
Your access is remembered on this device.