From Real Exams Exam Paper
Secondary 1 Geography Semestral Assessment 2 (End of Year) Paper 2
Free Sec 1 Geography SA2 Paper 2, HY3 Exam version, with questions, answers, and syllabus-aligned practice for Singapore students.
These static practice materials are generated from the site's syllabus and paper-generation workflow, with source and model context shown so students and parents can evaluate the material before use.
Questions
TuitionGoWhere Exam Practice (AI) — Secondary 1 Geography SA2 Practice Paper
School: TuitionGoWhere Secondary School (AI)
Subject: Geography
Level: Secondary 1
Paper: SA2 Practice Paper (Version 2 of 5)
Duration: 60 minutes
Total Marks: 60
Name: ___________________________
Class: ________
Date: ____________
Instructions
- This paper contains 20 questions across three sections.
- Answer all questions in the spaces provided.
- Use the maps, graphs, and tables provided to support your answers.
- Marks for each question are shown in brackets [ ].
Section A: Map Skills (Questions 1–7) [21 marks]
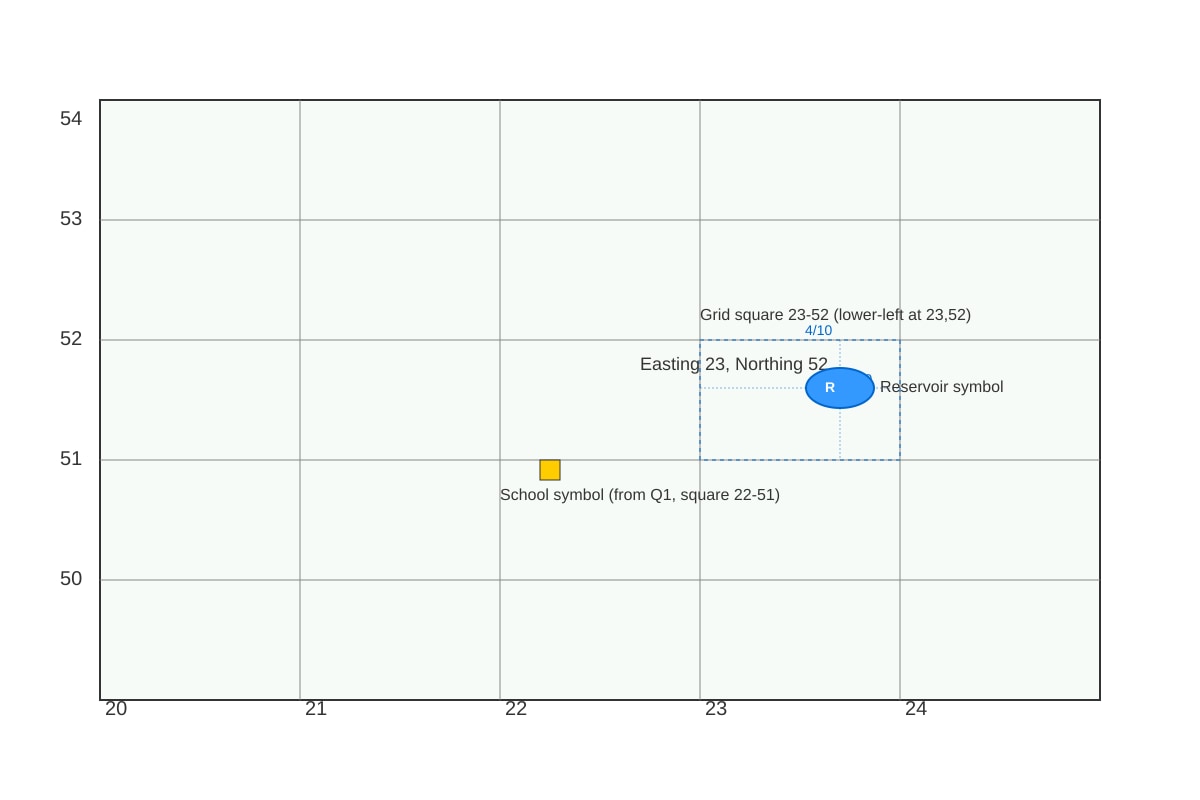
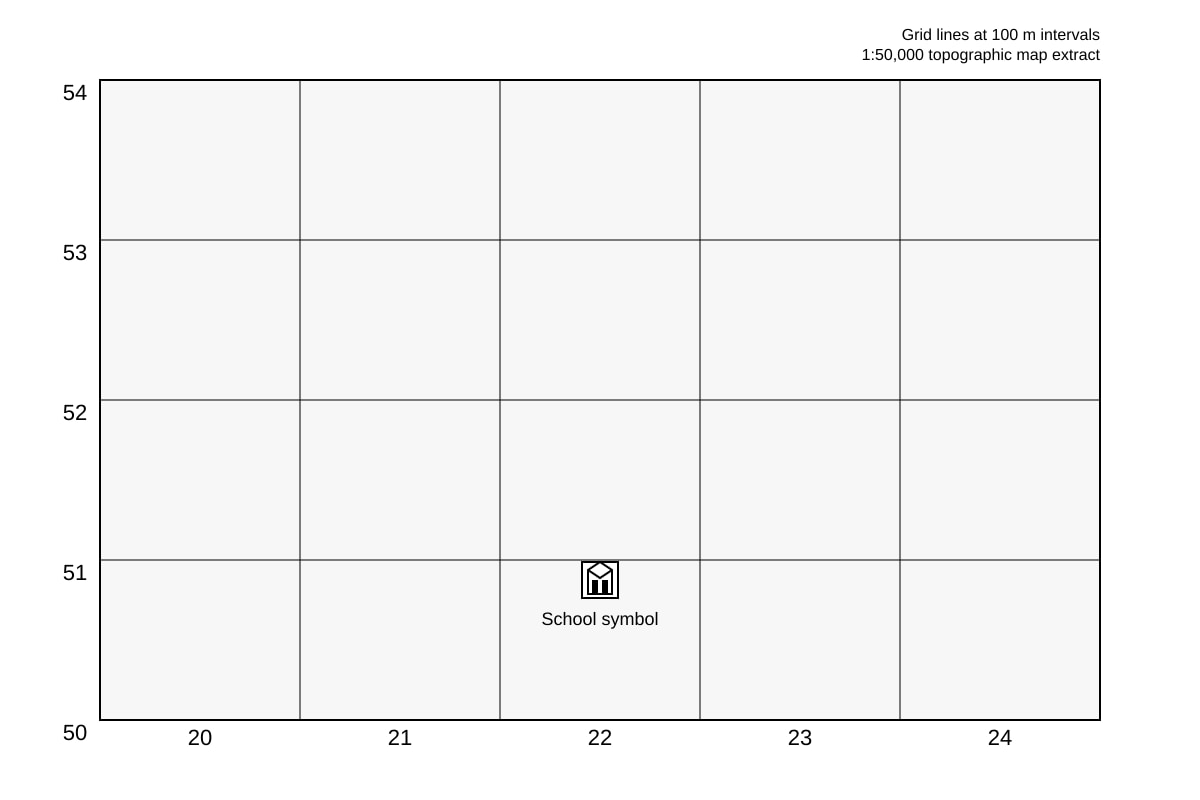
1. Study the map extract below. State the four-figure grid reference of the school. [1]
Image pending generation: map for Q1.
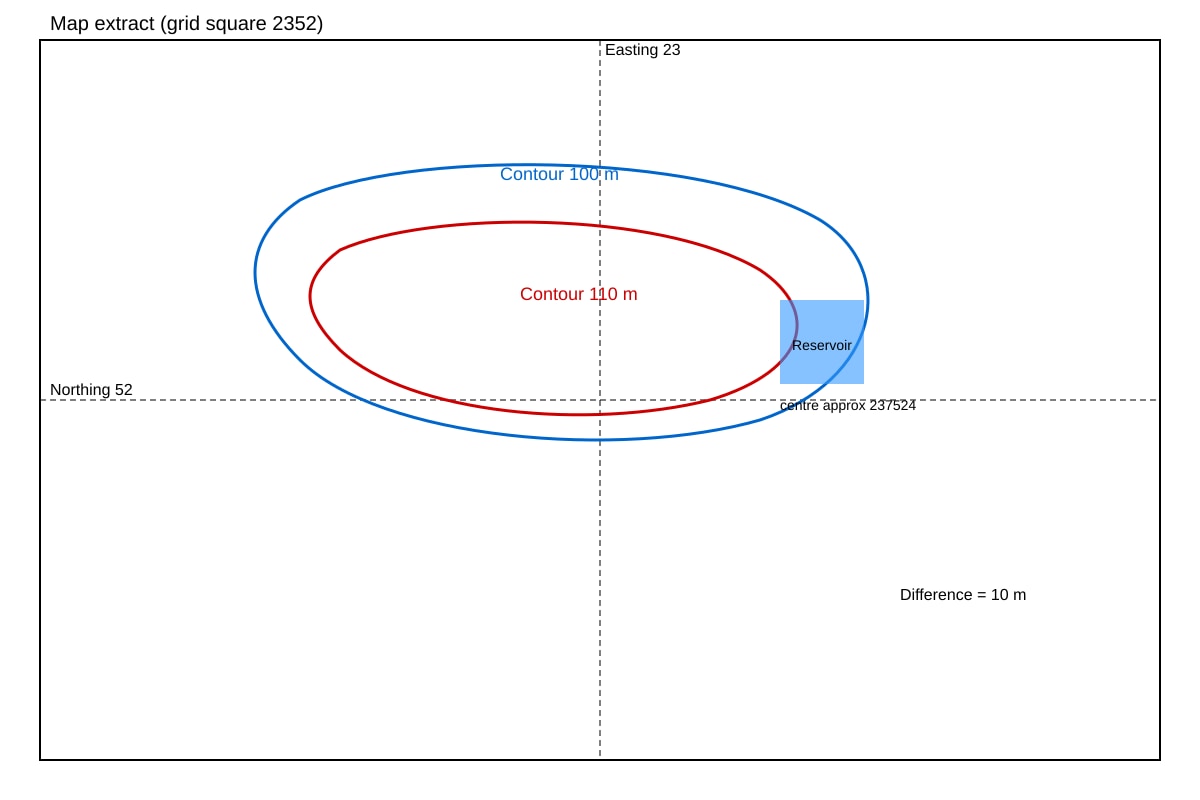
2. State the six-figure grid reference of the reservoir shown on the map. [1]
Image pending generation: map for Q2.
3. State the contour interval of the map. [1]
Image pending generation: map for Q3.
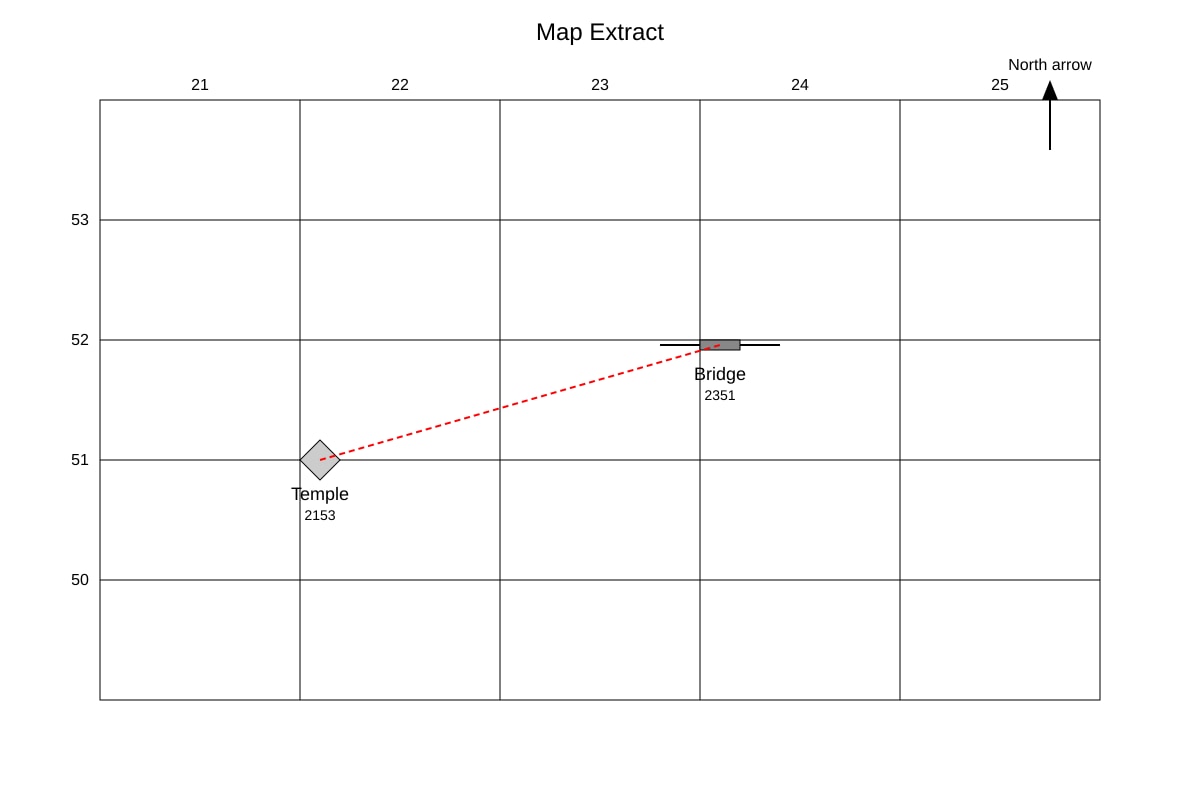
4. Give the bearing from the temple (grid square 2153) to the bridge (grid square 2351). [2]
Image pending generation: map for Q4.
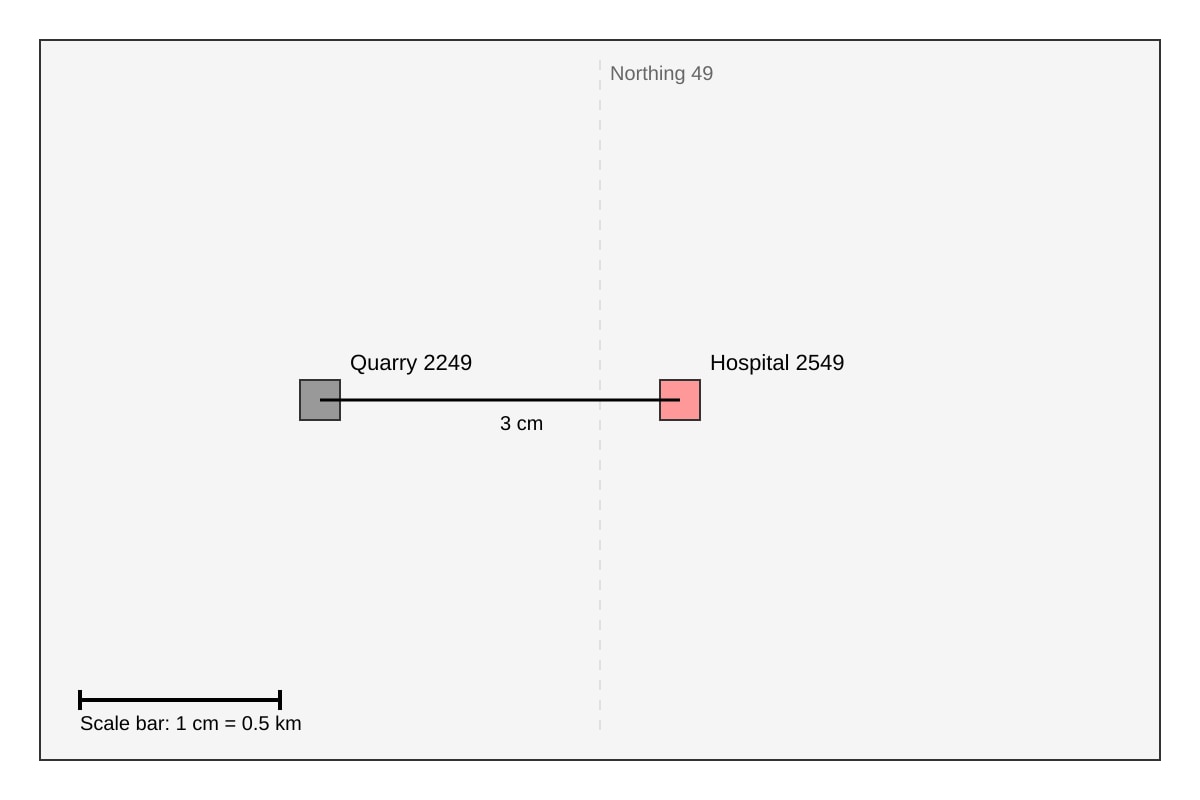
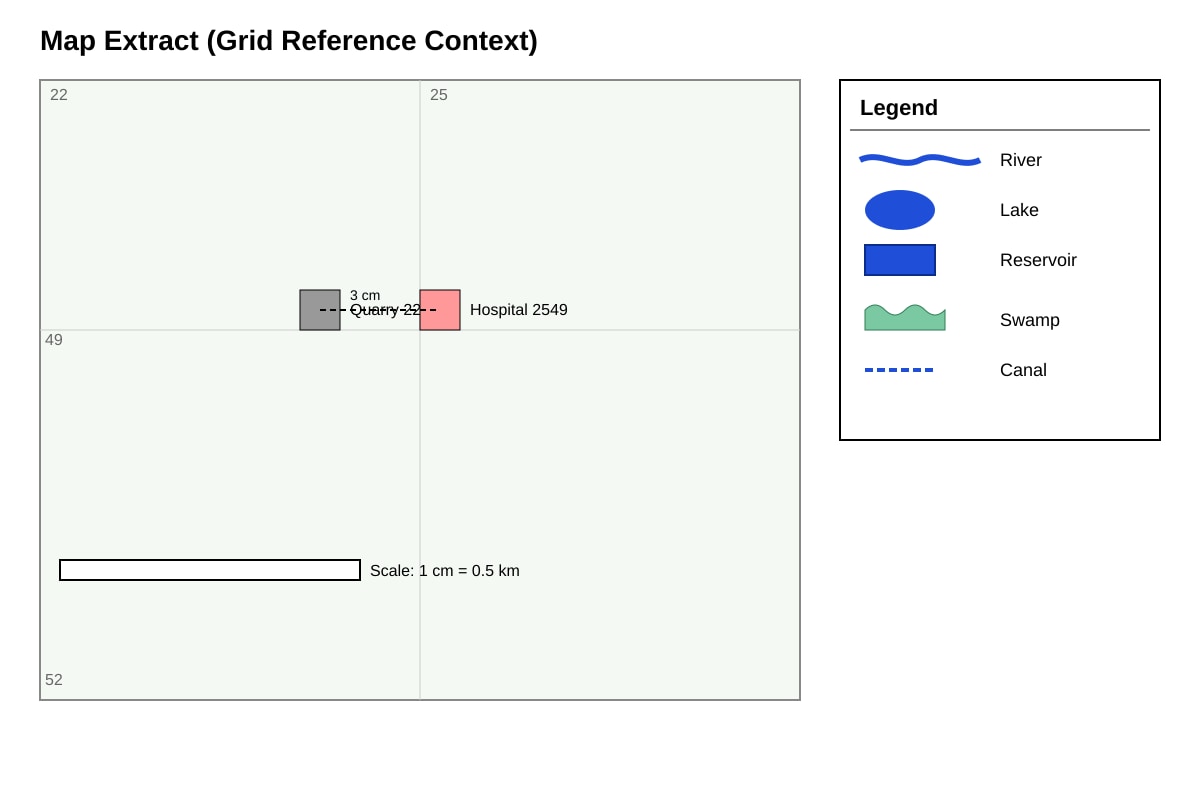
5. Calculate the straight-line distance, in kilometres, between the quarry (2249) and the hospital (2549) using the map scale 1:50,000. [2]
Image pending generation: map for Q5.
6. State two map symbols that show water features. [2]
Image pending generation: map for Q6.
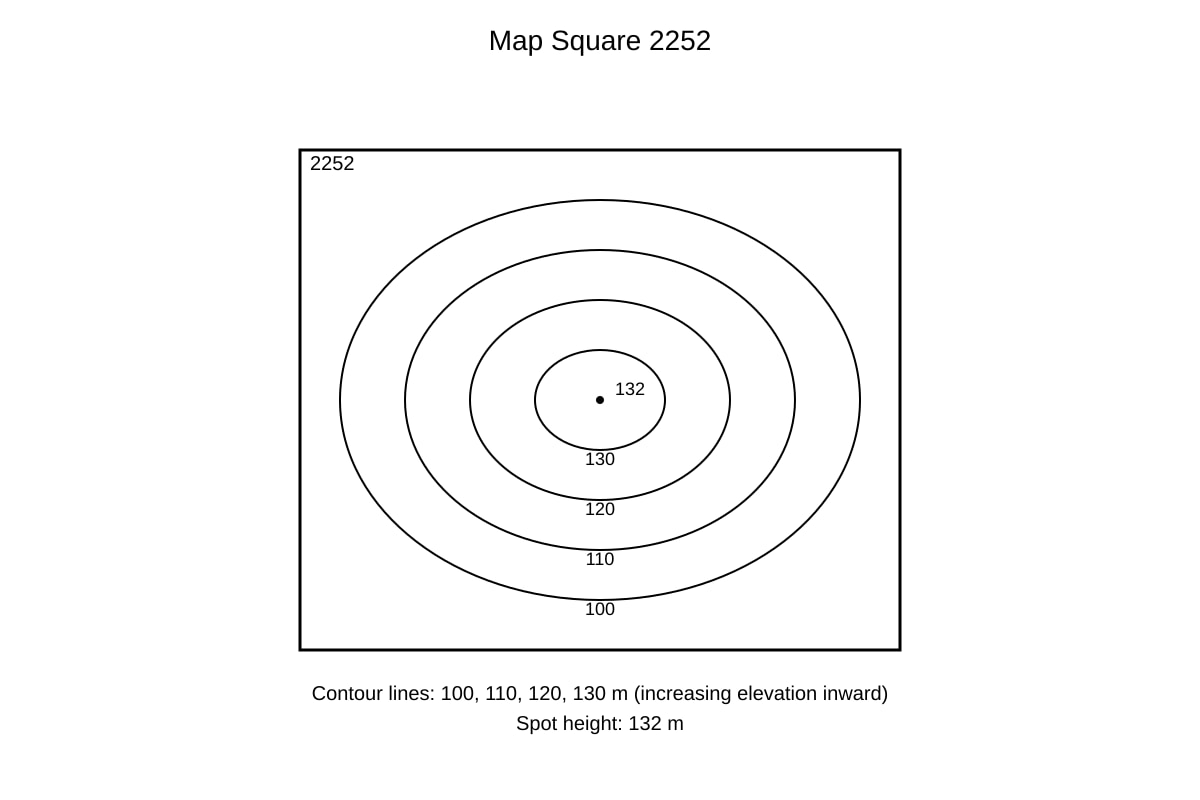
7. Describe the relief of the area enclosed in grid square 2252. [3]
Image pending generation: map for Q7.
Section B: Graph & Data Interpretation (Questions 8–14) [21 marks]
8. Study the table below. State the planet with the greatest number of moons. [1]
| Planet | Distance from Sun (million km) | Number of moons | Diameter (km) |
|---|---|---|---|
| Mercury | 58 | 0 | 4,879 |
| Venus | 108 | 0 | 12,104 |
| Earth | 150 | 1 | 12,742 |
| Mars | 228 | 2 | 6,779 |
| Jupiter | 778 | 95 | 139,820 |
9. Using the table in Q8, describe the relationship between distance from the Sun and diameter. [3]
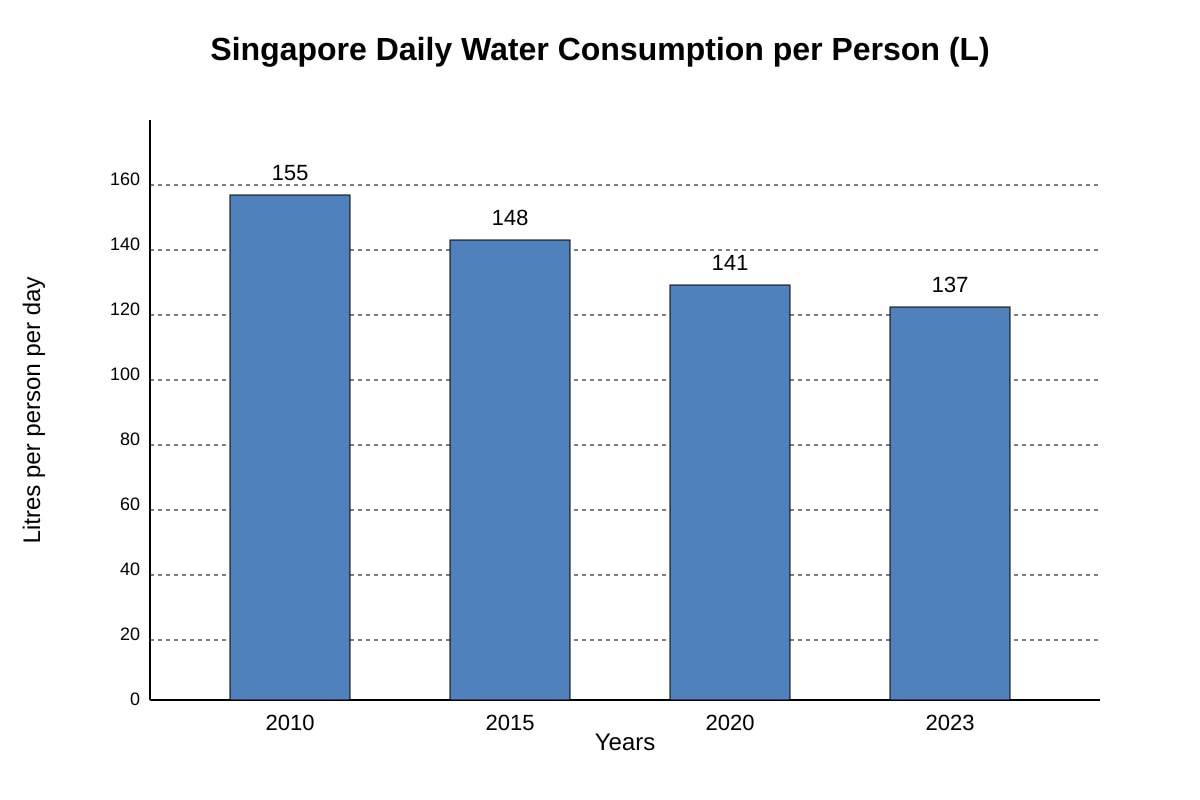
10. Study the bar graph below. State the year with the highest daily water consumption per person in Singapore. [1]
Image pending generation: graph for Q10.
11. With reference to the graph in Q10, describe the trend in water consumption from 2010 to 2023. [3]
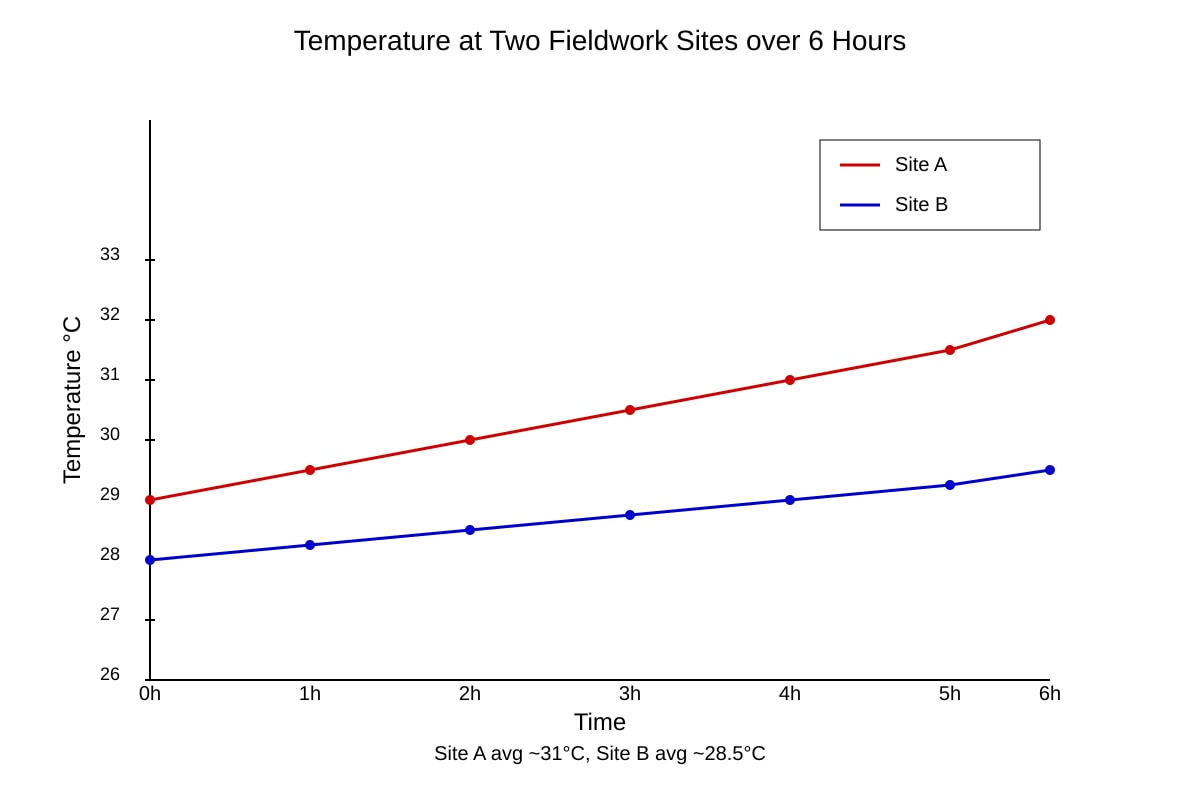
12. Study the line graph below showing temperature at two fieldwork sites. State which site has a higher average temperature. [1]
Image pending generation: graph for Q12.
13. Explain why the temperature difference in Q12 occurs, using geographical knowledge. [3]
14. The table below shows dissolved oxygen (mg/L) at three river sites. Calculate the mean dissolved oxygen. [2]
| Site | Dissolved Oxygen (mg/L) |
|---|---|
| X | 6.2 |
| Y | 5.8 |
| Z | 7.0 |
Section C: Integrated Data & Map Questions (Questions 15–20) [18 marks]
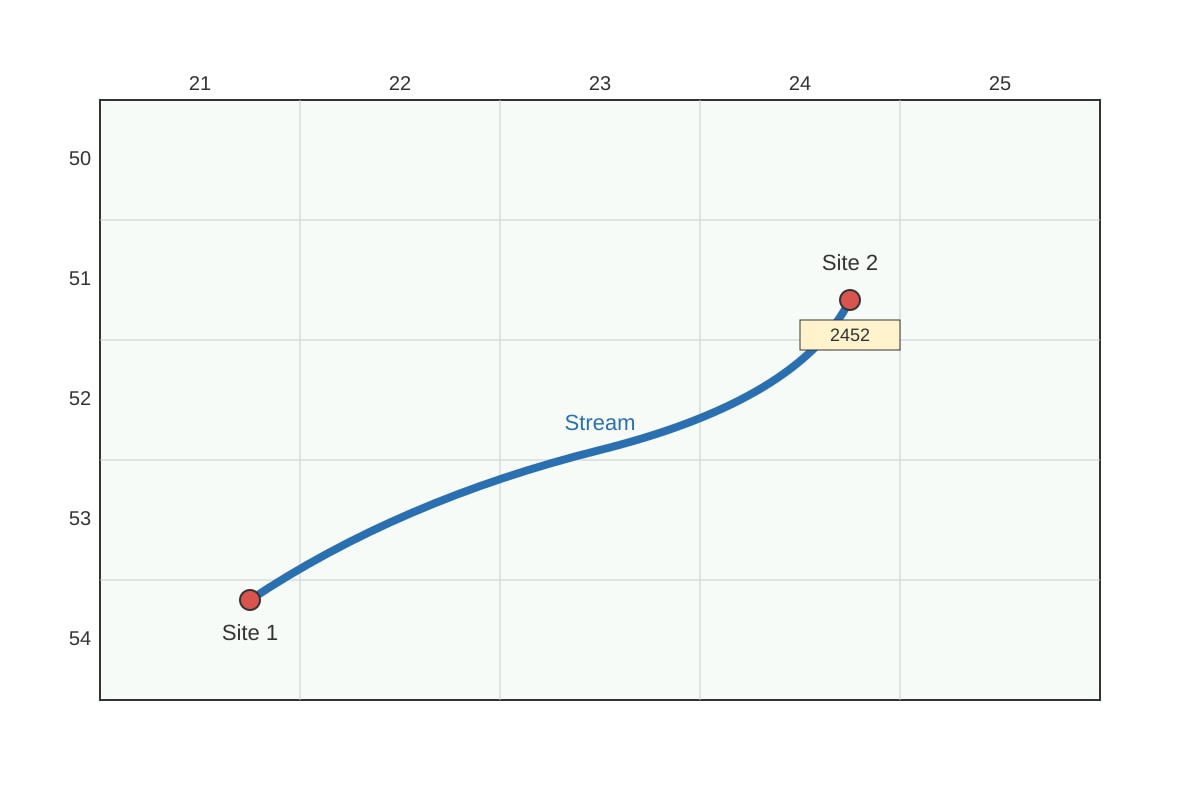
15. A class tested water quality at two sites along a stream. Study the map and table. State the 4-figure grid reference of Site 2. [1]
Image pending generation: map for Q15.
| Site | Turbidity (NTU) | Dissolved Oxygen (mg/L) |
|---|---|---|
| 1 | 12 | 4.1 |
| 2 | 3 | 8.2 |
16. Using the table in Q15, state which site has better water quality. [1]
17. Explain your answer to Q16 using evidence from the data. [3]
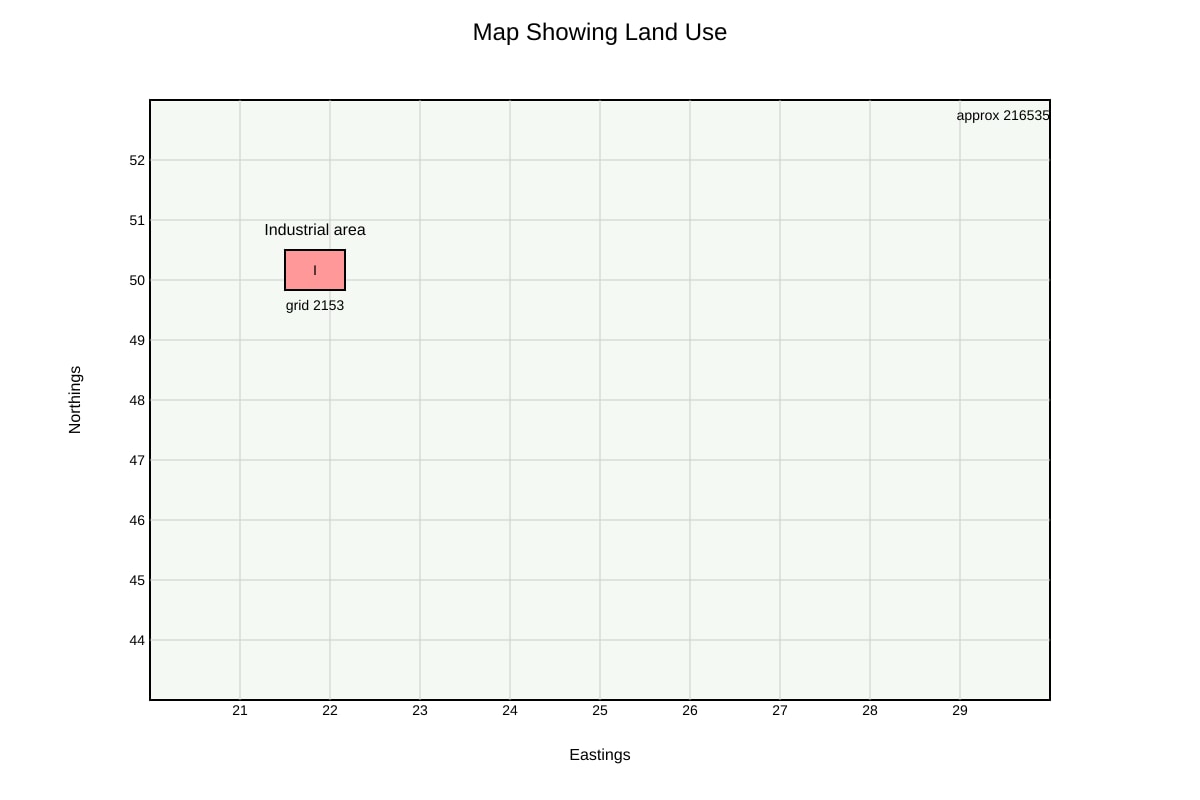
18. Study the map below showing land use. State the 6-figure grid reference of the industrial area. [1]
Image pending generation: map for Q18.
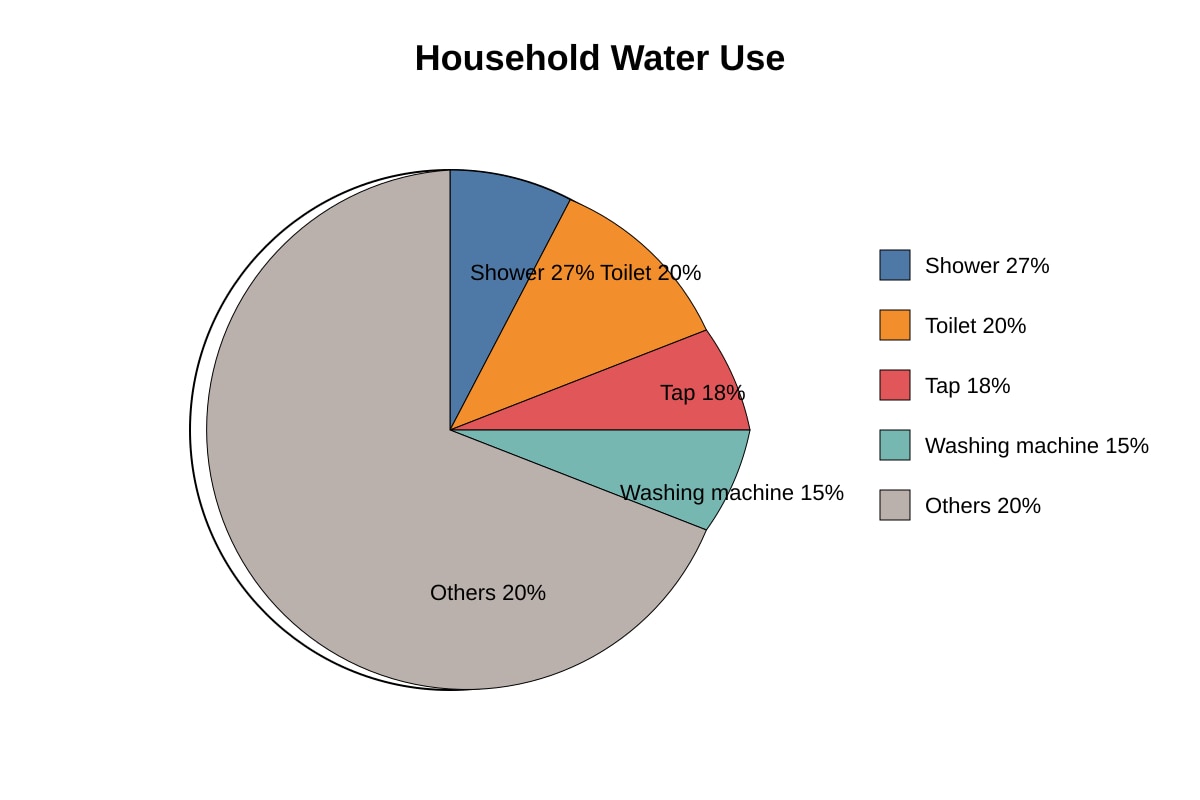
19. Describe two patterns shown in the pie chart of household water use. [2]
Image pending generation: chart for Q19.
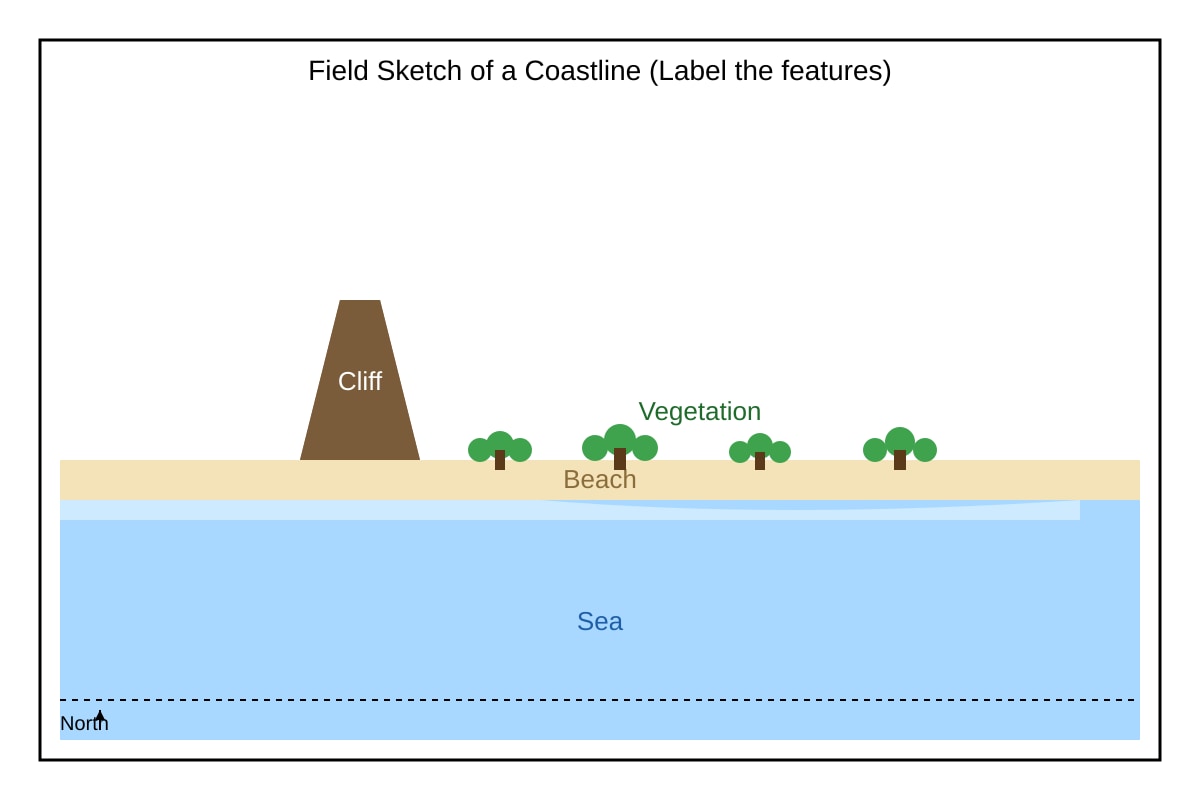
20. A student drew a field sketch. State two features that should be labelled in a field sketch of a coastline. [2]
Image pending generation: figure for Q20.
End of Paper
Answers
TuitionGoWhere Exam Practice (AI) — Secondary 1 Geography SA2 Practice Paper (Version 2) Answer Key
Total Marks: 60
Section A: Map Skills (21 marks)
Q1. [1] 2251
Teaching note: Read easting (22) first, then northing (51). Use lower-left corner of the square containing the school. Common mistake: reversing order to 5122.
Q2. [1] 237524 (acceptable range 237523–237525)
Teaching note: 4-figure = 2352. Subdivide: 7 tenths east = 7, 4 tenths north = 4 → 237524.
Q3. [1] 10 m
Teaching note: Contour interval = difference between adjacent labelled contours = 110 − 100 = 10 m.
Q4. [2] 157° (accept 155°–160°)
Working: Temple (2153) to Bridge (2351): delta east = +2, delta south = −2. Bearing measured clockwise from north = 180° − 23° = 157°. Mark: 1 for direction, 1 for value.
Q5. [2] 1.5 km
Working: Map distance = 3 cm. Scale 1:50,000 → 3 cm × 50,000 = 150,000 cm = 1.5 km. Mark: 1 for 3 cm measured, 1 for conversion.
Q6. [2] Any two: river, lake, reservoir, swamp, canal (1 mark each)
Teaching note: Symbols from legend showing water bodies.
Q7. [3] Relief is hilly / convex; contours concentric and increasing inward; spot height 132 m shows highest point.
Markers: 1 for "hill", 1 for contour pattern, 1 for specific height evidence.
Section B: Graph & Data (21 marks)
Q8. [1] Jupiter
Teaching note: Table shows Jupiter has 95 moons, highest.
Q9. [3] No clear direct relationship; Mercury closest has small diameter (4,879 km), Jupiter farthest has largest (139,820 km), but Venus (108 m km) larger than Mercury yet Earth larger than Venus. Pattern: gas giants farther have larger diameter.
Markers: 1 identify no simple link, 1 compare near planets, 1 note outer giant size.
Q10. [1] 2010
Teaching note: Bar for 2010 is tallest at 155 L.
Q11. [3] Consumption decreased from 155 L (2010) to 137 L (2023); overall declining trend; drop of 18 L over 13 years.
Markers: 1 start, 1 end, 1 trend word.
Q12. [1] Site A
Teaching note: Site A avg ~31°C > Site B ~28.5°C.
Q13. [3] Site A is urban with buildings/roads absorbing heat (urban heat island); Site B is park with vegetation shading and evapotranspiration cooling.
Markers: 1 urban cause, 1 rural cause, 1 link to data.
Q14. [2] Mean = (6.2 + 5.8 + 7.0) / 3 = 19.0 / 3 = 6.33 mg/L
Mark: 1 for sum, 1 for division.
Section C: Integrated (18 marks)
Q15. [1] 2452
Teaching note: Lower-left of square with Site 2.
Q16. [1] Site 2
Teaching note: Lower turbidity, higher DO.
Q17. [3] Site 2 better because turbidity 3 NTU < 12 NTU (clearer), DO 8.2 > 4.1 (more oxygen for aquatic life).
Markers: 1 turbidity, 1 DO, 1 conclusion.
Q18. [1] 216535 (range 216534–216536)
Teaching note: 2153 + subdivisions.
Q19. [2] Shower largest (27%); Toilet and Others equal (20% each); any two correct = 2 marks.
Markers: 1 each.
Q20. [2] Any two: sea, beach, cliff, vegetation/plants.
Markers: 1 each. Field sketch should show natural and human features.
Free quiz and exam paper access
Enter your details to view this paper
Your access is remembered on this device.