From Real Exams Exam Paper
Secondary 1 Geography Semestral Assessment 2 (End of Year) Paper 1
Free Sec 1 Geography SA2 Paper 1, Kimi2.6 Exam version, with questions, answers, and syllabus-aligned practice for Singapore students.
These static practice materials are generated from the site's syllabus and paper-generation workflow, with source and model context shown so students and parents can evaluate the material before use.
Questions
TuitionGoWhere Practice Paper - Geography Secondary 1
TuitionGoWhere Secondary School (AI)
Subject: Geography
Level: Secondary 1 (G2/G3)
Paper: SA2 Practice Paper
Duration: 1 hour 30 minutes
Total Marks: 60
Version: 1 of 5
Name: _________________________________
Class: _________________________________
Date: _________________________________
Instructions
- Write your answers in the spaces provided.
- Use only pencil for all map work and drawings.
- Calculators are not permitted.
- Read each question carefully before answering.
- Answer ALL questions.
Section A: Map Skills (Questions 1–8, 20 marks)
Answer all questions in this section.
Question 1
Study the map extract below.
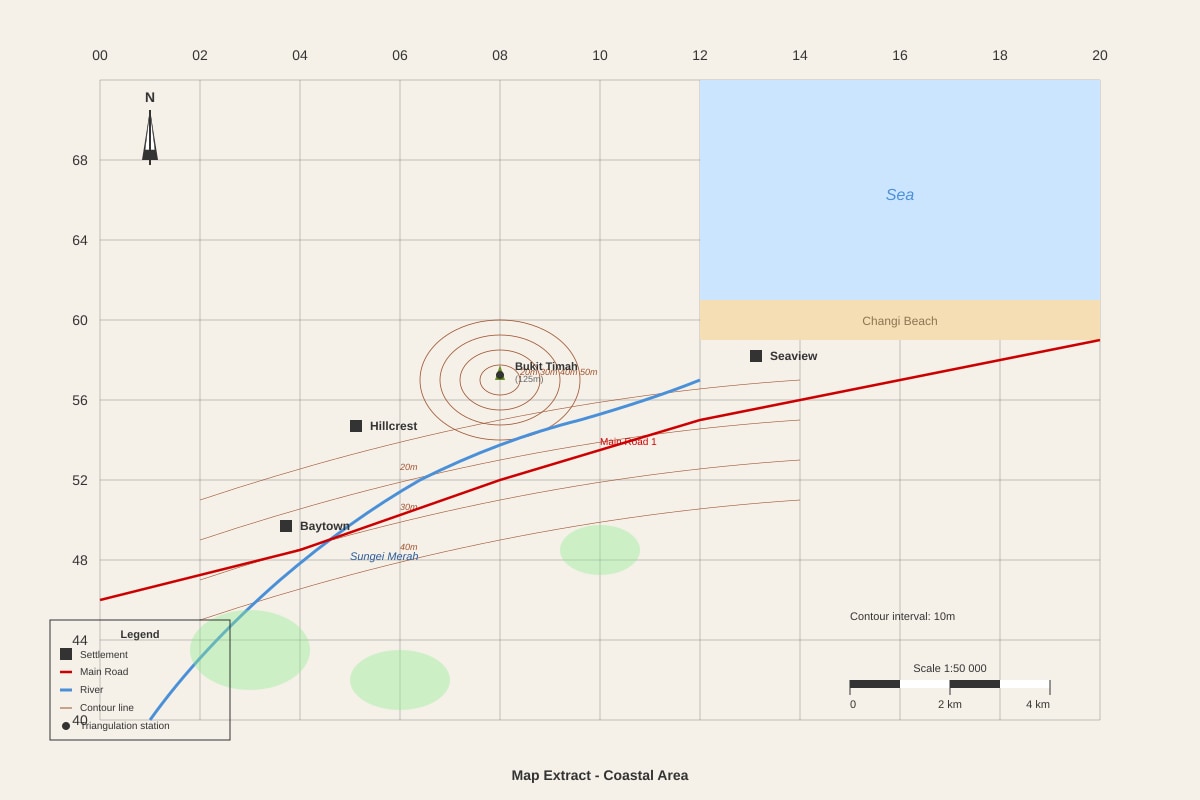
Generated map for Q1.
(a) State the 4-figure grid reference of Baytown. [1]
(b) State the 6-figure grid reference of the triangulation station on Bukit Timah. [2]
(c) State the direction of Seaview from Hillcrest. [1]
Question 2
Using the same map extract:
(a) Measure the straight-line distance between Baytown and Seaview. Give your answer in kilometres. [2]
(b) Explain why the actual walking distance along Main Road 1 between Baytown and Seaview is longer than your answer in (a). [2]
Question 3
Study the map extract and the cross-section below.
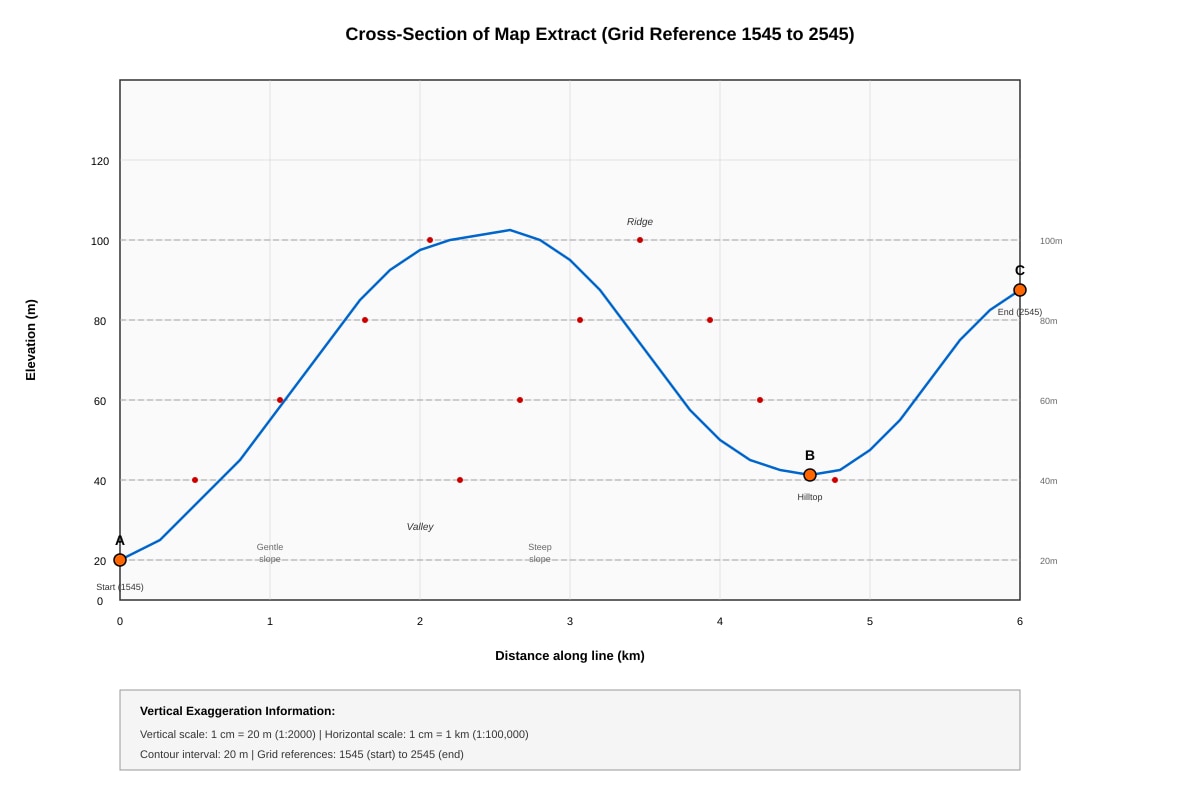
Generated graph for Q3.
(a) Using the contour interval on the map, calculate the vertical exaggeration of the cross-section. Show your working. [2]
(b) Identify the landform shown at point B on the cross-section. [1]
(c) Suggest one reason why the area around point C might be suitable for farming. [1]
Question 4
Study the weather data table for Singapore.
| Month | Temperature (°C) | Rainfall (mm) |
|---|---|---|
| January | 26.5 | 234 |
| February | 27.1 | 112 |
| March | 27.5 | 170 |
| April | 28.0 | 155 |
| May | 28.5 | 171 |
| June | 28.3 | 132 |
| July | 27.9 | 154 |
| August | 27.8 | 148 |
| September | 27.6 | 177 |
| October | 27.4 | 198 |
| November | 26.9 | 258 |
| December | 26.3 | 319 |
(a) Identify the month with the highest mean temperature. [1]
(b) Calculate the total annual rainfall. Show your working. [2]
(c) Describe the pattern of rainfall throughout the year. [2]
Question 5
Study the climate graph below.
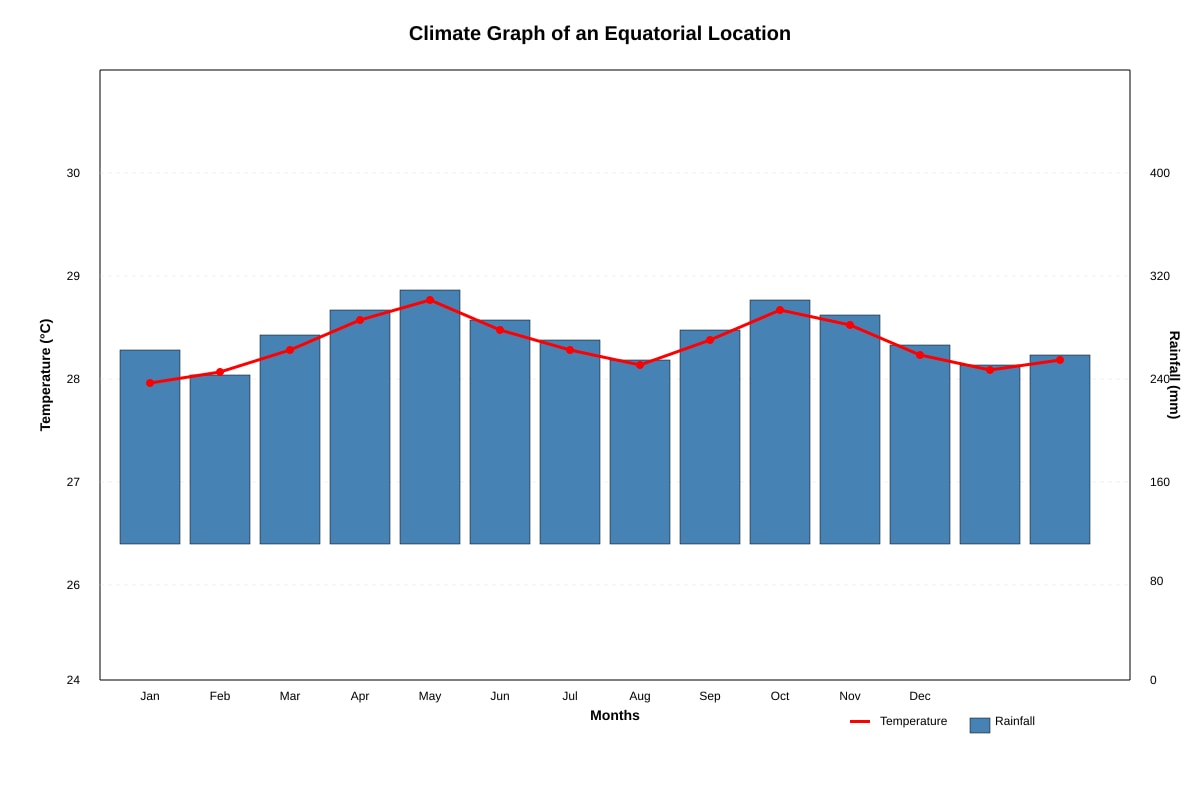
Generated graph for Q5.
(a) Identify the climate type shown in the graph. [1]
(b) Explain two pieces of evidence from the graph that support your answer in (a). [2]
Question 6
Study the photograph below of a tropical rainforest.
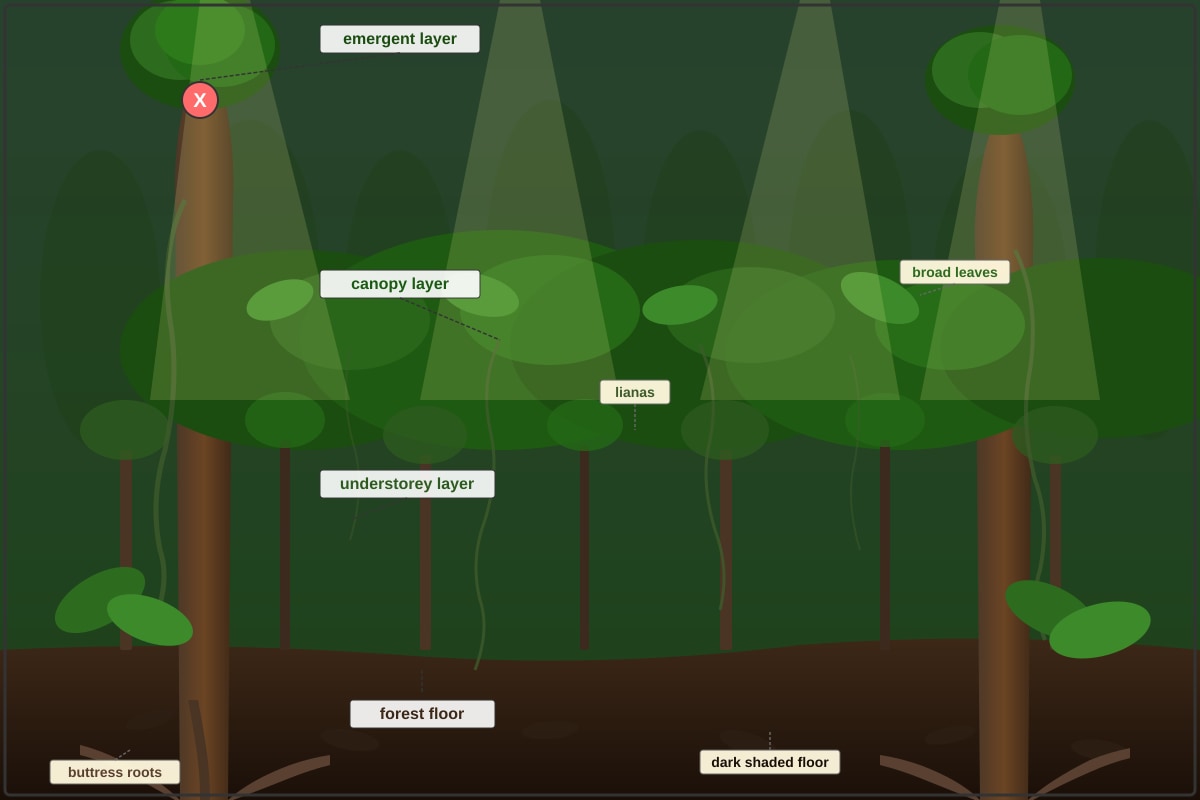
Generated source_image for Q6.
(a) Identify the layer labelled X (the tallest trees). [1]
(b) Explain how the vegetation in the canopy layer adapts to the high rainfall in tropical rainforests. [2]
Question 7
Study the bar graph showing population data for four countries.
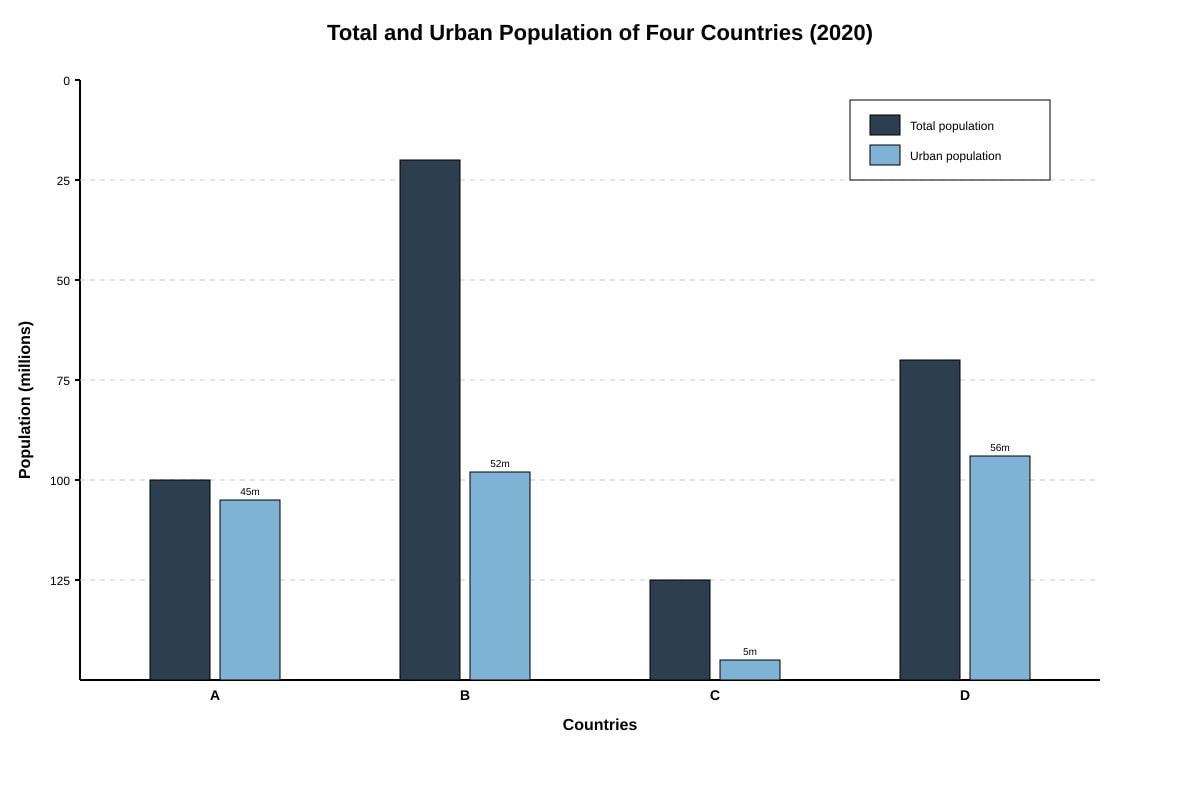
Generated graph for Q7.
(a) Calculate the percentage of urban population for Country B. Show your working. [2]
(b) Which country has the highest level of urbanisation? Explain your answer using data from the graph. [2]
Question 8
Study the pie chart showing land use in Singapore.
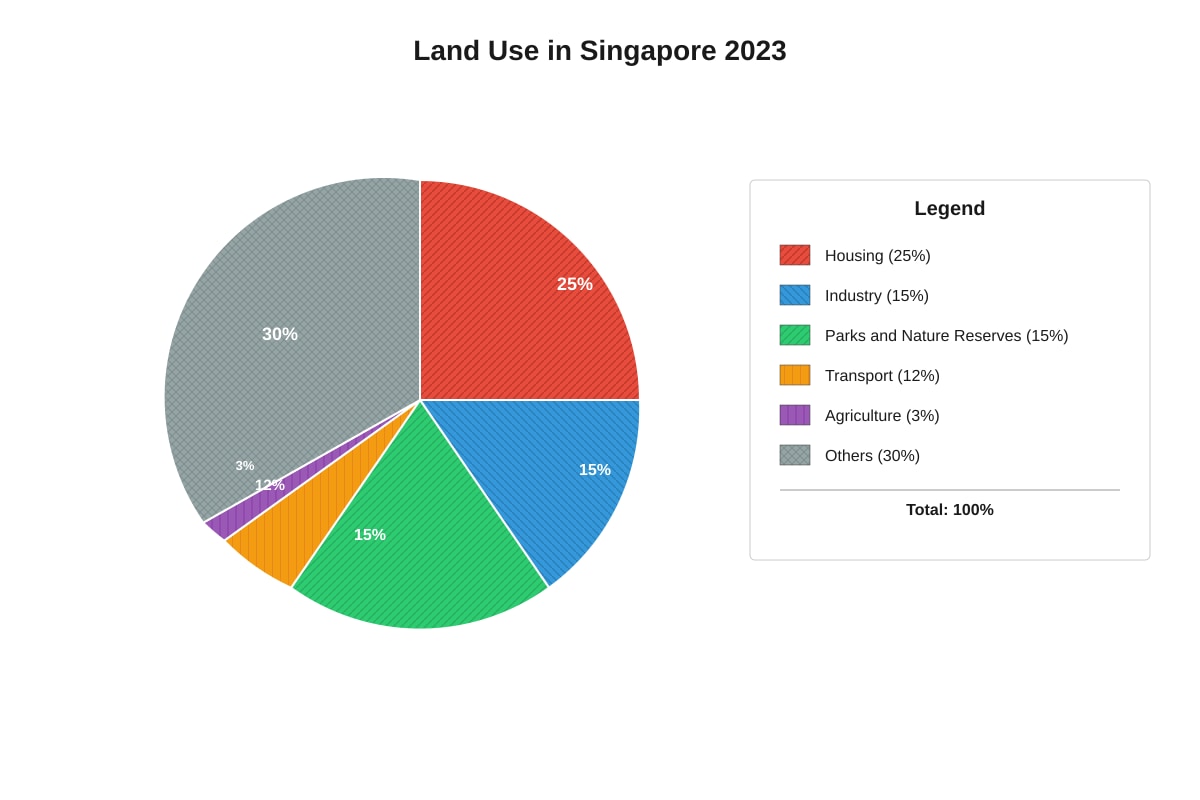
Generated chart for Q8.
(a) Calculate the total percentage of land used for housing and industry combined. [1]
(b) Suggest two reasons why Singapore has a relatively small percentage of land used for agriculture. [2]
Section A Total: 20 marks
Section B: Data Analysis and Interpretation (Questions 9–14, 25 marks)
Answer all questions in this section.
Question 9
Study the table showing water quality data from four rivers.
| River | pH | Dissolved Oxygen (mg/L) | Turbidity (NTU) | BOD (mg/L) |
|---|---|---|---|---|
| P | 6.8 | 8.5 | 15 | 2 |
| Q | 7.2 | 4.2 | 45 | 8 |
| R | 8.1 | 9.0 | 8 | 1 |
| S | 5.5 | 3.1 | 120 | 15 |
(a) Which river has the cleanest water? Explain your answer using evidence from the table. [2]
(b) River S is located near an industrial estate with factories that discharge waste into the river. Suggest two ways this waste affects the water quality measurements shown. [2]
Question 10
Study the line graph showing water levels in a reservoir over one year.
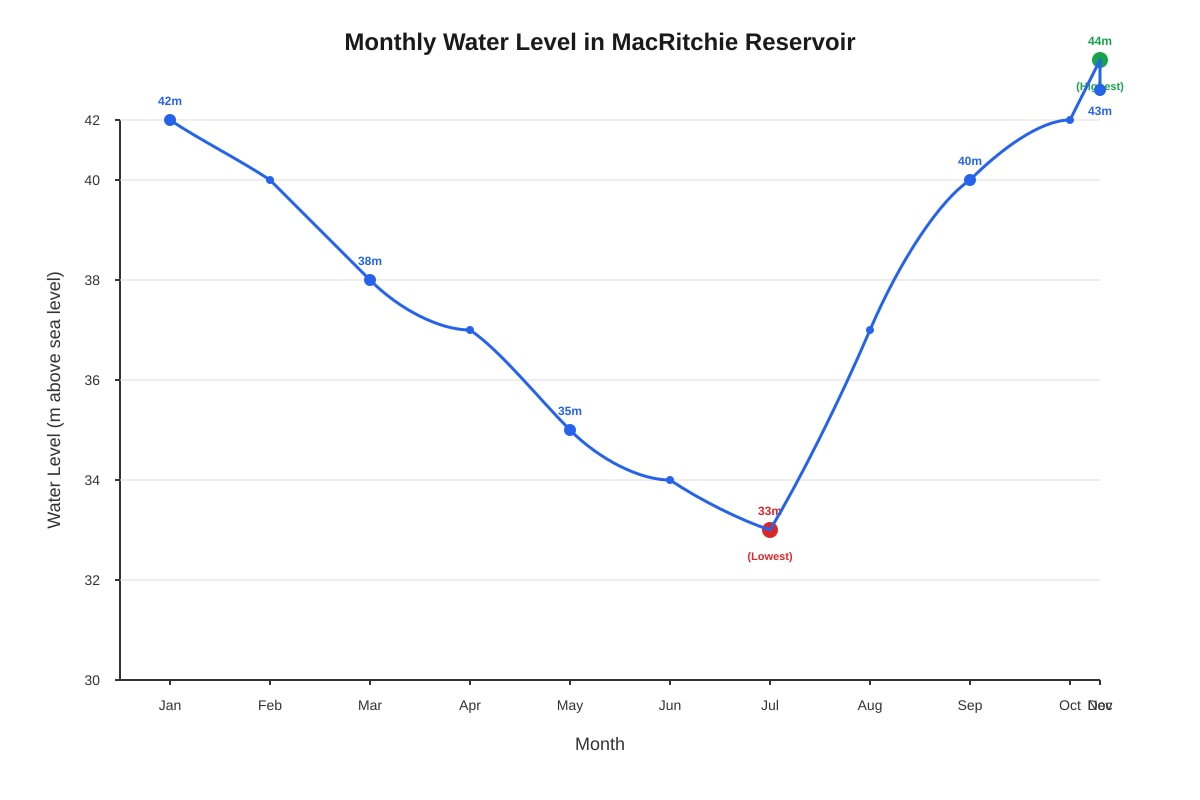
Generated graph for Q10.
(a) State the lowest water level shown on the graph and when it occurred. [1]
(b) Calculate the range of water levels shown. Show your working. [1]
(c) Suggest two reasons why the water level is lowest in July. [2]
Question 11
Study the scatter graph showing the relationship between rainfall and river discharge.
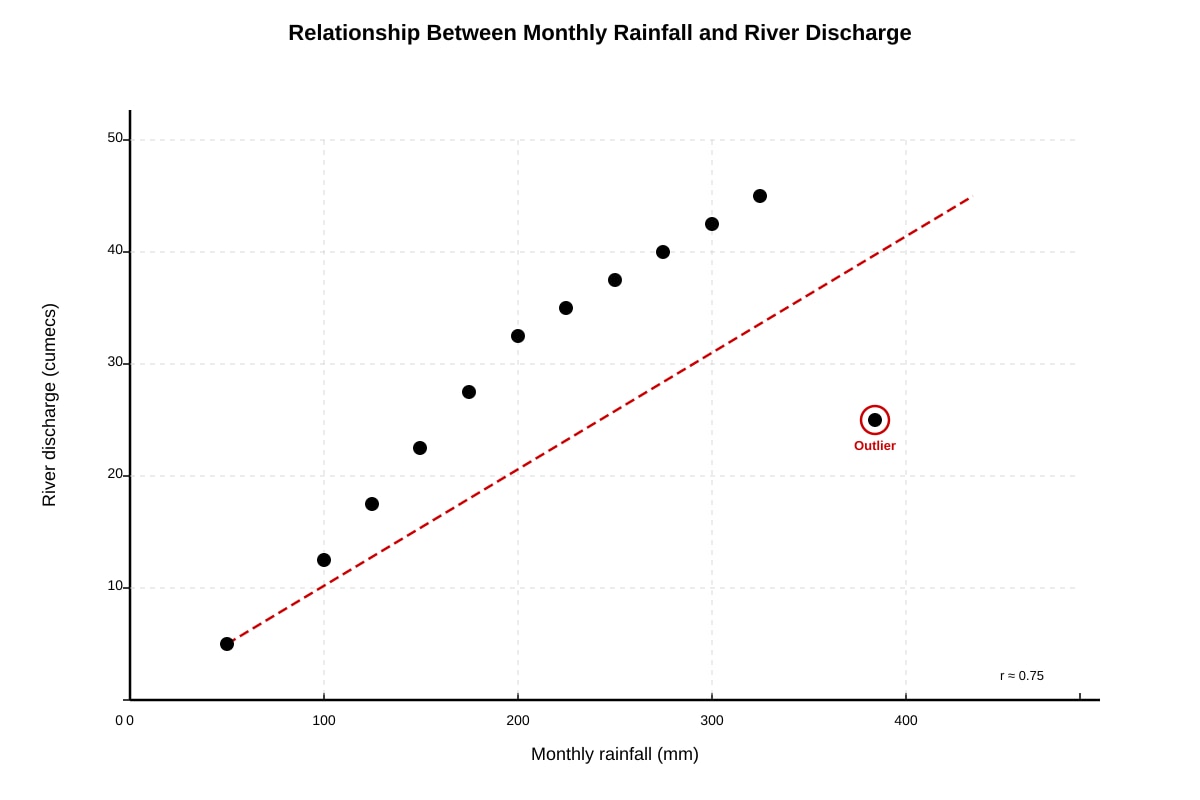
Generated graph for Q11.
(a) Describe the relationship between rainfall and river discharge shown on the graph. [2]
(b) Suggest one reason why the circled point is an outlier. [1]
(c) Explain why this type of graph is useful for showing relationships between two variables. [1]
Question 12
Study the choropleth map showing population density across different regions of a country.
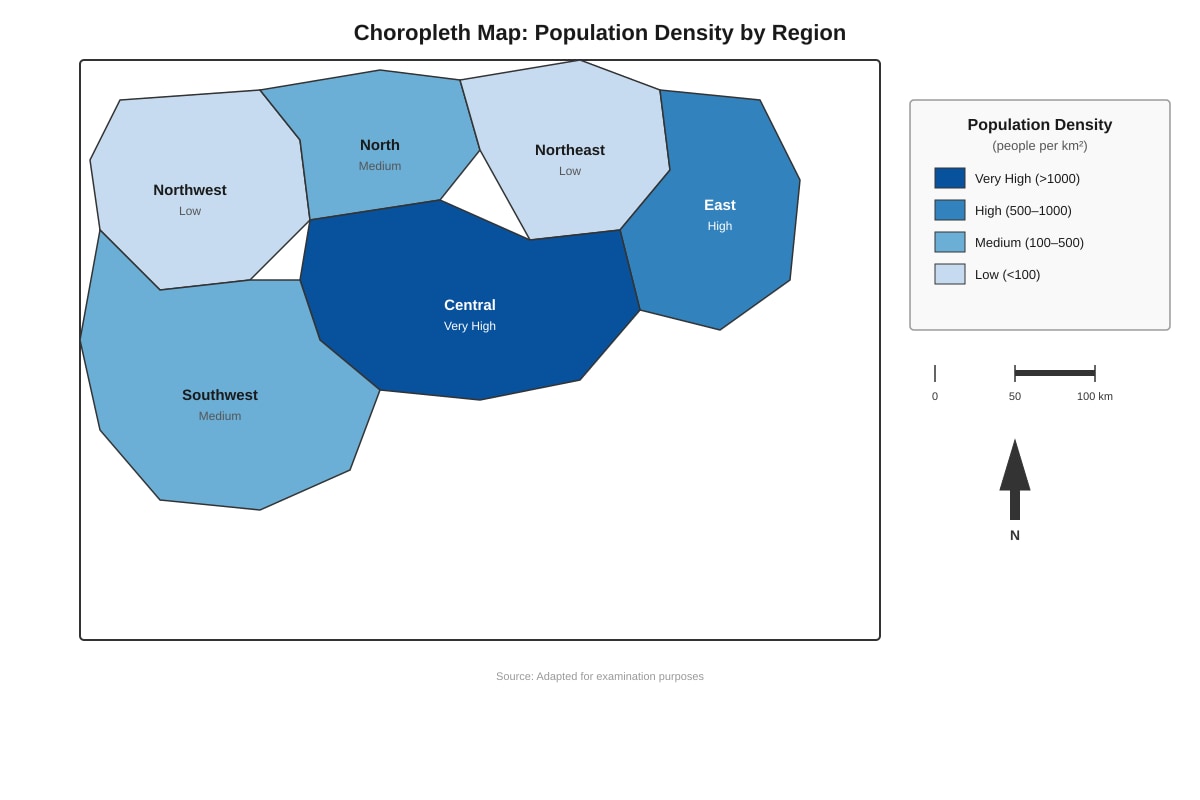
Generated map for Q12.
(a) Which region has the highest population density? [1]
(b) Suggest two reasons why the Central region has a very high population density. [2]
(c) Explain one disadvantage of using a choropleth map to show population distribution. [1]
Question 13
Study the flow diagram showing the water cycle.
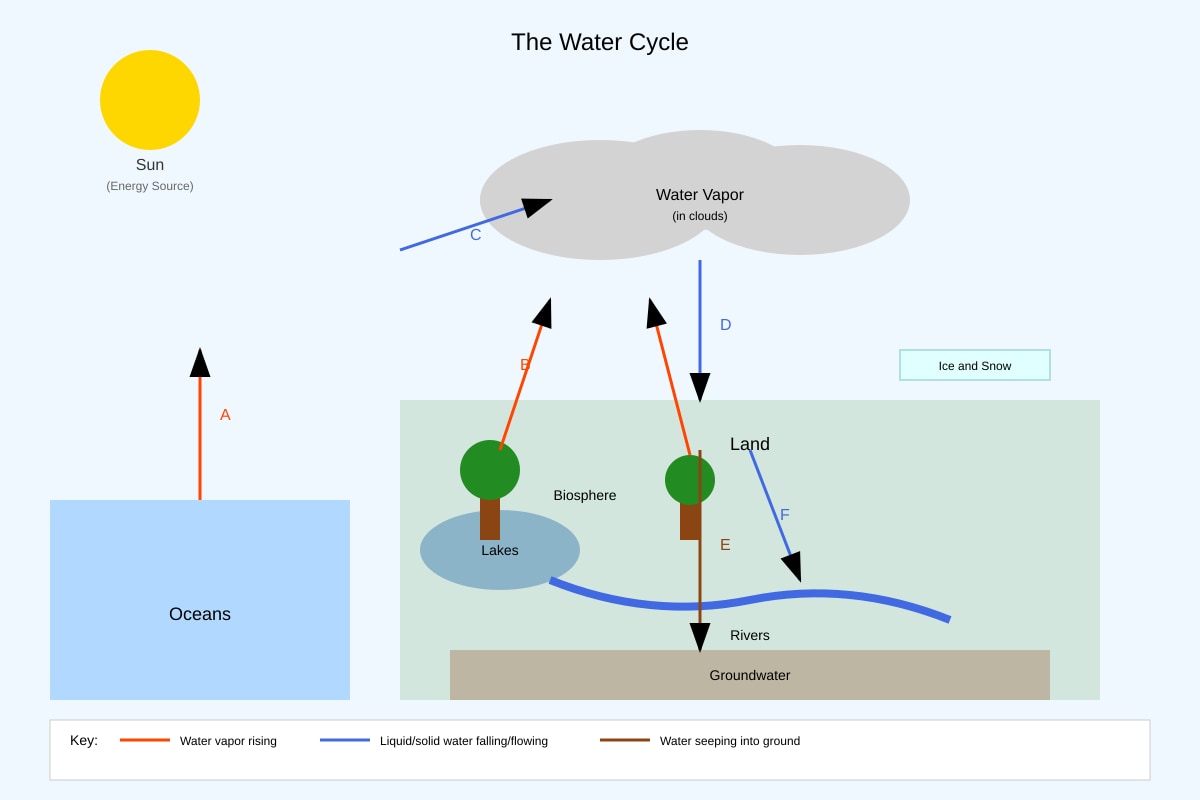
Generated diagram for Q13.
Identify the processes labelled A, B, C, and D on the diagram. [4]
| Letter | Process |
|---|---|
| A | |
| B | |
| C | |
| D |
Question 14
Study the table and graph showing energy consumption data.
| Source | Energy Consumption 2010 (%) | Energy Consumption 2020 (%) |
|---|---|---|
| Natural Gas | 78 | 95 |
| Oil | 20 | 3 |
| Coal | 1 | 1 |
| Solar | 1 | 1 |
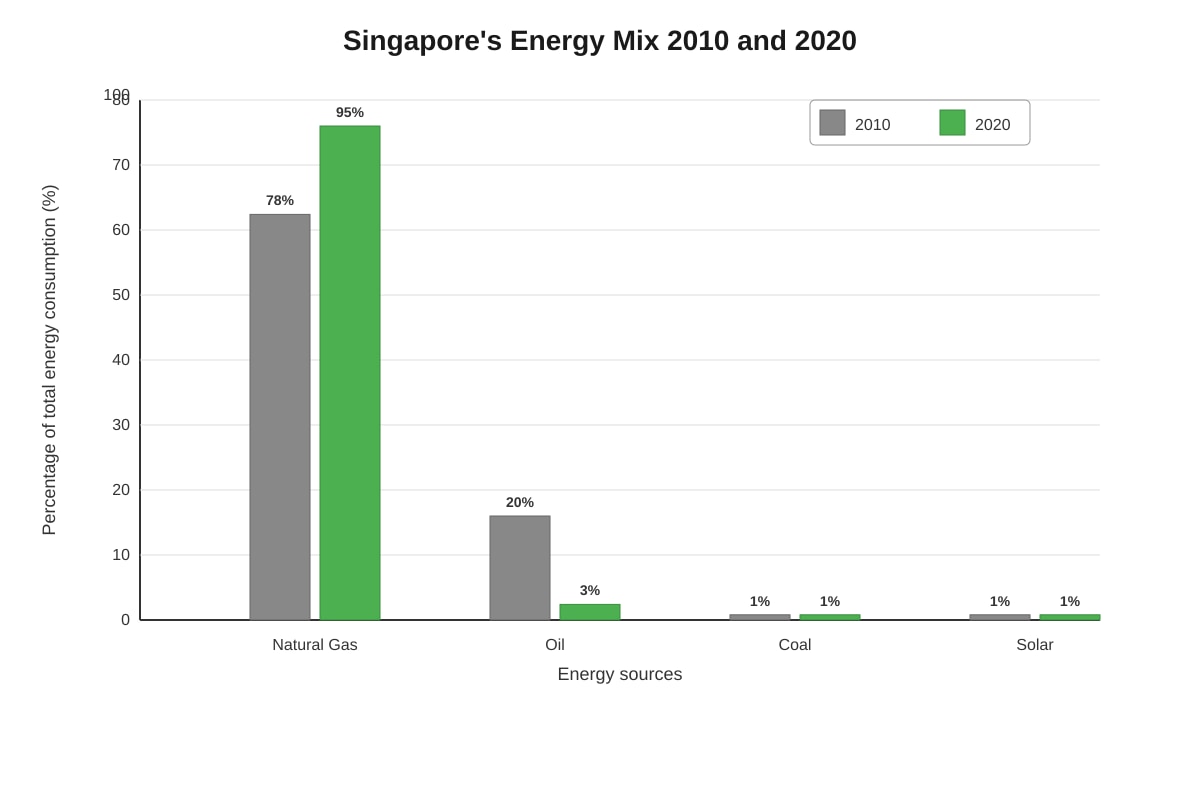
Generated graph for Q14.
(a) Describe two changes in Singapore's energy mix between 2010 and 2020. Use data in your answer. [2]
(b) Suggest one reason why Singapore increased its use of natural gas between 2010 and 2020. [1]
(c) Despite the increase in natural gas, Singapore still faces challenges in energy sustainability. Suggest two strategies Singapore could use to become more energy sustainable. [2]
Section B Total: 25 marks
Section C: Application and Evaluation (Questions 15–18, 15 marks)
Answer all questions in this section.
Question 15
Study the map and information about a new town development.
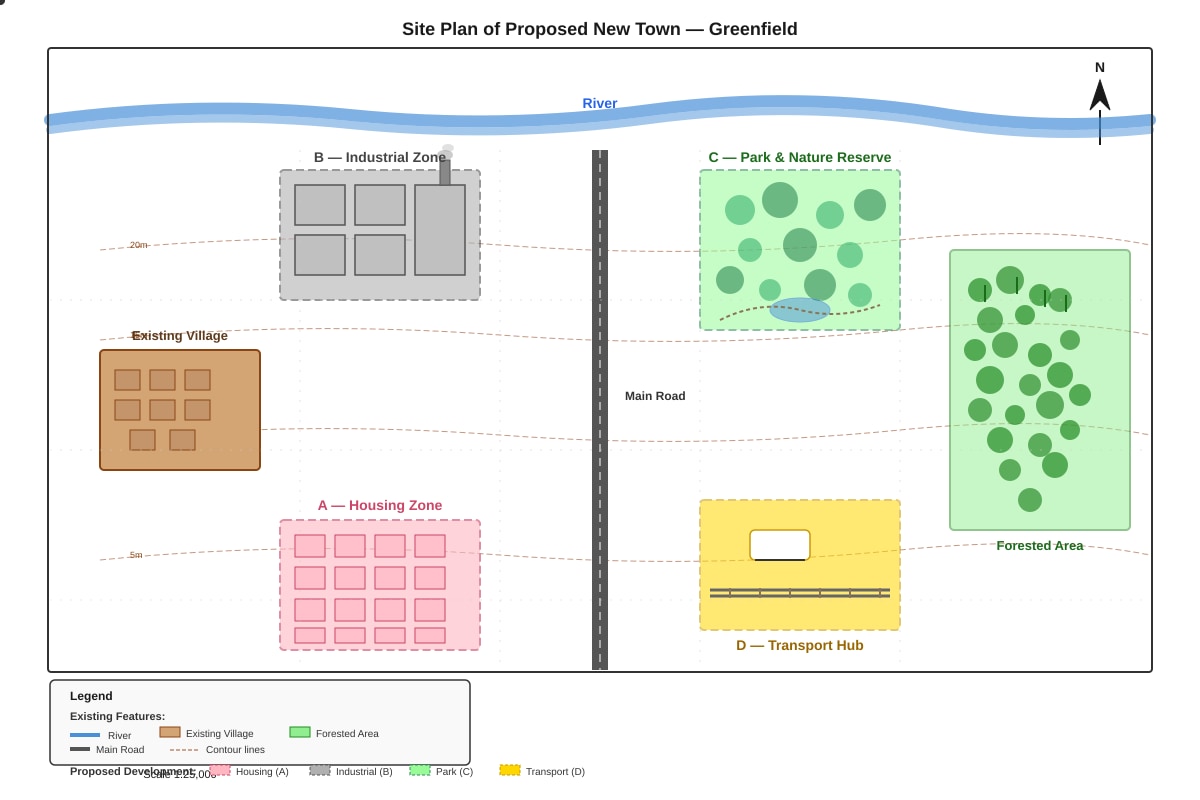
Generated map for Q15.
The planners want Greenfield to be a sustainable town. Evaluate whether the location of each proposed zone supports this aim.
(a) Evaluate the location of the industrial zone (B) in relation to the existing village to the west. [2]
(b) Evaluate the location of the park and nature reserve (C) in relation to the forested area to the east. [2]
Question 16
Study the data about two different countries' water management strategies.
| Feature | Country X (Singapore) | Country Y (Malaysia) |
|---|---|---|
| Annual Rainfall | 2340 mm | 2500 mm |
| Population | 5.7 million | 32 million |
| Land Area | 728 km² | 330,803 km² |
| Main Water Source | Desalination, NEWater, imported water | Surface water (rivers, lakes) |
| Water Demand per person | 150 litres/day | 200 litres/day |
(a) Calculate the total daily water demand for Country X. Show your working. [2]
(b) Despite having less rainfall per person and less land area, Country X faces fewer water shortages than Country Y. Explain two reasons for this, using information from the table and your geographical knowledge. [3]
Question 17
Study the photograph and diagram about coastal management.
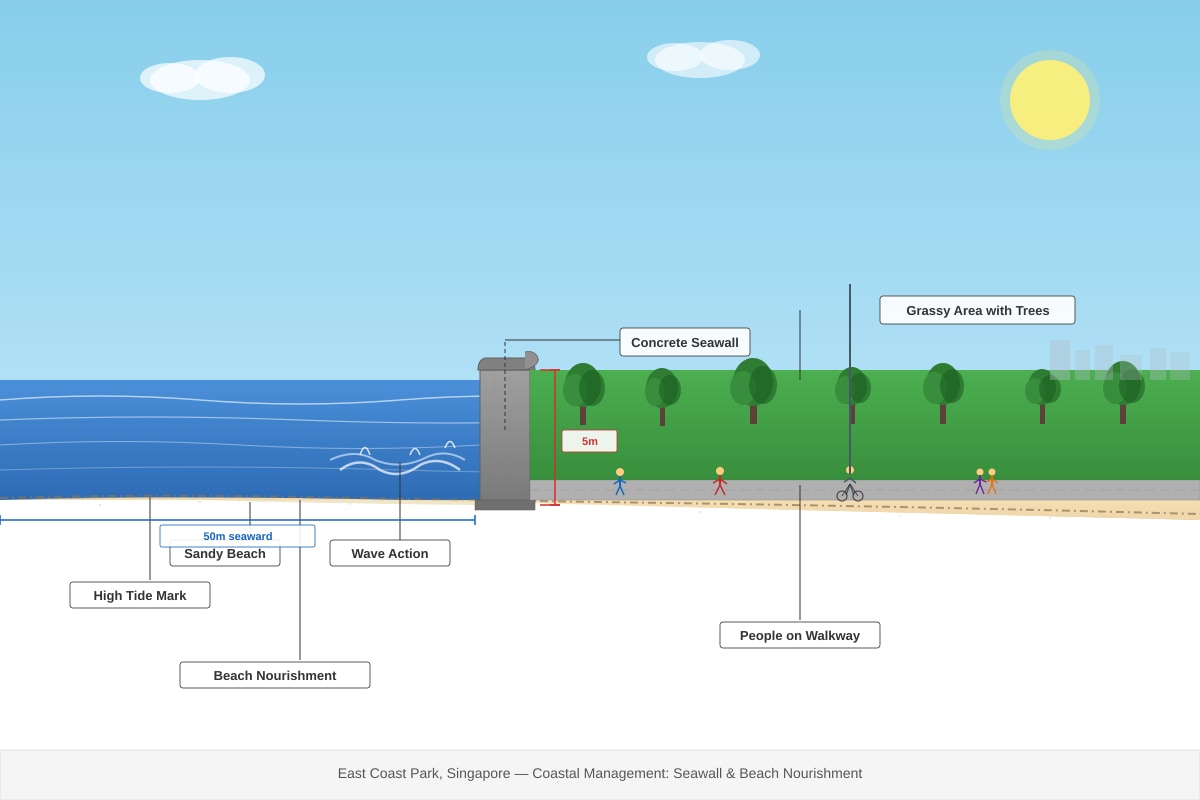
Generated source_image for Q17.
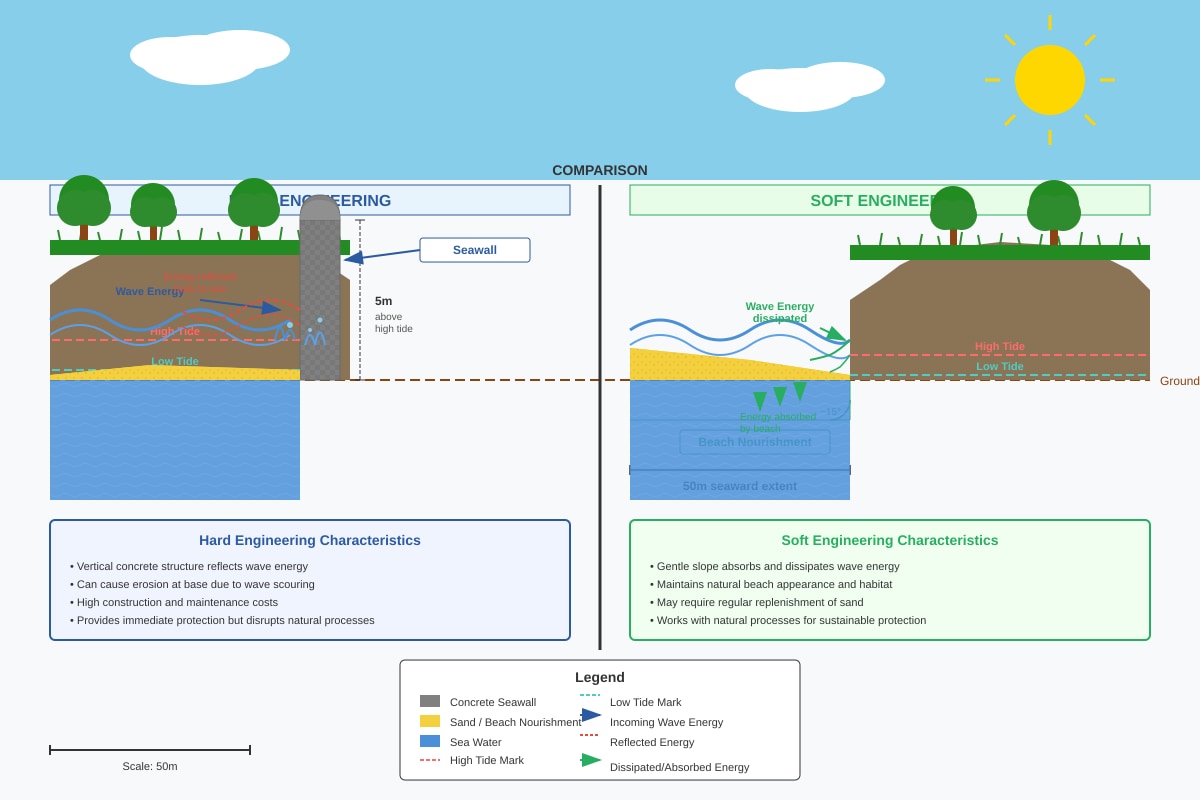
Generated diagram for Q17.
(a) Identify the type of coastal defence shown in the photograph. [1]
(b) Explain one advantage and one disadvantage of using hard engineering methods like the one shown, compared to soft engineering methods. [2]
(c) Suggest why Singapore mainly uses hard engineering for coastal protection. [1]
Question 18
Study the data about urban temperatures in Singapore.
| Location | Day Temperature (°C) | Night Temperature (°C) | Building Density | Vegetation Cover (%) |
|---|---|---|---|---|
| CBD (Raffles Place) | 31.5 | 28.2 | Very High | 5 |
| Residential (Tampines) | 30.2 | 26.5 | Medium | 25 |
| Nature Reserve (Bukit Timah) | 28.0 | 24.5 | Very Low | 95 |
| Industrial (Jurong) | 31.0 | 27.8 | High | 10 |
(a) Describe the relationship between building density and temperature. [2]
(b) Explain two ways vegetation helps to reduce temperatures in urban areas. [2]
(c) Suggest one strategy, other than increasing vegetation, that Singapore could use to reduce urban temperatures. [1]
Section C Total: 15 marks
END OF PAPER
Total Marks: 60
Extra Space
If you need more space, write your answers below. Clearly indicate the question number.
Answers
TuitionGoWhere Practice Paper - Geography Secondary 1
Answer Key and Marking Scheme
Version: 1 of 5
Section A: Map Skills (20 marks)
Question 1 (5 marks)
(a) 1853 [1]
Marking note: Accept 1853 only. Penalise reversed figures (5318) or incorrect easting/northing order. Must be 4 digits.
(b) 215474 [2]
Step-by-step:
- Easting: 21 (first two digits from grid square), estimate 5 tenths across → 215 [1]
- Northing: 47 (first two digits), estimate 4 tenths up → 474 [1]
- Common error: Reversing to 474215 loses both marks. Missing one digit loses 1 mark.
(c) South-east / SE / Southeast [1]
Concept: Direction is measured from the first named place to the second. Use North arrow, place protractor on Hillcrest, measure bearing or use compass points.
Question 2 (4 marks)
(a) Approximately 3.2 km (accept 3.0–3.4 km) [2]
Step-by-step:
- Measure straight-line distance on map with ruler (e.g., 6.4 cm) [1]
- Use scale: 1:50,000 means 1 cm = 0.5 km, or read from scale bar [1]
- Convert: 6.4 × 0.5 = 3.2 km
Acceptable range: 3.0–3.4 km depending on precise measurement.
(b) Main Road 1 follows a curved/winding route around physical features (hills, river) / road is not straight / road must follow contours [2]
Marking points: [1] for identifying road is not straight; [1] for explaining why (physical obstacles, following contours, serving settlements along the way). Accept "road winds around the coast" or similar.
Question 3 (4 marks)
(a) Vertical exaggeration = 5× (accept 5 or 5 times) [2]
Step-by-step:
- Vertical scale: 1 cm = 10 m (from graph: 1 cm represents 10 m) [0.5]
- Horizontal scale: 1 cm = 0.5 km = 500 m = 50,000 cm, so 1:50,000 [0.5]
- Or: horizontal scale 1:50,000; vertical scale 1:10,000 (10m in cm terms for direct comparison)
- Vertical exaggeration = (vertical scale fraction) ÷ (horizontal scale fraction) = 50,000/10,000 = 5 [1]
Alternative working: If vertical scale is 1 cm to 10 m and horizontal is 1 cm to 500 m, then 500/10 = 50... this needs careful handling. The standard method: convert scales to ratios (1:1000 for vertical, 1:50,000 for horizontal doesn't work directly). Better approach: Express both as representative fractions with same units.
- Vertical: 1 cm = 10 m = 1000 cm → 1:1000
- Horizontal: 1 cm = 500 m = 50,000 cm → 1:50,000
- VE = (1/1000) ÷ (1/50,000) = 50,000/1,000 = 50? No, this is incorrect.
Correction: Actually for cross-sections, vertical exaggeration is typically calculated as: VE = (Vertical scale horizontal equivalent) / (Horizontal scale horizontal equivalent), but the standard geography method is:
- If horizontal scale is 1:50,000 and vertical is 1:10,000, then VE = 50,000/10,000 = 5.
- This gives VE = 5. [1]
Teaching note: Vertical exaggeration makes small relief features visible. It = (denominator of horizontal RF) ÷ (denominator of vertical RF) when both are expressed as representative fractions.
(b) Valley / River valley / V-shaped valley [1]
Identification: Point B shows lower elevation with higher ground on either side, indicating a valley through which the river flows.
(c) Flat land / gentle slope / near water source / fertile soil from river deposits [1]
Any one valid: Proximity to water for irrigation, alluvial soil deposits, flatter land easier to cultivate.
Question 4 (5 marks)
(a) May [1]
(28.5°C)
(b) 2228 mm [2]
Step-by-step:
- Add all monthly values: 234 + 112 + 170 + 155 + 171 + 132 + 154 + 148 + 177 + 198 + 258 + 319 [1]
- = 2228 mm [1]
Allow 1 mark for correct method with minor addition error.
(c) Pattern description [2]
Marking points:
- [1] Bimodal pattern / two peaks / generally high rainfall throughout the year with no month below 100mm
- [1] Peaks in November–January and lower period in June–July specifically / wettest in December (319mm), driest in February (112mm) but still substantial
Expected answer: Rainfall is generally high all year but shows two peaks — one around November–December (monsoon season) and lower amounts in early-mid year. The wettest months are November to January; the "driest" month (February) still has over 100mm.
Question 5 (3 marks)
(a) Equatorial climate / Tropical rainforest climate [1]
(b) Two pieces of evidence [2]
Marking points — any two from:
- [1] High temperature throughout: 26–28°C consistently / small annual range (less than 2°C between hottest and coolest)
- [1] High rainfall every month: no month below approximately 150mm / all months wet
- [1] Total annual rainfall exceeds 2000mm (accept calculation if shown: approx 2500+ mm)
- [1] No distinct dry season / rainfall evenly distributed or with slight peaks but consistently heavy
Question 6 (3 marks)
(a) Emergent layer [1]
(b) Two adaptations [2]
Marking points:
- [1] Broad, waxy/drip-tip leaves allow water to run off quickly / prevent waterlogging and fungal growth
- [1] Buttress roots provide stability in shallow, wet soils / support tall growth in nutrient-poor conditions
- [1] Lianas climb to reach sunlight in dense canopy / rapid growth to access light
Any two distinct adaptations with explanations accepted. Must link to high rainfall specifically.
Question 7 (4 marks)
(a) 40% [2]
Step-by-step:
- Urban population ÷ Total population × 100 [1]
- = 52 ÷ 130 × 100 = 0.4 × 100 = 40% [1]
Common error: Forgetting ×100 gives 0.4 (no mark for final answer).
(b) Country A [1]; 90% urban (45/50) is highest percentage [1]
Step-by-step:
- Country A: 45/50 = 90%
- Country B: 40% (from a)
- Country C: 5/25 = 20%
- Country D: 56/80 = 70%
Country A has highest proportion/percentage, not necessarily highest absolute number. [2]
Question 8 (3 marks)
(a) 40% [1]
25% + 15% = 40%
(b) Two reasons [2]
Marking points:
- [1] Limited land area: Singapore is small (728 km²), so land is prioritised for housing and industry
- [1] Most food is imported rather than grown locally / urban economy focuses on services and manufacturing not agriculture
- [1] High cost of agricultural land / more profitable uses for land
- [1] Climate constraints / focus on high-tech urban farming rather than traditional agriculture
Section A Total: 20 marks
Section B: Data Analysis and Interpretation (25 marks)
Question 9 (4 marks)
(a) River R [1]; lowest turbidity (8 NTU), highest dissolved oxygen (9.0 mg/L), lowest BOD (1 mg/L), pH closest to neutral-alkaline healthy range [1]
Reasoning: Clean water requires high dissolved oxygen ( aquatic life), low turbidity (clear water), low BOD (little organic pollution), pH 6.5–8.5. River R meets all criteria best. River Q and S show pollution indicators.
(b) Two effects [2]
Marking points:
- [1] Lowers dissolved oxygen: organic waste decomposes, using up oxygen / BOD increases
- [1] Increases turbidity: suspended solids from industrial processes cloud the water
- [1] Alters pH: acidic or alkaline chemicals change pH outside safe range
- [1] Toxic substances may directly harm aquatic life
Any two distinct effects with correct link to measurements.
Question 10 (4 marks)
(a) 33 m above sea level; July [1]
Both required for mark.
(b) Range = 44 − 33 = 11 m [1]
(c) Two reasons [2]
Marking points:
- [1] July is within drier period / Southwest Monsoon / less rainfall than other months
- [1] Higher evaporation due to strong sunshine / higher temperatures
- [1] Increased water usage for irrigation/cooling during hot period
- [1] Less storm events / no major rain-carrying weather systems
Must relate to Singapore's climate context.
Question 11 (4 marks)
(a) Positive correlation / direct relationship [1]; as rainfall increases, river discharge generally increases [1]
More detail: Generally strong positive — when rainfall is 100–300mm, discharge rises from 5 to ~40 cumecs. Not perfect due to outlier.
(b) Possible reasons for outlier [1]
- Heavy rainfall after long dry period / ground very dry so infiltration high, runoff low
- Rain fell in area not contributing to this river catchment
- Man-made interference (dam release, water abstraction)
- Time lag: rain fell at end of month, peak flow next month not shown
Any reasonable geographical explanation.
(c) Shows pattern/trend clearly / helps identify relationships between two continuous variables / can see strength and direction of correlation [1]
Question 12 (4 marks)
(a) Central [1]
(b) Two reasons [2]
Marking points:
- [1] Economic opportunities: jobs in CBD/services/financial sector attract people
- [1] Better infrastructure and amenities: transport, schools, healthcare
- [1] Historical development: city grew from this centre
- [1] Accessibility: transport hub, port location
(c) Disadvantage [1]
- Shows average for whole region / masks internal variation / different densities within same colour zone
- Arbitrary boundaries create artificial steps / small areas of extreme density hidden
- Doesn't show actual population numbers, only density categories
Question 13 (4 marks)
| Letter | Process | Mark |
|---|---|---|
| A | Evaporation | [1] |
| B | Transpiration | [1] |
| C | Condensation | [1] |
| D | Precipitation | [1] |
Teaching note: These are key flows in the hydrological cycle. A = water heated by sun becomes vapour from ocean; B = plants release water through leaves; C = water vapour cools and forms droplets; D = water falls as rain/snow.
Question 14 (5 marks)
(a) Two changes with data [2]
Marking points — any two from:
- [1] Natural gas increased from 78% to 95% (increase of 17 percentage points)
- [1] Oil decreased significantly from 20% to 3% (decrease of 17 percentage points)
- [1] Coal remained constant at 1%
- [1] Solar remained very small at 1%
(b) One reason [1]
- Natural gas burns cleaner than oil/coal (lower carbon emissions per unit energy)
- More reliable supply / secure domestic processing capability
- Singapore has infrastructure for natural gas import and processing
- Regional availability and pipeline/delivery infrastructure
(c) Two strategies [2]
Marking points:
- [1] Increase solar power deployment / expand solar panel installation on rooftops and reservoirs
- [1] Invest in regional renewable energy imports / regional power grid
- [1] Improve energy efficiency / demand reduction through technology and building standards
- [1] Research and develop other renewables (tidal, geothermal, hydrogen)
- [1] Expand NEWater and waste-to-energy programmes
Section B Total: 25 marks
Section C: Application and Evaluation (15 marks)
Question 15 (4 marks)
(a) Evaluation of industrial zone B [2]
Marking points:
Positives:
- [1] Located away from residential village to west / reduces noise/air pollution impact on residents
- [1] Access to main road for transport of goods
Negatives:
- [1] If prevailing wind from west, pollution may still reach village
- [1] River to north may receive industrial runoff if not properly managed
Balanced evaluation expected for full marks. Must mention sustainability implication.
(b) Evaluation of park/nature reserve C [2]
Marking points:
Positives:
- [1] Adjacent to existing forested area / extends green corridor / maintains habitat connectivity
- [1] Preserves biodiversity / natural drainage / reduces urban heat island effect
Negatives:
- [1] Takes land that could be used for housing/industry (opportunity cost)
- [1] May fragment if not properly connected
Full marks for balanced assessment with sustainability focus.
Question 16 (5 marks)
(a) 855 million litres / 855,000 m³ [2]
Step-by-step:
- Total daily demand = population × per person demand [1]
- = 5,700,000 × 150 litres = 855,000,000 litres = 855 million litres [1]
- Or: 5.7 million × 150 = 855 million litres
Units not required for marks but good practice.
(b) Two reasons with explanation [3]
Marking points:
Reason 1: Technology and investment in water supply [2 max]
- [1] Country X (Singapore) has invested heavily in advanced water treatment (NEWater, desalination)
- [1] These technologies reduce dependence on rainfall and natural surface water / create "four national taps" for security
Reason 2: Efficiency and demand management [2 max]
- [1] Lower per capita water demand (150 vs 200 litres/day) through conservation and efficient use
- [1] Despite smaller land area, intensive infrastructure and management overcomes natural limitations
Reason 3: Economic capacity [2 max]
- [1] Higher GDP per capita enables investment in expensive water technology
- [1] Country Y has more land and rain but less capacity to store/treat/distribute effectively
Full marks require explicit comparison and use of table data plus geographical reasoning.
Question 17 (4 marks)
(a) Seawall / Hard engineering / Revetment (accept seawall specifically) [1]
(b) Advantage and disadvantage [2]
Advantage [1]: Immediate, strong protection against storm waves / long-lasting structure / prevents erosion behind wall / protects valuable land
Disadvantage [1]: Expensive to build and maintain / reflects wave energy causing scour at base / can fail catastrophically if undermined / unnatural appearance / prevents beach accumulation / damages ecosystem
Comparison to soft engineering required in explanation for full marks.
(c) Reason for hard engineering preference [1]
- Limited land area / high population density requires maximum protection
- Valuable infrastructure (airport, industry, housing) behind coast needs guaranteed protection
- Soft engineering takes more space that Singapore doesn't have
- Greater control and predictability for dense development
Question 18 (5 marks)
(a) Relationship [2]
Marking points:
- [1] As building density increases, temperature increases (positive correlation)
- [1] Data support: CBD very high density, highest temperatures (31.5°C day, 28.2°C night); nature reserve very low density, lowest temperatures (28.0°C day, 24.5°C night)
Must use data for second mark.
(b) Two ways vegetation reduces temperature [2]
Marking points:
- [1] Shade / intercepts solar radiation, reducing ground heating
- [1] Transpiration / evapotranspiration releases water vapour, cooling surrounding air
- [1] Reduces urban heat island effect by replacing heat-absorbing surfaces
- [1] Wind channels through vegetation create cooling breezes
(c) One strategy [1]
- Cool/coloured roofing materials / green roofs
- Building orientation for ventilation / wind corridors
- Water features / fountains for evaporative cooling
- Reduce energy consumption / less waste heat from buildings
- Use of permeable surfaces to reduce heat retention
Section C Total: 15 marks
Total Marks: 60
END OF ANSWER KEY
Free quiz and exam paper access
Enter your details to view this paper
Your access is remembered on this device.