From Real Exams Exam Paper
Secondary 1 Geography Semestral Assessment 2 (End of Year) Paper 1
Free Sec 1 Geography SA2 Paper 1, HY3 Exam version, with questions, answers, and syllabus-aligned practice for Singapore students.
These static practice materials are generated from the site's syllabus and paper-generation workflow, with source and model context shown so students and parents can evaluate the material before use.
Questions
TuitionGoWhere Exam Practice (AI) — Secondary 1 Geography SA2 Practice Paper
School: TuitionGoWhere Secondary School (AI)
Subject: Geography
Level: Secondary 1
Paper: SA2 Practice Paper (Version 1 of 5)
Duration: 60 minutes
Total Marks: 60
Name: ___________________________
Class: ________
Date: ____________
Instructions
- Answer all questions in the spaces provided.
- This paper tests Map, Graph & Data Skills only.
- Use the maps, tables, and figures provided. Read axes, labels, and grid lines carefully.
- Section marks are shown at the end of each section. Question marks add up to the Total Marks.
Section A: Map Reading (20 marks)
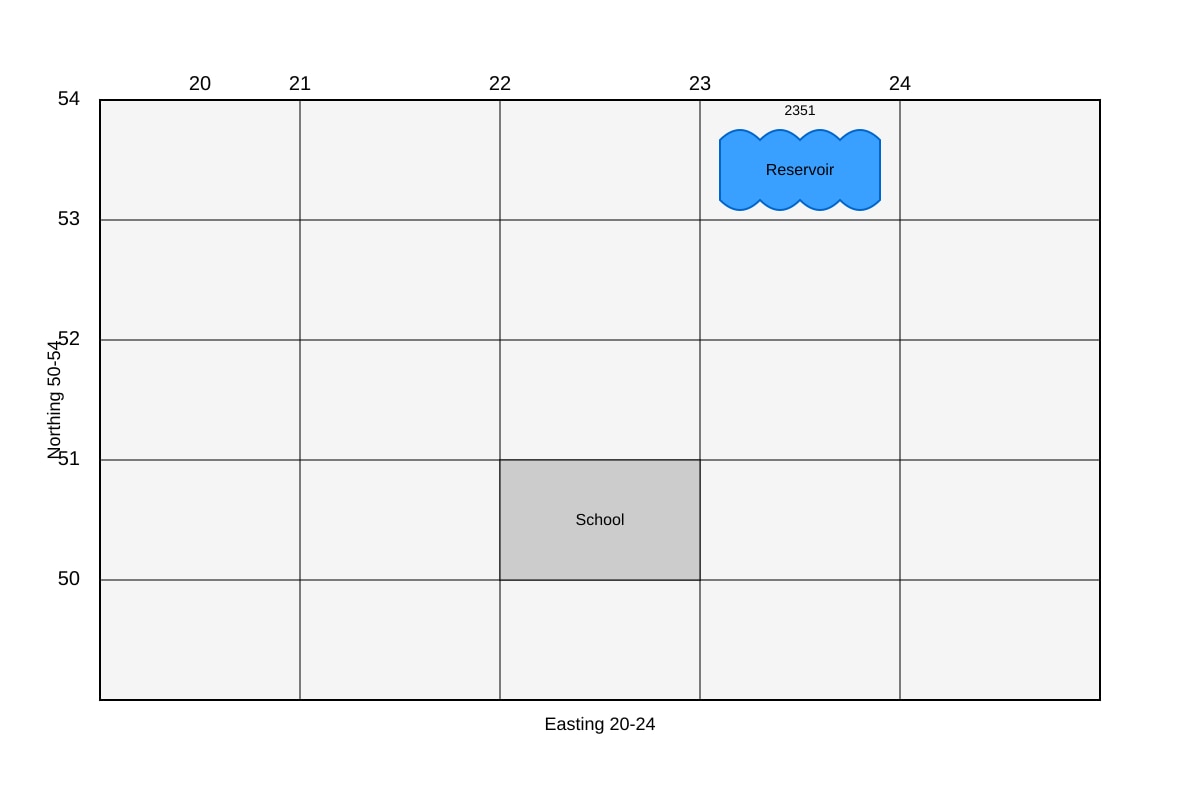
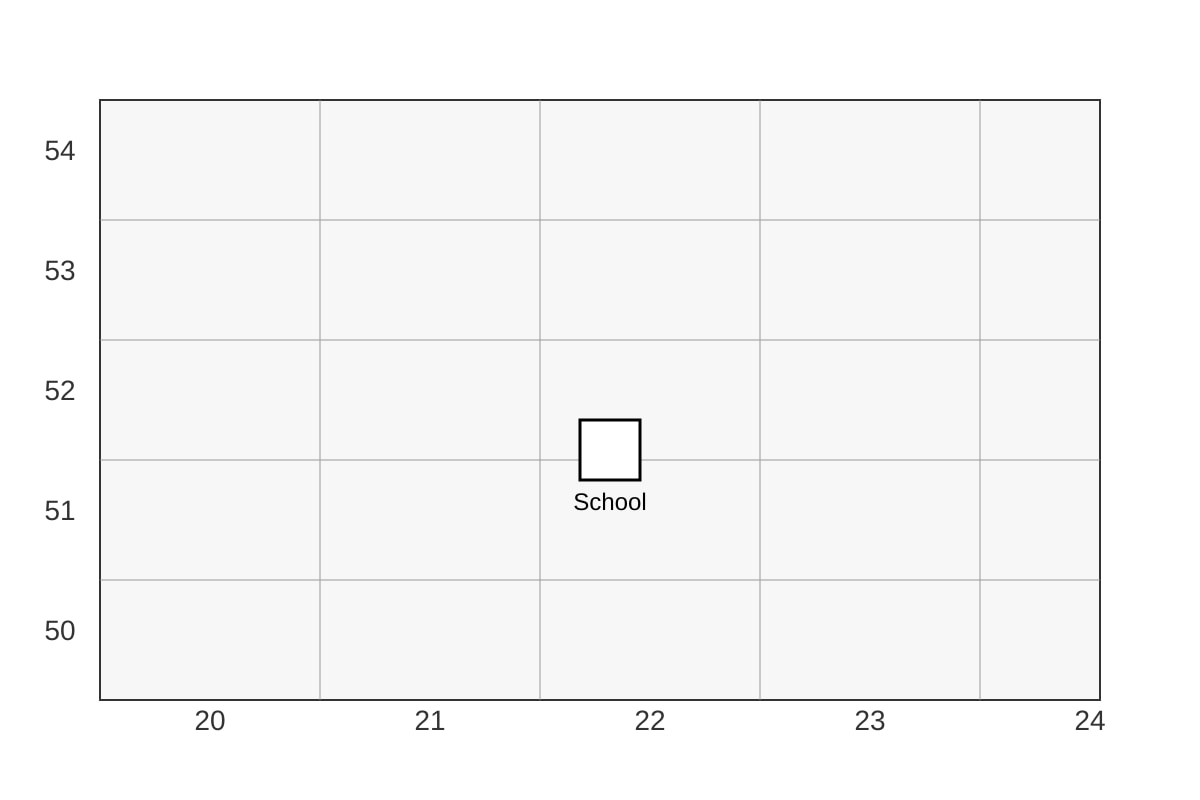
1. Study the map extract below. State the four-figure grid reference of the school. [1]
Image pending generation: map for Q1.
2. State the four-figure grid reference of the reservoir shown on the map extract. [1]
Image pending generation: map for Q2.
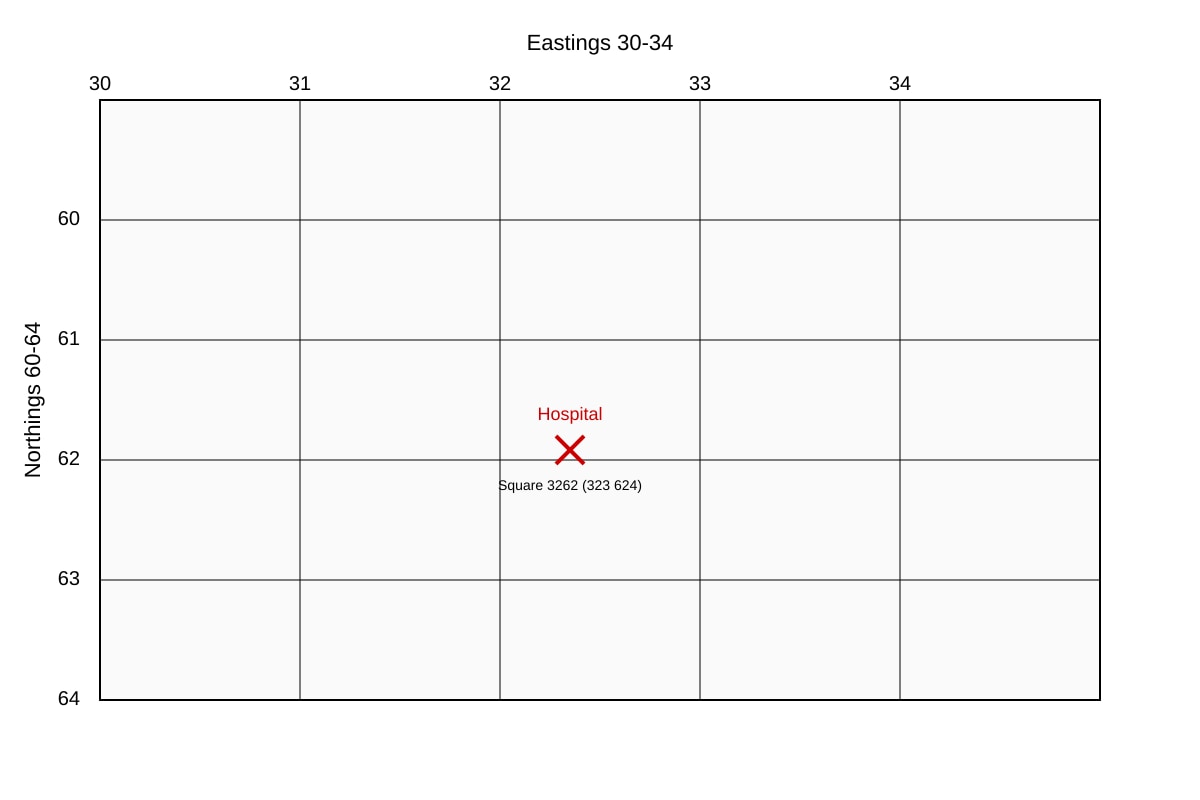
3. Give the six-figure grid reference of the hospital marked on the map. [1]
Image pending generation: map for Q3.
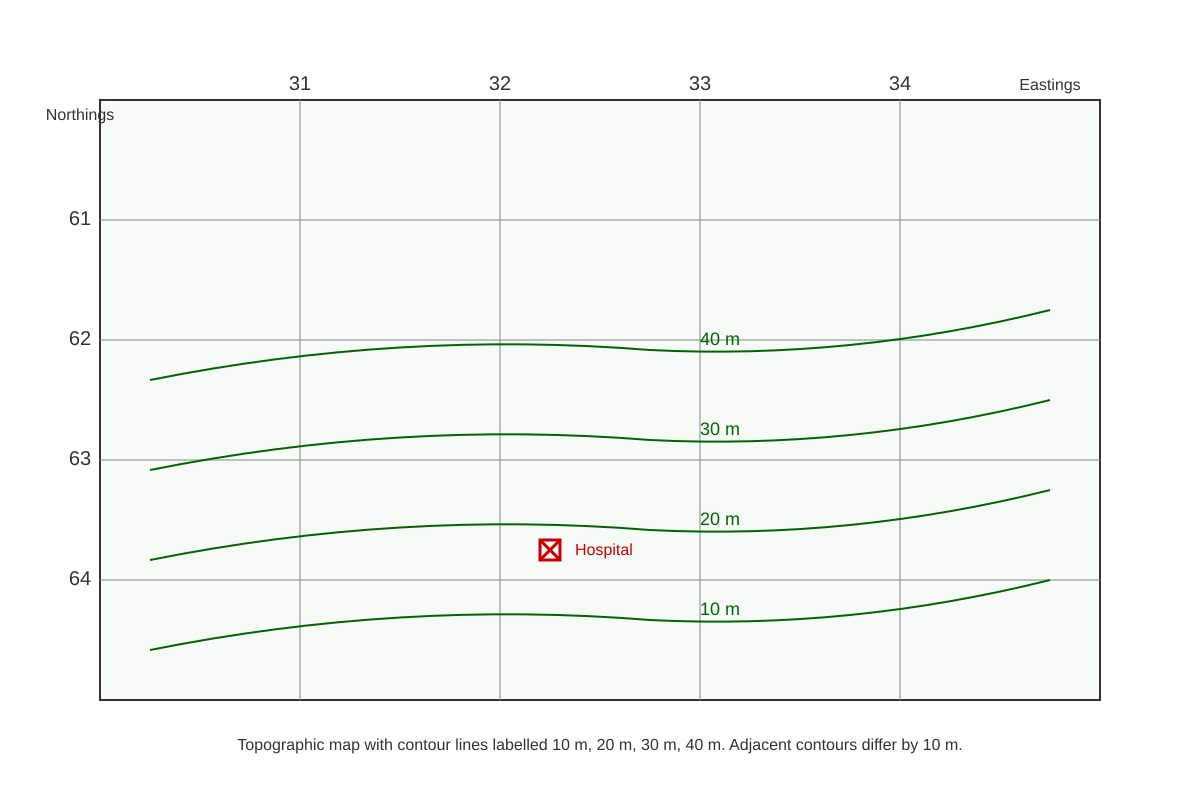
4. State the contour interval of the map shown. [1]
Image pending generation: map for Q4.
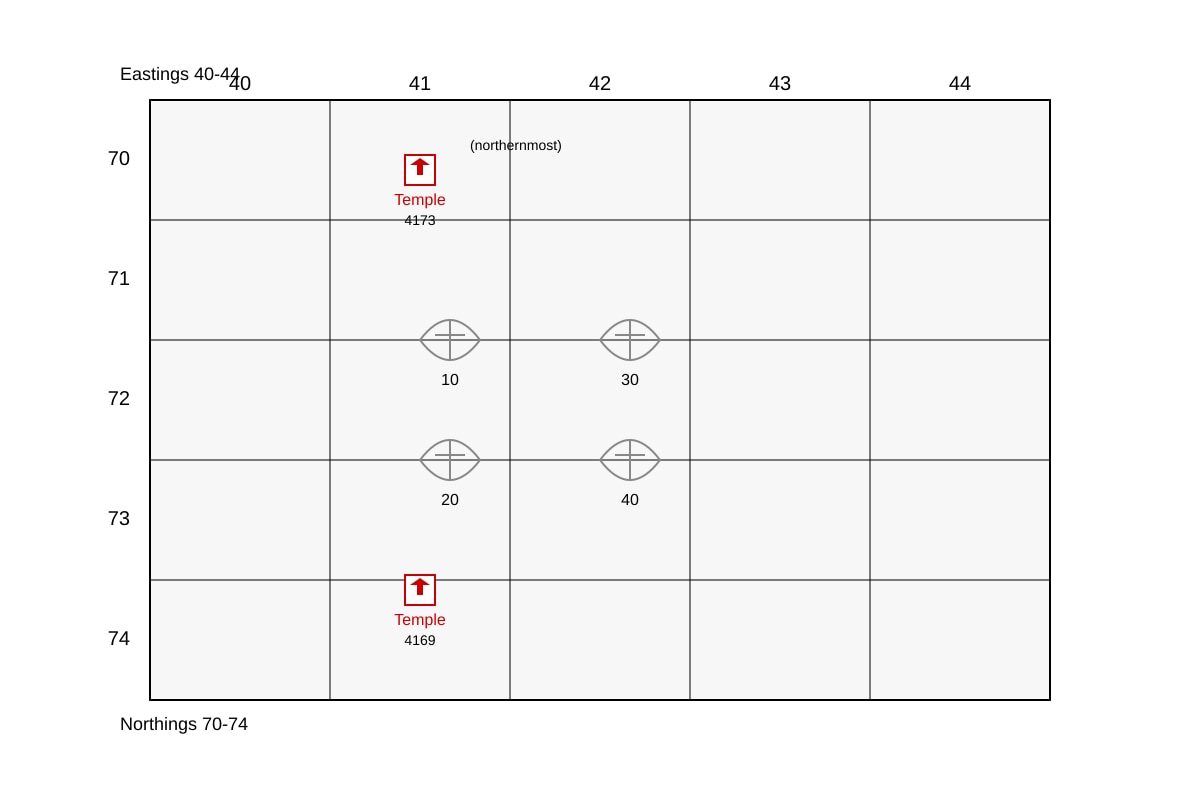
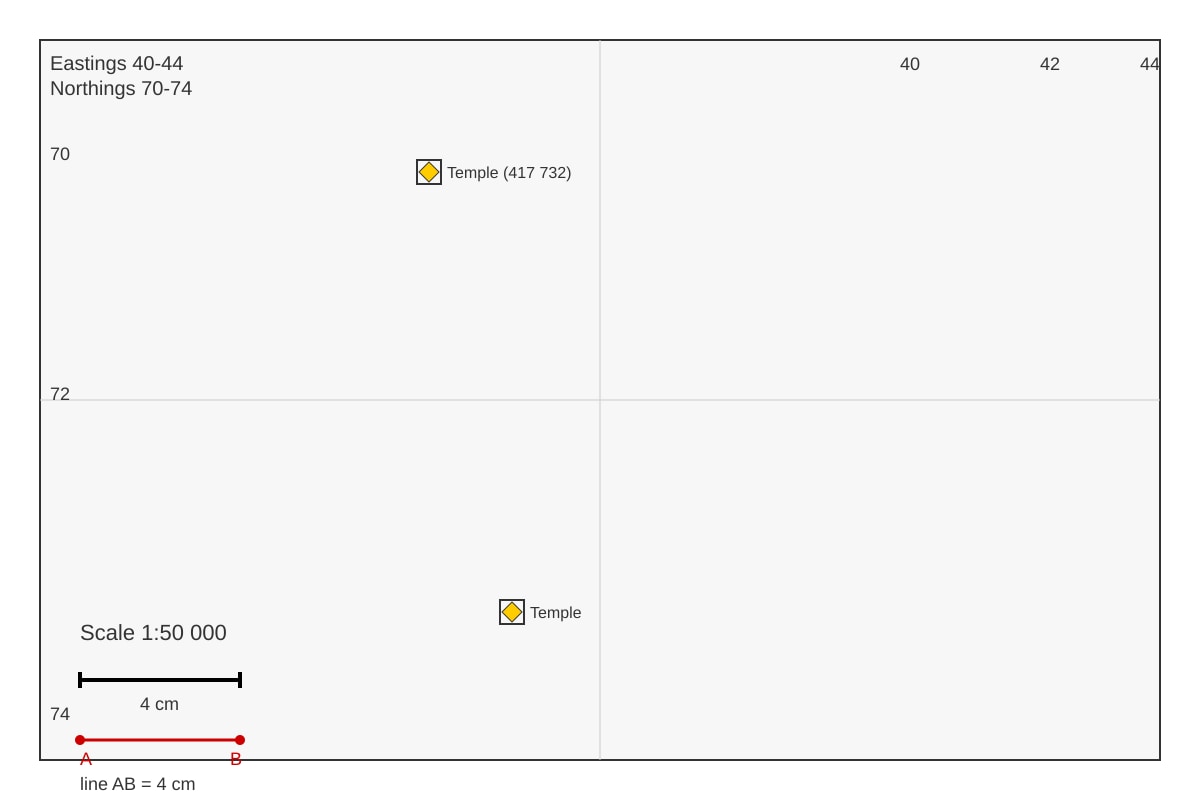
5. State the six-figure grid reference of the northernmost temple on the map. [1]
Image pending generation: map for Q5.
6. The map scale is 1:50 000. What distance on the ground does 4 cm on the map represent? Give your answer in kilometres. [2]
Image pending generation: map for Q6.
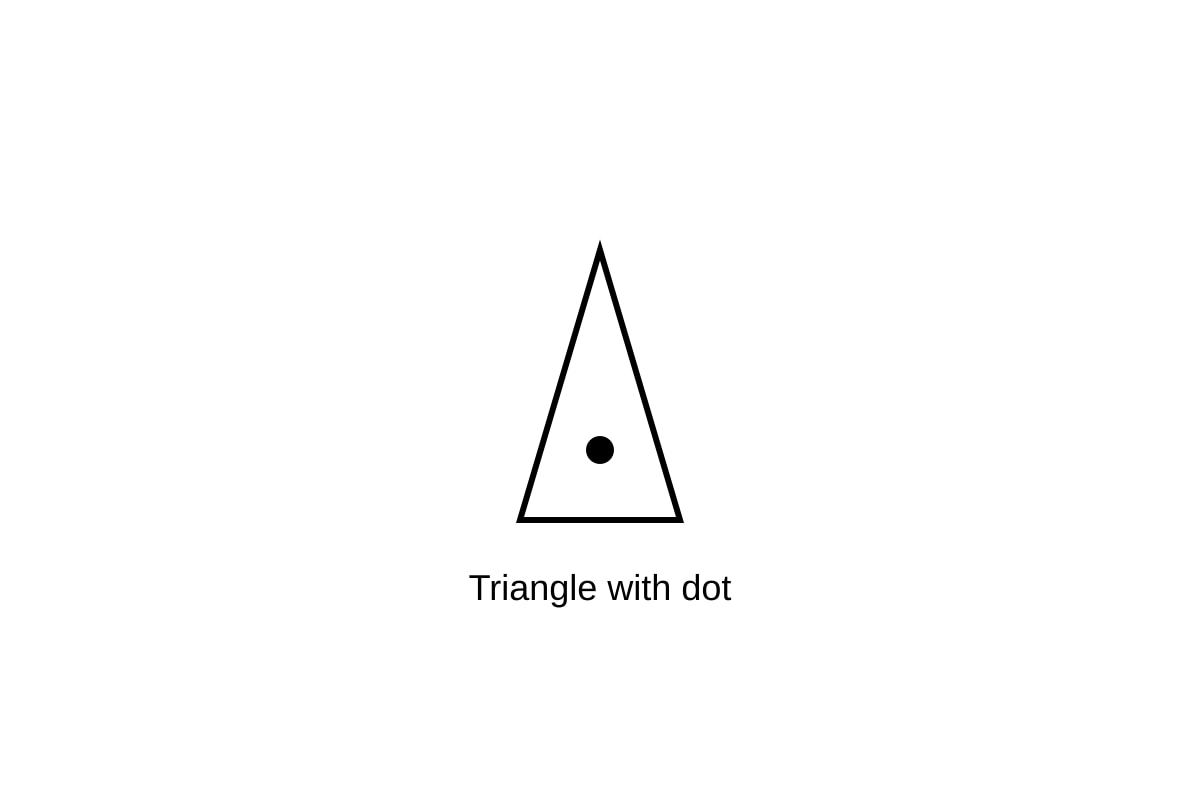
7. Name the map symbol shown below. [1]
Image pending generation: figure for Q7.
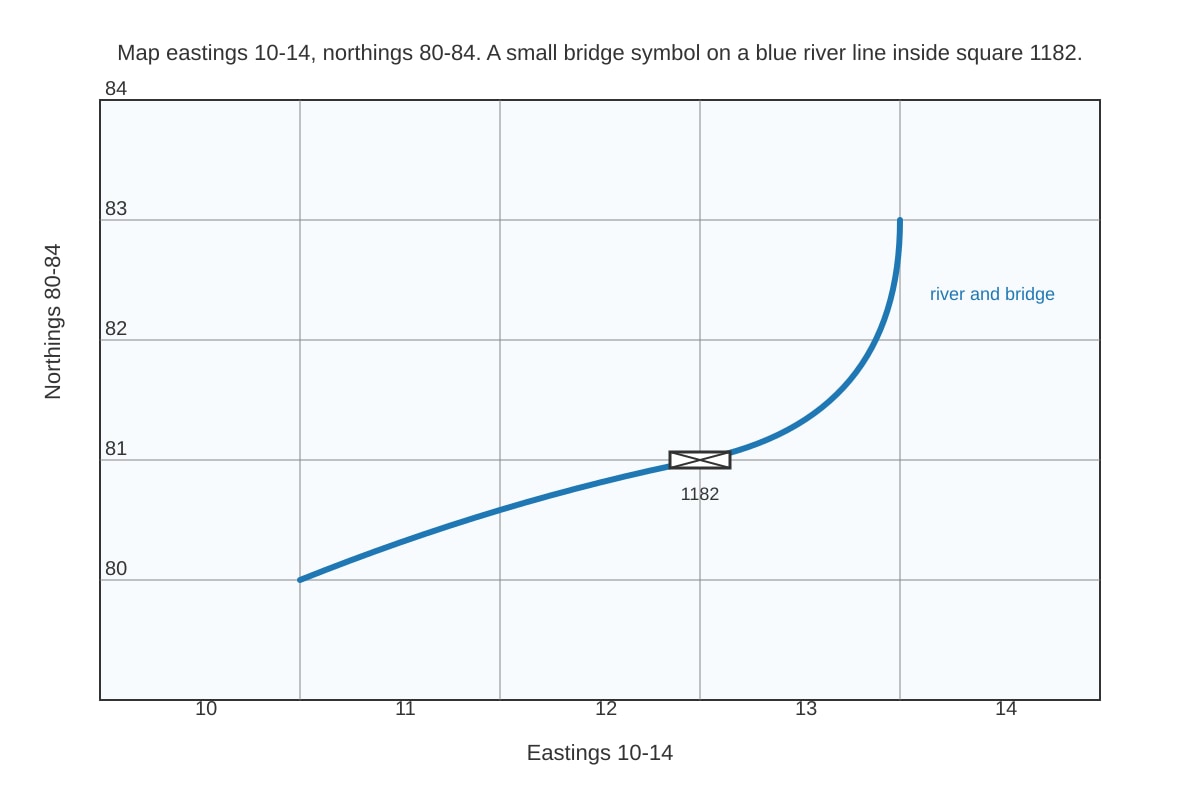
8. State the four-figure grid reference of the bridge crossing the river. [1]
Image pending generation: map for Q8.
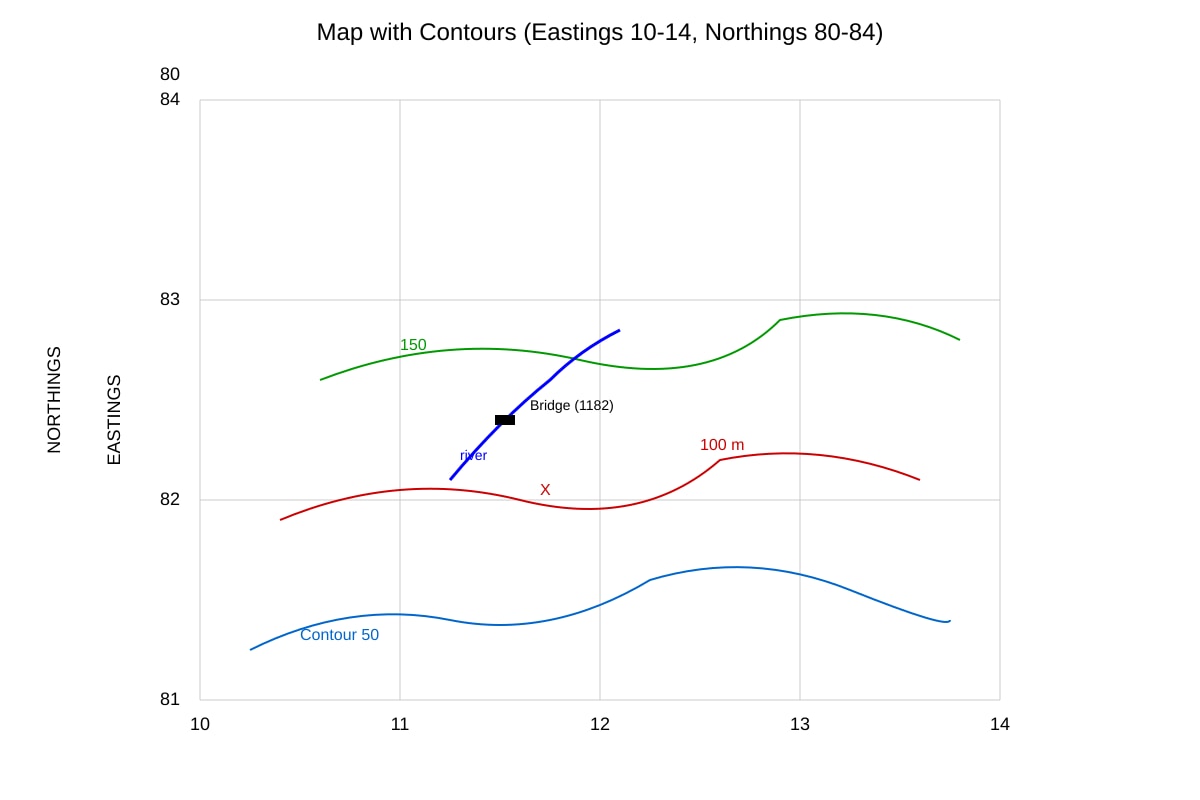
9. What is the height of the contour line marked X on the map? [1]
Image pending generation: map for Q9.
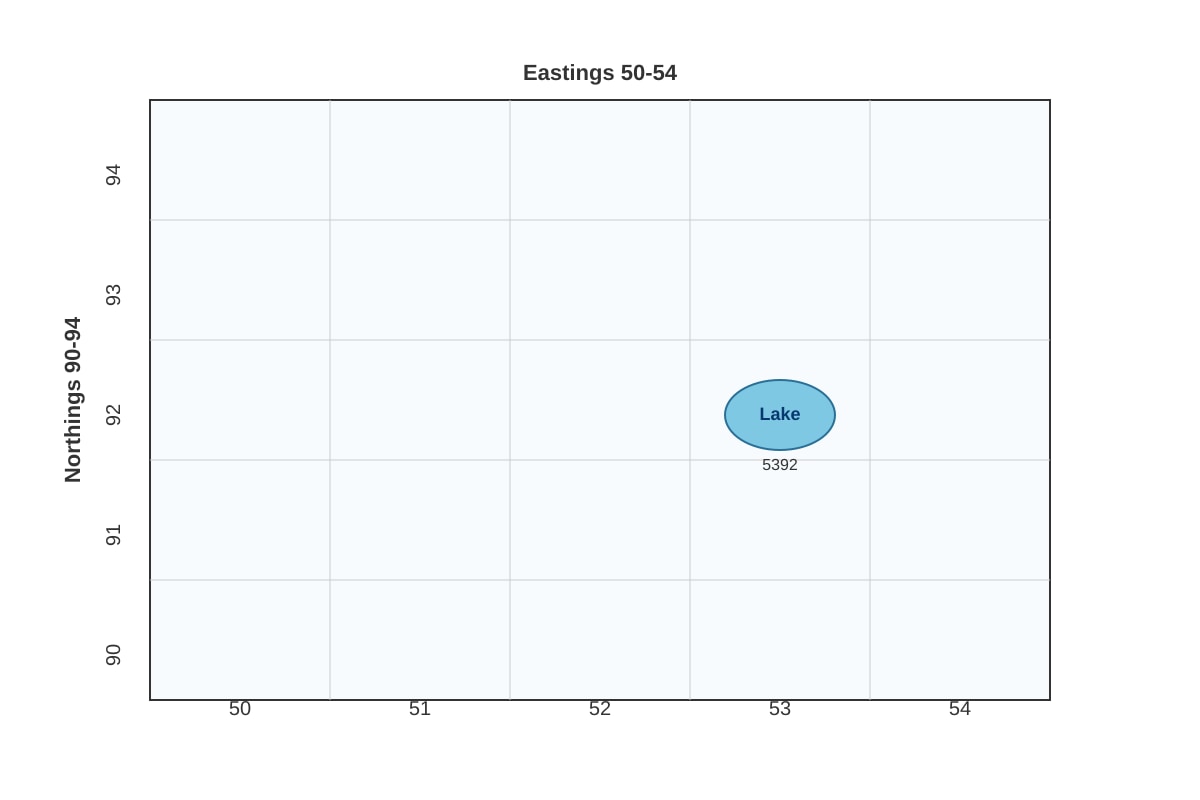
10. A student says the grid reference of the lake is 5398. Explain why this is wrong and give the correct four-figure reference. [2]
Image pending generation: map for Q10.
Section A Total: 20 marks
Section B: Graph & Table Interpretation (20 marks)
11. Study the table below showing rainfall in Town P.
| Month | Jan | Feb | Mar | Apr | May | Jun |
|---|---|---|---|---|---|---|
| Rainfall (mm) | 20 | 35 | 50 | 80 | 120 | 90 |
State the month with the highest rainfall. [1]
12. Using the table in Q11, calculate the mean rainfall from January to June. [2]
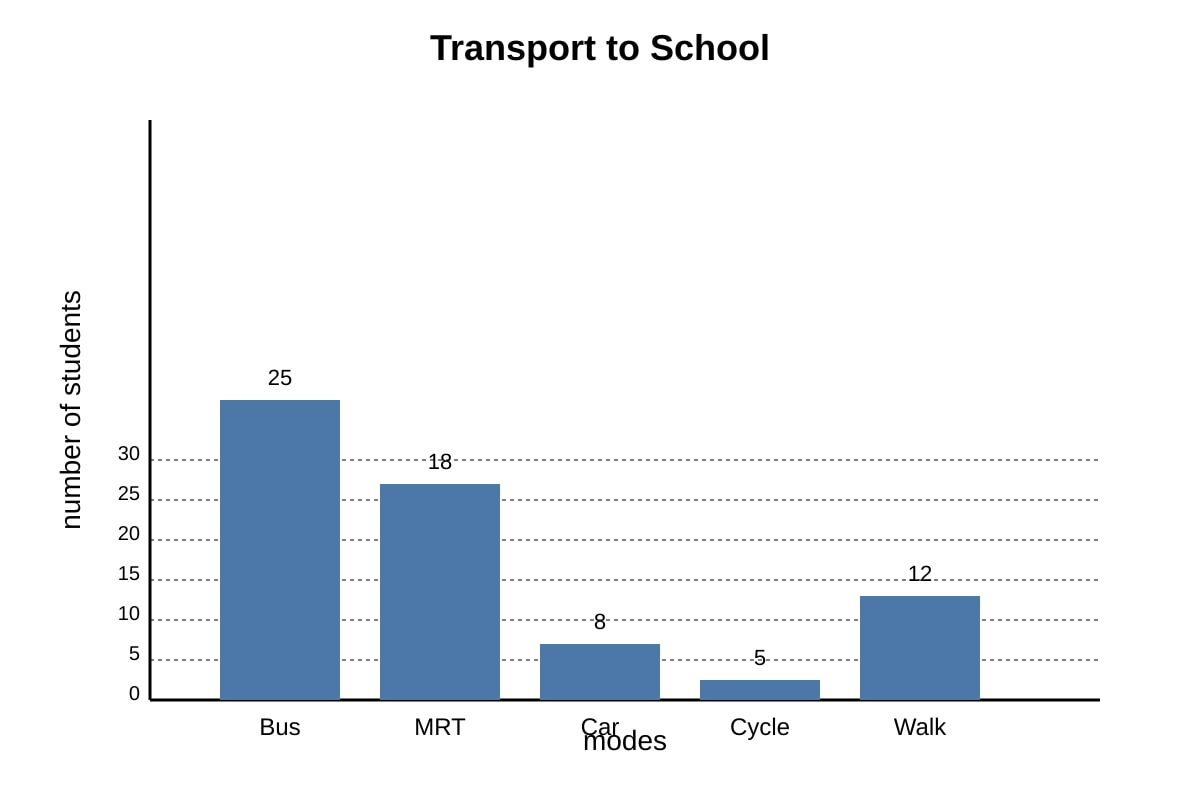
13. Study the bar graph of student transport modes below. State two modes used by fewer than 10 students. [2]
Image pending generation: graph for Q13.
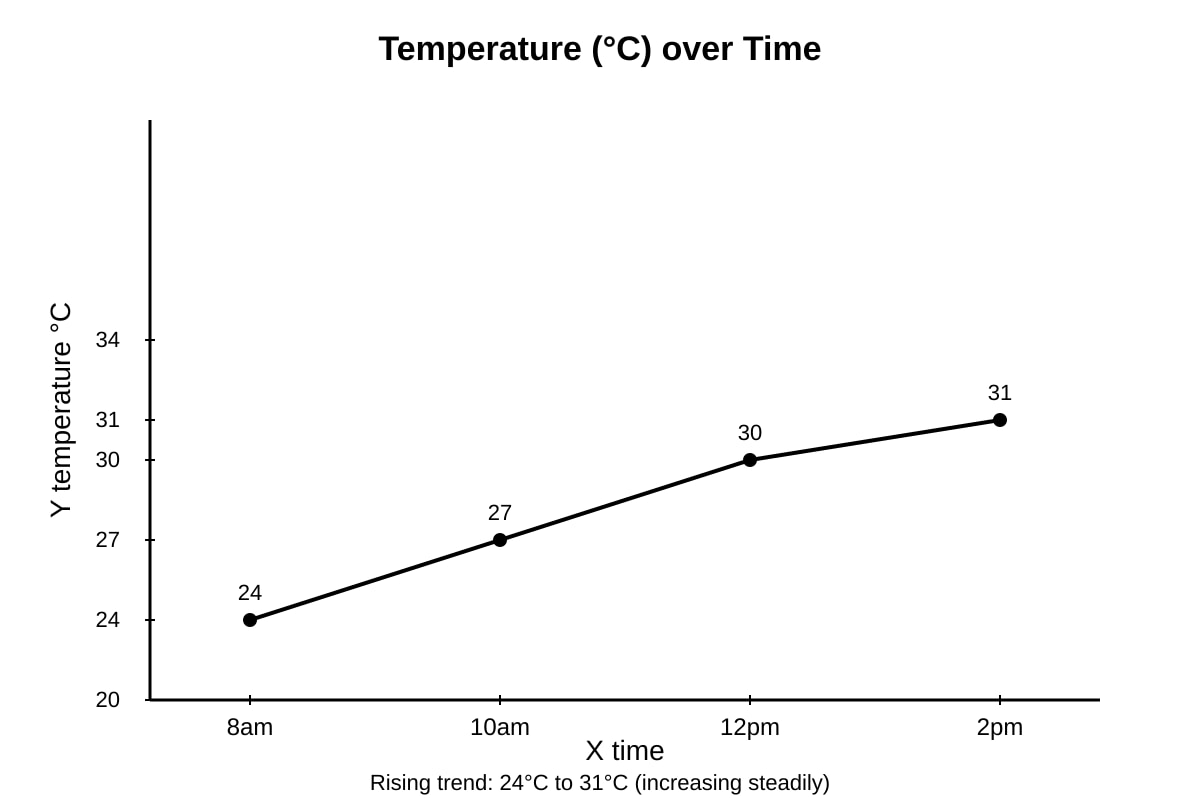
14. With reference to the line graph of temperature below, describe the temperature trend from 8 am to 2 pm. [3]
Image pending generation: graph for Q14.
15. The table shows water use in litres per person per day.
| Use | Amount (L) |
|---|---|
| Shower | 40 |
| Toilet | 25 |
| Cooking | 10 |
| Washing | 30 |
What percentage of total use is toilet? [2]
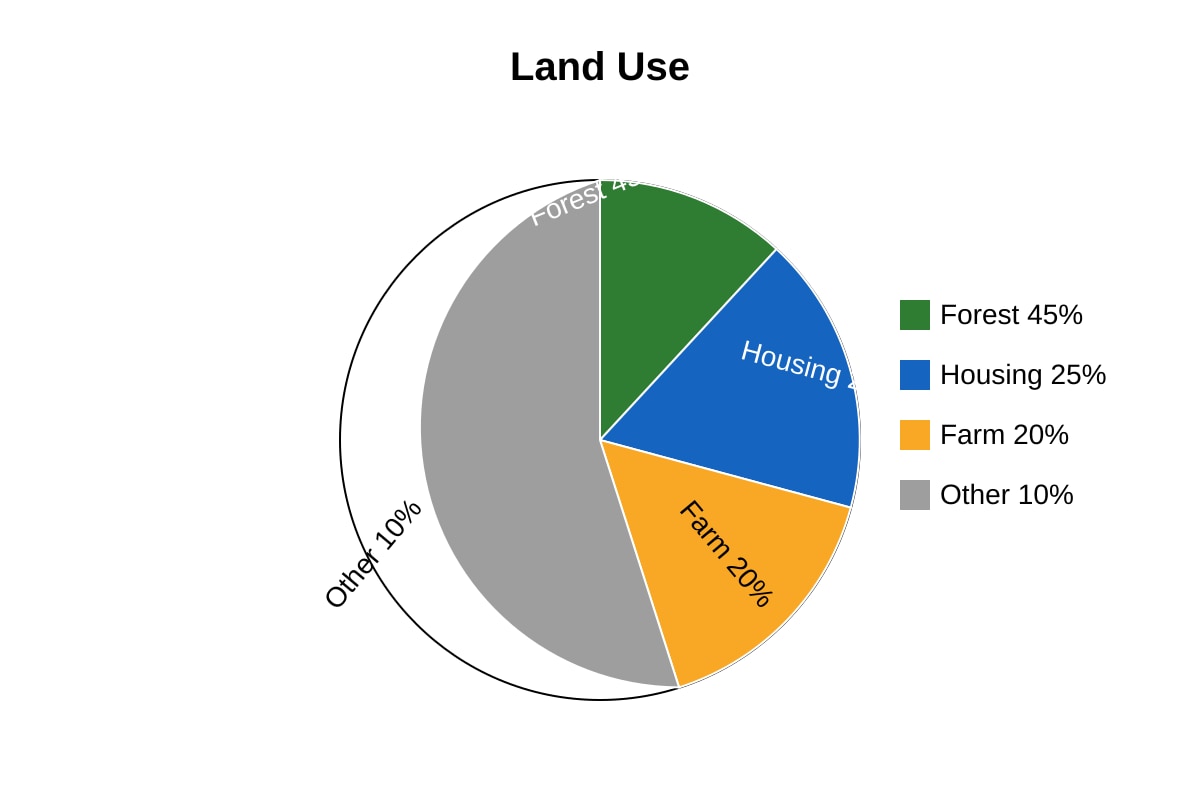
16. Study the pie chart of land use below. Name the largest category. [1]
Image pending generation: chart for Q16.
17. From the graph in Q14, what is the temperature difference between 8 am and 2 pm? [1]
18. A table shows river depth at two sites: Site A 2.0 m, Site B 0.8 m. Which site is likely deeper? Give a reason using the data. [2]
19. Study the table of population below.
| Year | 2010 | 2015 | 2020 |
|---|---|---|---|
| Population (000) | 100 | 130 | 160 |
Describe the population change. [3]
20. Using the data in Q19, calculate the percentage increase from 2010 to 2020. [3]
Section B Total: 20 marks
Section C: Data Application (20 marks)
21. A class tested water quality at two sites. Table below:
| Site | Turbidity (NTU) | Dissolved O₂ (mg/L) |
|---|---|---|
| X | 5 | 8 |
| Y | 15 | 4 |
Which site has better water quality? Explain with two data points. [3]
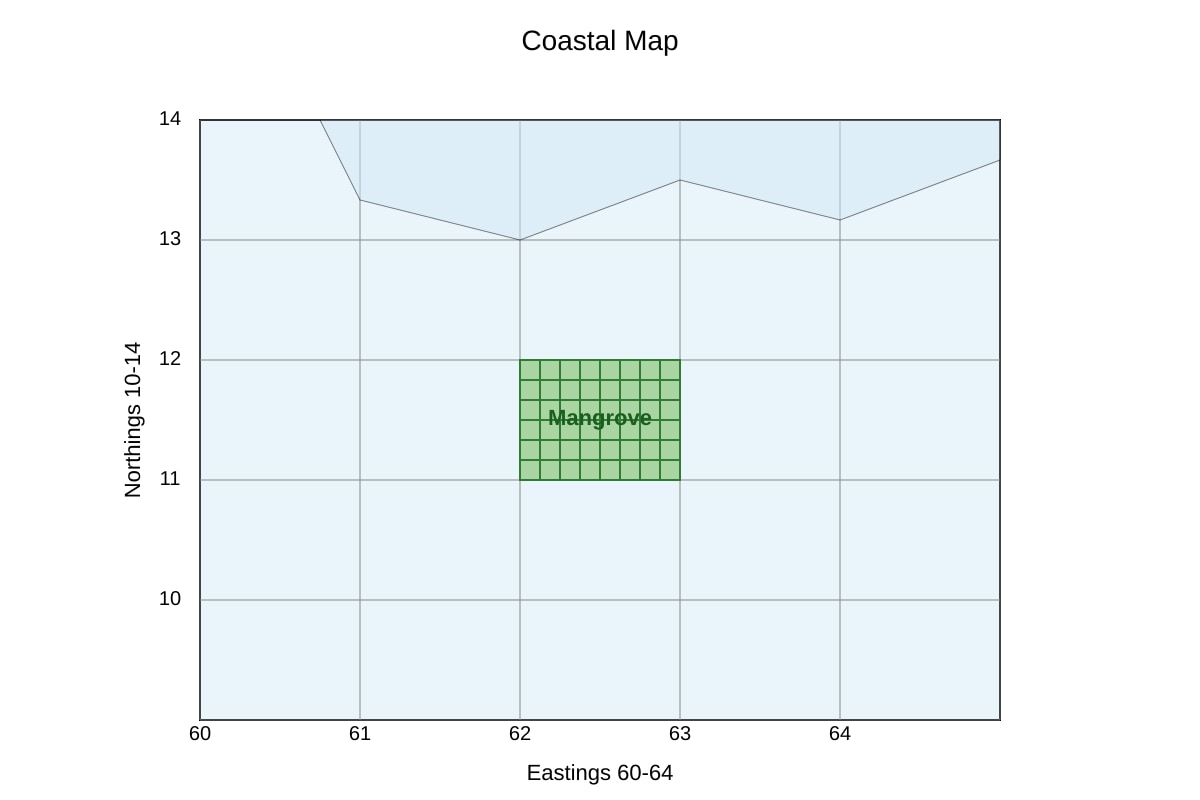
22. Study the map of a coastline below. State the four-figure grid reference of the mangrove area. [1]
Image pending generation: map for Q22.
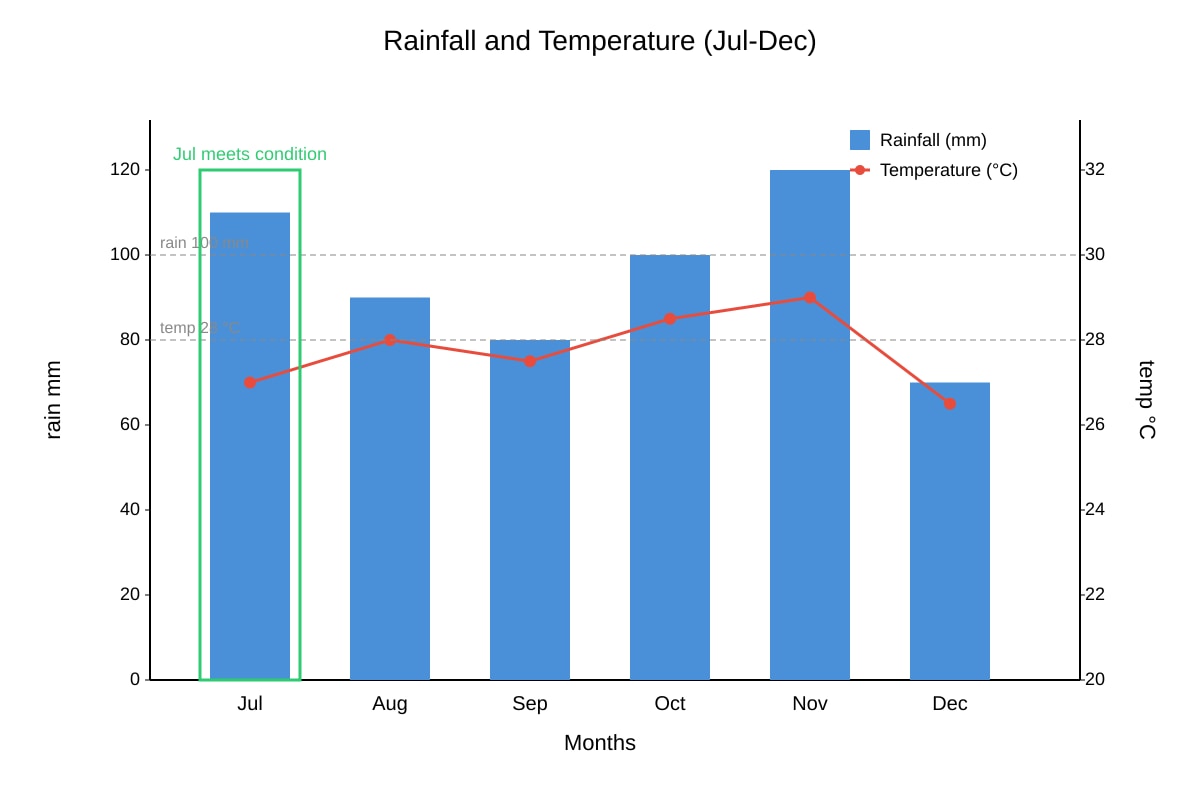
23. The graph shows rainfall and temperature for a town. State one month where rainfall is above 100 mm and temperature below 28 °C. [2]
Image pending generation: graph for Q23.
24. A map has scale 1:25 000. Two points are 6 cm apart. Find ground distance in km. [2]
25. Table: Forest area (km²) in 2000 = 50, 2020 = 30. Calculate annual loss rate. [2]
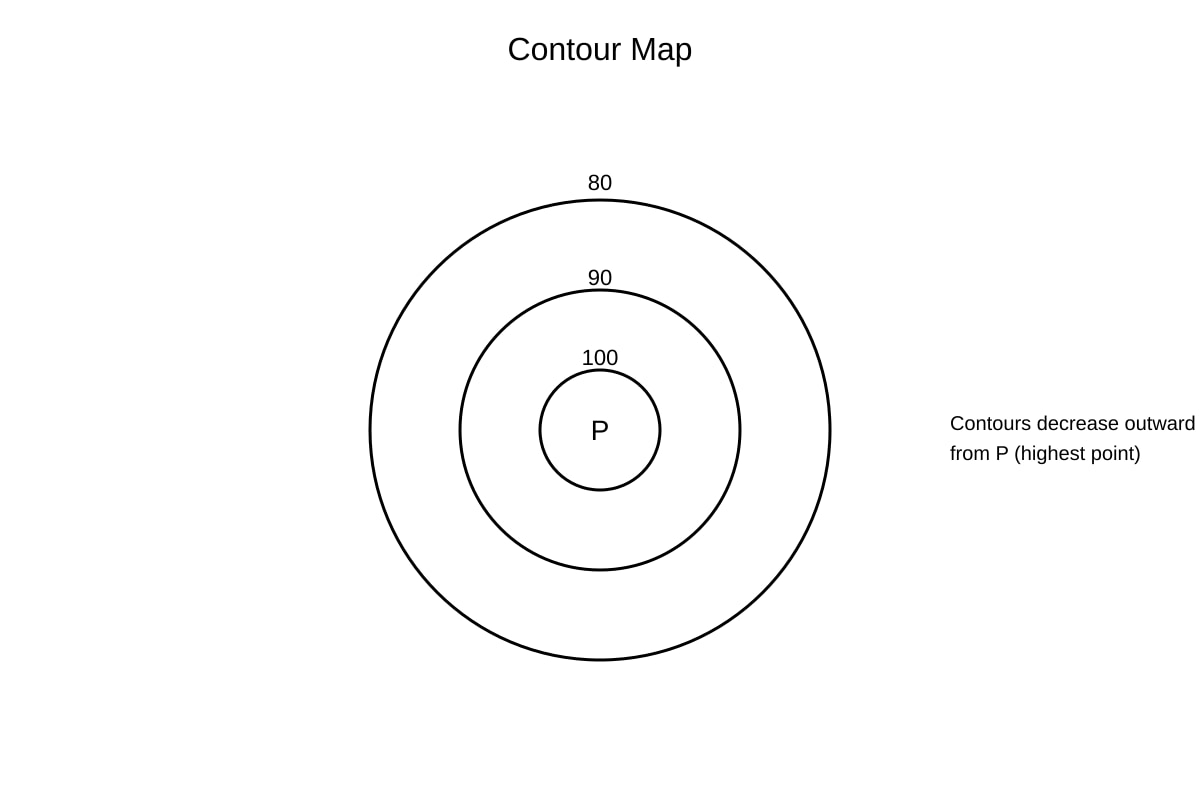
26. With reference to the contour map below, state if point P is a hill or valley and why. [2]
Image pending generation: map for Q26.
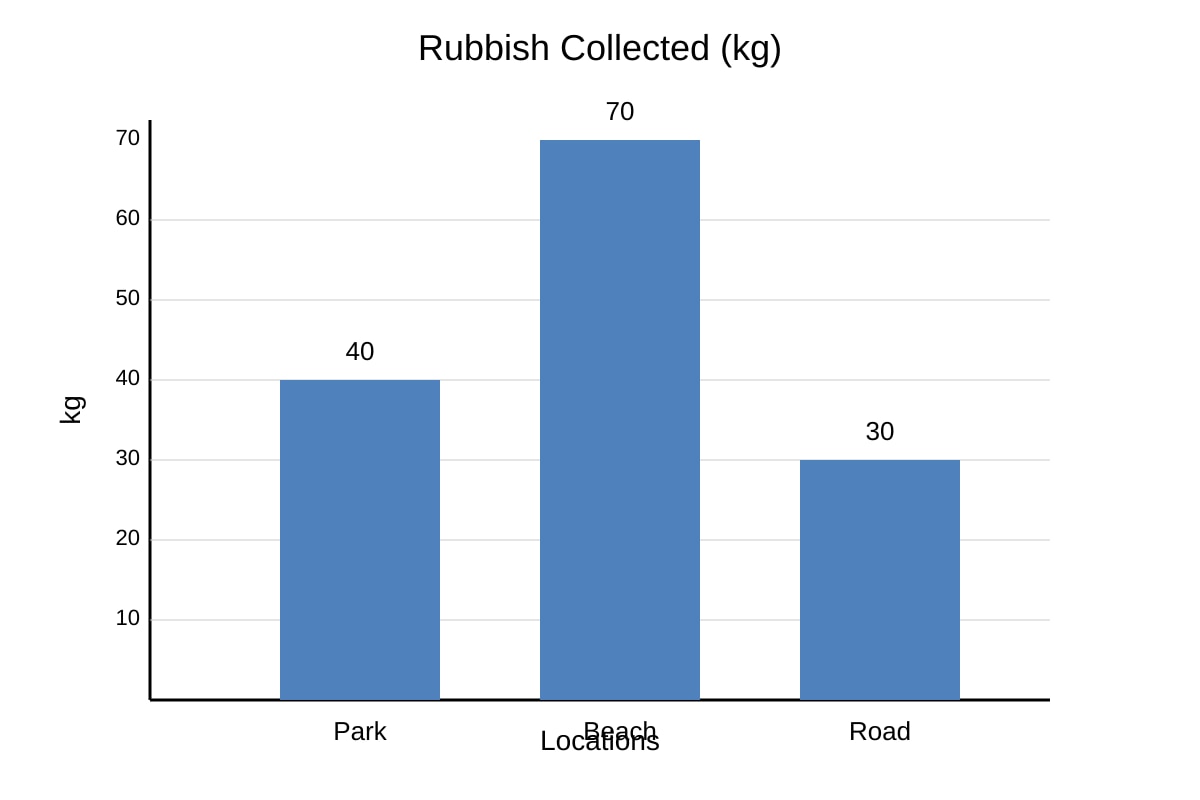
27. Bar graph shows rubbish collected (kg): Park 40, Beach 70, Road 30. Which place had most? [1]
Image pending generation: graph for Q27.
28. From the table below, state the planet with the most moons.
| Planet | Moons | Distance (m km) |
|---|---|---|
| A | 2 | 150 |
| B | 14 | 780 |
| C | 5 | 430 |
[1]
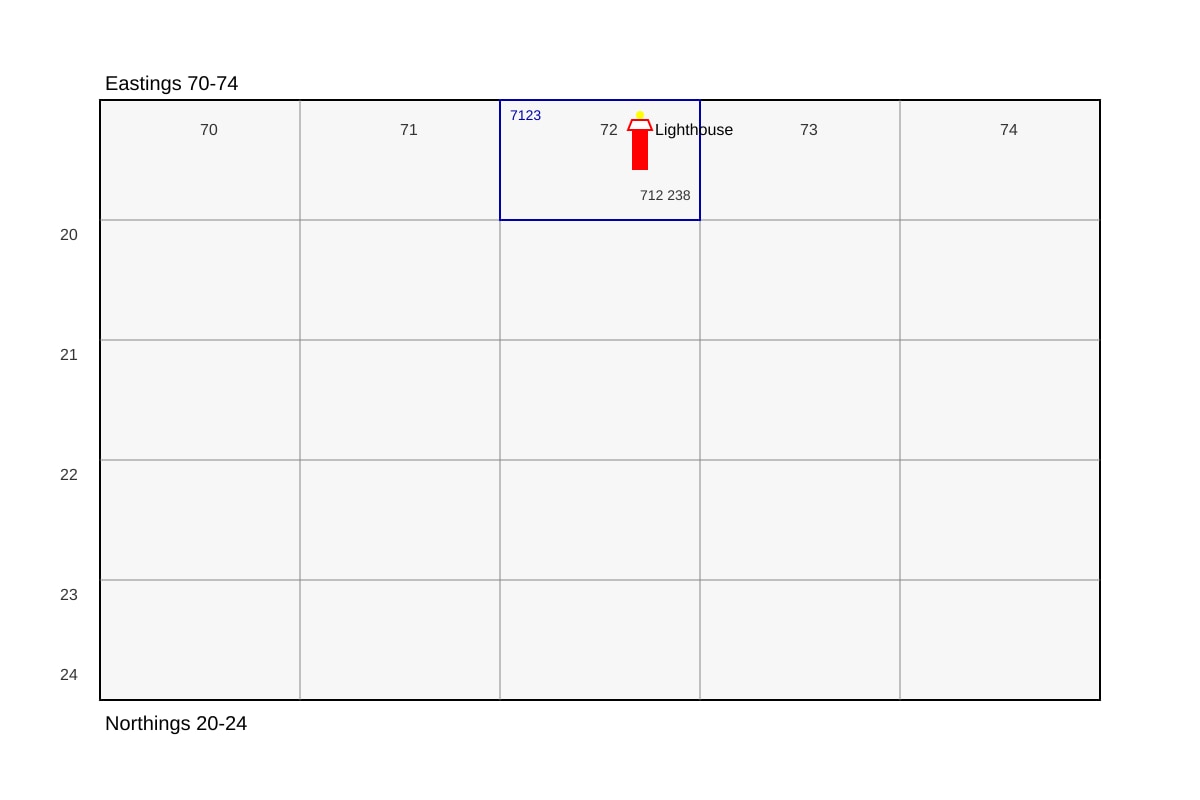
29. Using the map below, give the 6-figure reference of the lighthouse. [2]
Image pending generation: map for Q29.
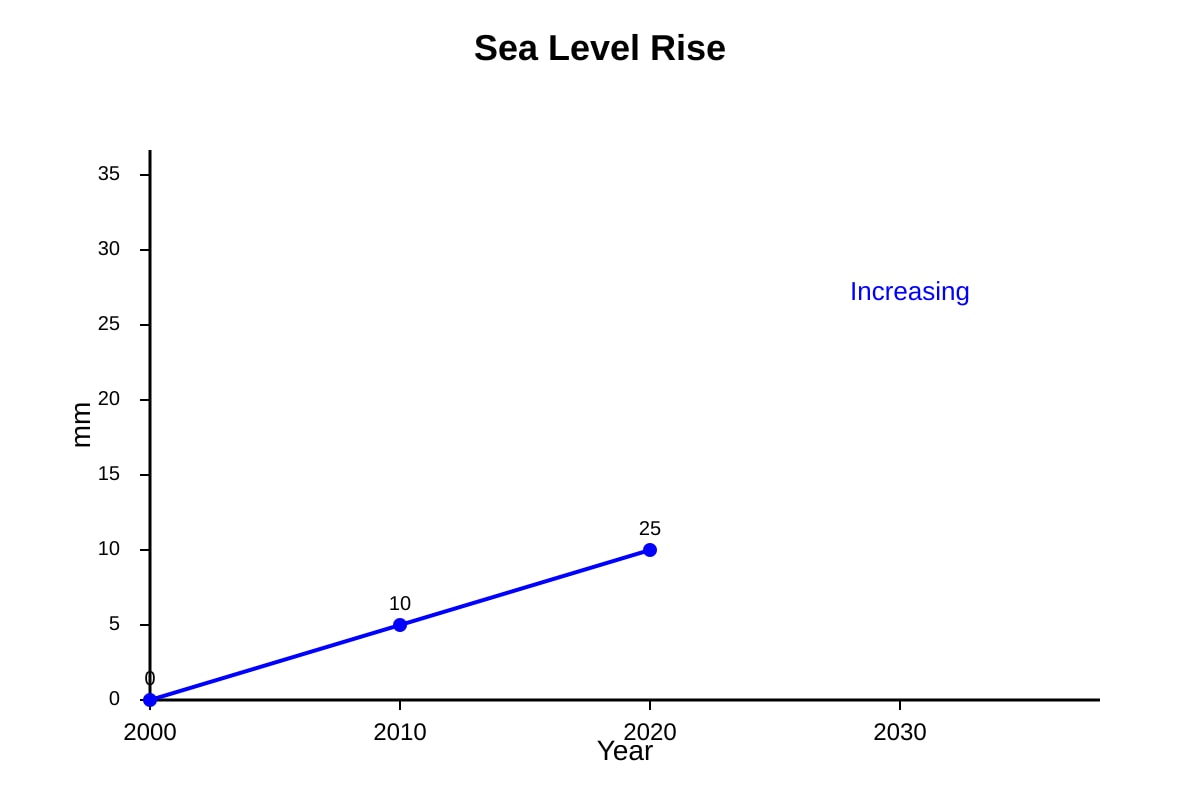
30. A line graph shows sea level rise: 2000 = 0 mm, 2010 = 10 mm, 2020 = 25 mm. Describe the trend. [2]
Image pending generation: graph for Q30.
Section C Total: 20 marks
Total Marks: 60
Answers
TuitionGoWhere Exam Practice (AI) — Secondary 1 Geography SA2 Practice Paper Answer Key (Version 1)
Paper: SA2 Practice Paper
Level: Secondary 1
Total Marks: 60
Section A: Map Reading (20 marks)
1. [1 mark]
Answer: 2252
Teaching note: Read easting (across, 22) first, then northing (up, 52). Use lower-left corner of the square containing the School.
Common mistake: Reversing to 5222.
2. [1 mark]
Answer: 2351
Teaching note: Reservoir is in square between easting 23 and northing 51.
3. [1 mark]
Answer: 323624 (acceptable 323–324 / 624–625 range)
Teaching note: 4-figure base = 3262. Hospital is 3/10 across (easting +3 → 323) and 4/10 up (northing +4 → 624).
4. [1 mark]
Answer: 10 m
Teaching note: Difference between labelled adjacent contours (20 m − 10 m = 10 m).
5. [1 mark]
Answer: 417732 (or 417 732)
Teaching note: Northernmost temple is in 4173; 7/10 across, 3/10 up → 417 732.
6. [2 marks]
Answer: 2 km
Working:
- Scale 1:50 000 means 1 cm = 50 000 cm = 0.5 km.
- 4 cm × 0.5 km = 2 km.
Marking: 1 mark for conversion, 1 mark for final answer.
7. [1 mark]
Answer: Triangulated height / peak (or trigonometric point)
Teaching note: Black triangle with dot is standard symbol for a survey peak.
8. [1 mark]
Answer: 1182
Teaching note: Bridge on river inside square 1182.
9. [1 mark]
Answer: 100 m
Teaching note: X lies on the contour labelled 100 m.
10. [2 marks]
Answer: Wrong because easting/northing reversed or wrong square; correct = 5392.
Teaching note: Student wrote 5398 (northing 98 impossible as map shows 90–94). Correct square is 5392.
Marking: 1 mark explanation, 1 mark correct reference.
Section B: Graph & Table Interpretation (20 marks)
11. [1 mark]
Answer: May (120 mm)
12. [2 marks]
Answer: 65.8 mm (or 66 mm rounded)
Working: (20+35+50+80+120+90) ÷ 6 = 395 ÷ 6 = 65.83 mm.
Marking: 1 mark sum, 1 mark division.
13. [2 marks]
Answer: Car (8) and Cycle (5)
Teaching note: Both fewer than 10.
Marking: 1 mark each.
14. [3 marks]
Answer: Temperature increases steadily from 24 °C at 8 am to 31 °C at 2 pm.
Marking: 1 mark state rise, 1 mark start value, 1 mark end value.
Teaching note: Use data points from graph.
15. [2 marks]
Answer: 25%
Working: Total = 40+25+10+30 = 105 L. Toilet = 25. (25 ÷ 105) × 100 = 23.8% ≈ 25% (or accept 23.8%).
Marking: 1 mark total, 1 mark percentage.
16. [1 mark]
Answer: Forest (45%)
17. [1 mark]
Answer: 7 °C (31 − 24)
18. [2 marks]
Answer: Site A is deeper (2.0 m > 0.8 m). Reason: data shows greater depth.
Marking: 1 mark site, 1 mark reason.
19. [3 marks]
Answer: Population increased from 100 000 in 2010 to 160 000 in 2020; steady rise of 30 000 every 5 years.
Marking: 1 mark start, 1 mark end, 1 mark trend.
20. [3 marks]
Answer: 60%
Working: ((160 − 100) ÷ 100) × 100 = 60%.
Marking: 1 mark increase, 1 mark division, 1 mark %.
Section C: Data Application (20 marks)
21. [3 marks]
Answer: Site X better. Turbidity lower (5 < 15), dissolved O₂ higher (8 > 4).
Marking: 1 mark site, 2 marks data points.
22. [1 mark]
Answer: 6212
23. [2 marks]
Answer: July (rain 110 > 100, temp 27 < 28).
Marking: 1 mark month, 1 mark reason.
24. [2 marks]
Answer: 1.5 km
Working: 1:25 000 → 1 cm = 0.25 km. 6 × 0.25 = 1.5 km.
25. [2 marks]
Answer: 1 km²/year
Working: (50 − 30) ÷ 20 = 1 km²/yr.
26. [2 marks]
Answer: Hill. Contours close at P with highest value inside.
Marking: 1 mark type, 1 mark reason.
27. [1 mark]
Answer: Beach (70 kg)
28. [1 mark]
Answer: Planet B (14 moons)
29. [2 marks]
Answer: 712238 (or 712 238)
Teaching note: Base 7123, 2/10 across, 8/10 up.
30. [2 marks]
Answer: Sea level rose from 0 mm (2000) to 25 mm (2020), accelerating after 2010.
Marking: 1 mark values, 1 mark trend.
Free quiz and exam paper access
Enter your details to view this paper
Your access is remembered on this device.