AI Generated Quiz
Primary 6 PSLE Mathematics Data Analysis Quiz
Free P6 PSLE Maths Data Analysis quiz, Nemo3 AI version, with questions, answers, and PSLE-focused practice for Singapore students.
These static practice materials are generated from the site's syllabus and paper-generation workflow, with source and model context shown so students and parents can evaluate the material before use.
Questions
Primary 6 PSLE Mathematics Quiz - Data Analysis
Name: ___________________________
Class: Primary 6 _____
Date: _______________
Score: _____ / 50
Duration: 50 minutes
Total Marks: 50
Instructions:
- Answer all questions.
- Show your working clearly in the space provided.
- Write your answers in the spaces provided.
- For questions requiring units, give your answers in the units stated.
- The number of marks is given in brackets [ ] at the end of each question or part question.
Section A: Multiple Choice Questions (10 marks)
Questions 1 to 5 carry 2 marks each. Choose the correct answer and write its number (1, 2, 3 or 4) in the brackets provided.
1. The table below shows the number of books read by 40 students in a month.
| Number of books | 0 | 1 | 2 | 3 | 4 |
|---|---|---|---|---|---|
| Number of students | 5 | 12 | 10 | 8 | 5 |
What is the average number of books read per student? [2]
(1) 1.8
(2) 2.0
(3) 2.2
(4) 2.5
Answer: (_____)
2. The line graph below shows the temperature of a cup of hot water cooling over time.
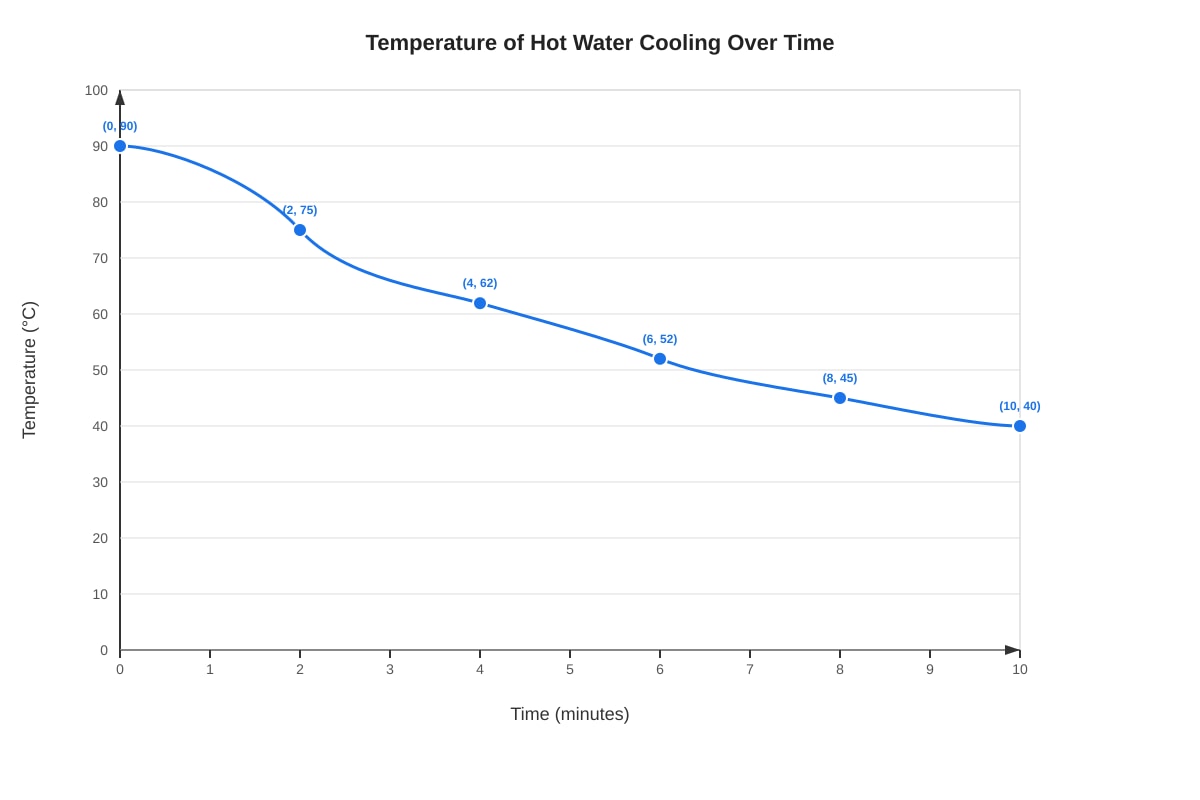
Generated graph for Q2.
Between which two consecutive time intervals did the temperature drop the most? [2]
(1) 0 to 2 minutes
(2) 2 to 4 minutes
(3) 4 to 6 minutes
(4) 6 to 8 minutes
Answer: (_____)
3. The pie chart shows how 360 students travel to school.
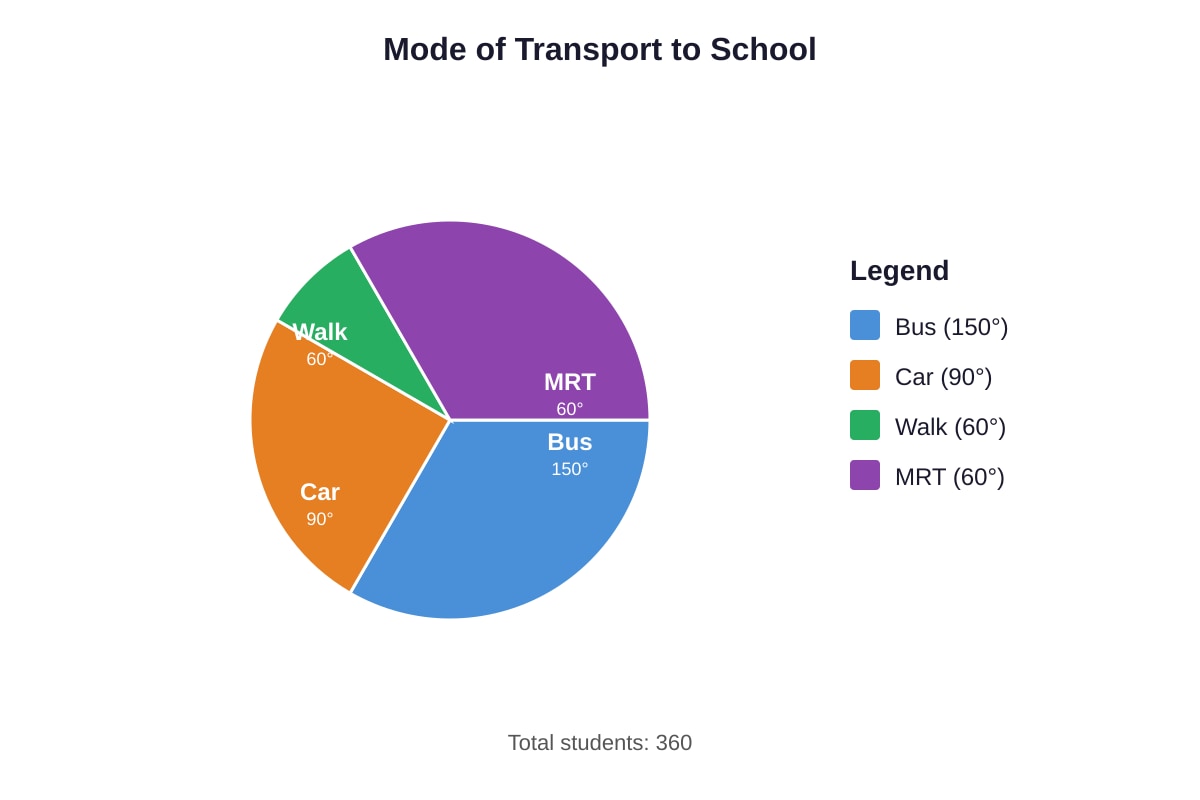
Generated chart for Q3.
How many students travel by MRT? [2]
(1) 40
(2) 60
(3) 80
(4) 90
Answer: (_____)
4. The bar graph shows the number of visitors to a library over 5 days.
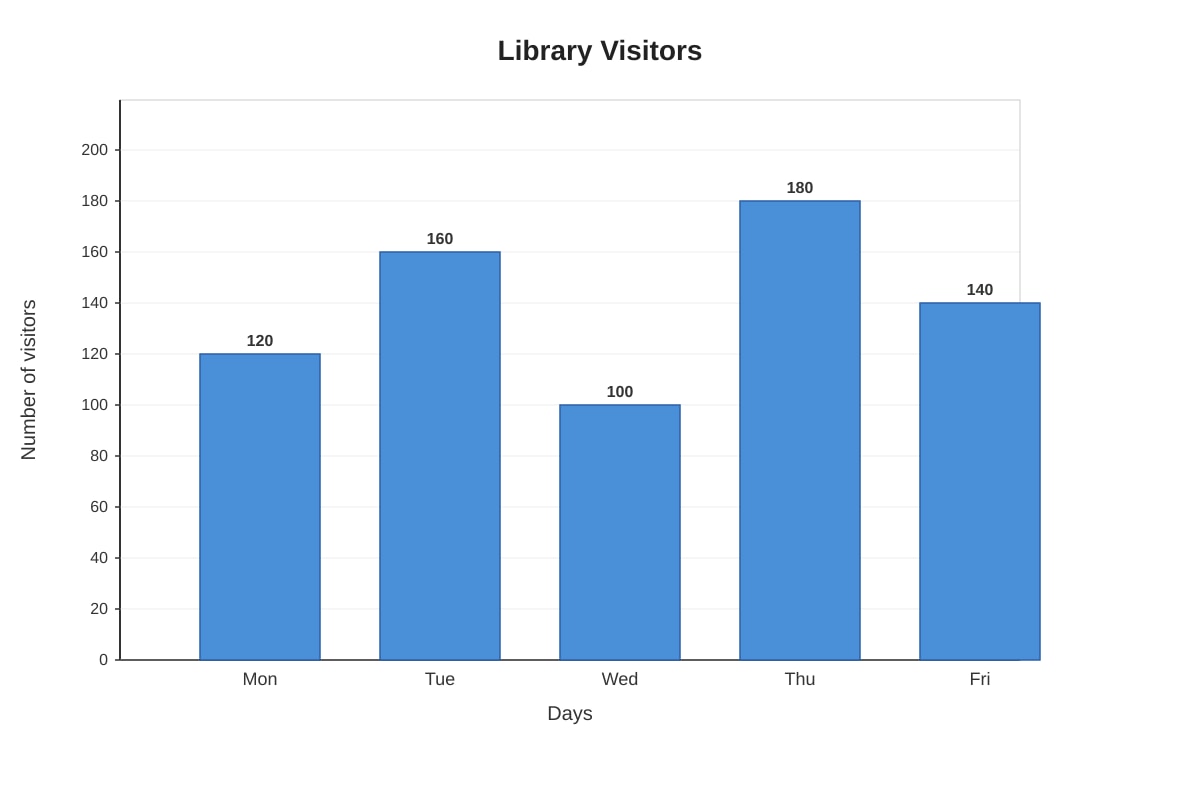
Generated graph for Q4.
What is the difference between the highest and lowest number of visitors? [2]
(1) 60
(2) 80
(3) 100
(4) 120
Answer: (_____)
5. The table shows the mass of 5 parcels.
| Parcel | A | B | C | D | E |
|---|---|---|---|---|---|
| Mass (kg) | 2.5 | 3.2 | 1.8 | 4.1 | 2.4 |
If the average mass of the 5 parcels is 2.8 kg, what is the mass of parcel F if it is added and the new average becomes 3.0 kg? [2]
(1) 3.5 kg
(2) 4.0 kg
(3) 4.5 kg
(4) 5.0 kg
Answer: (_____)
Section B: Short Answer Questions (20 marks)
Questions 6 to 15 carry 2 marks each. Show your working clearly and write your answers in the spaces provided. For questions which require units, give your answers in the units stated.
6. The table below shows the number of goals scored by a football team in 20 matches.
| Goals scored | 0 | 1 | 2 | 3 | 4 |
|---|---|---|---|---|---|
| Number of matches | 4 | 6 | 5 | 3 | 2 |
Find the mode of the number of goals scored. [2]
Answer: _______________
7. The line graph shows the distance travelled by a car over 6 hours.
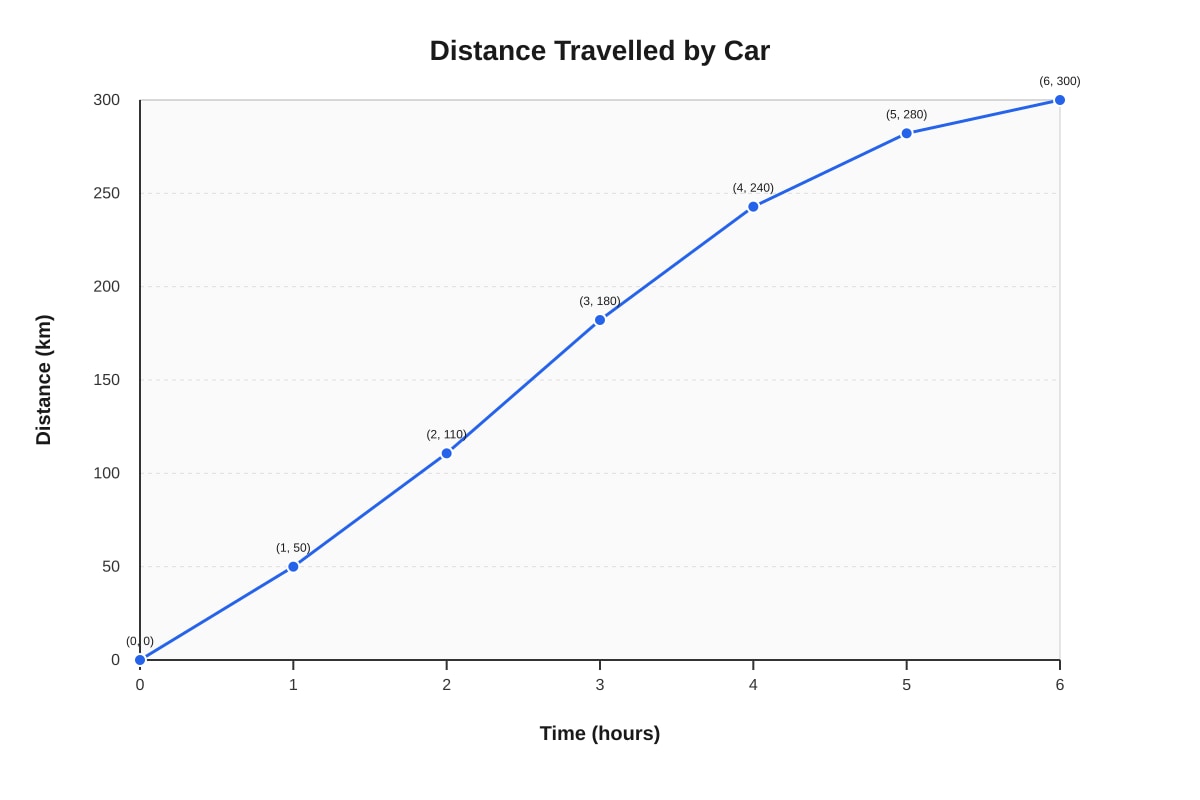
Generated graph for Q7.
What was the average speed of the car between the 2nd hour and the 5th hour? [2]
Answer: _______________ km/h
8. The pie chart represents the favourite fruits of 240 children.
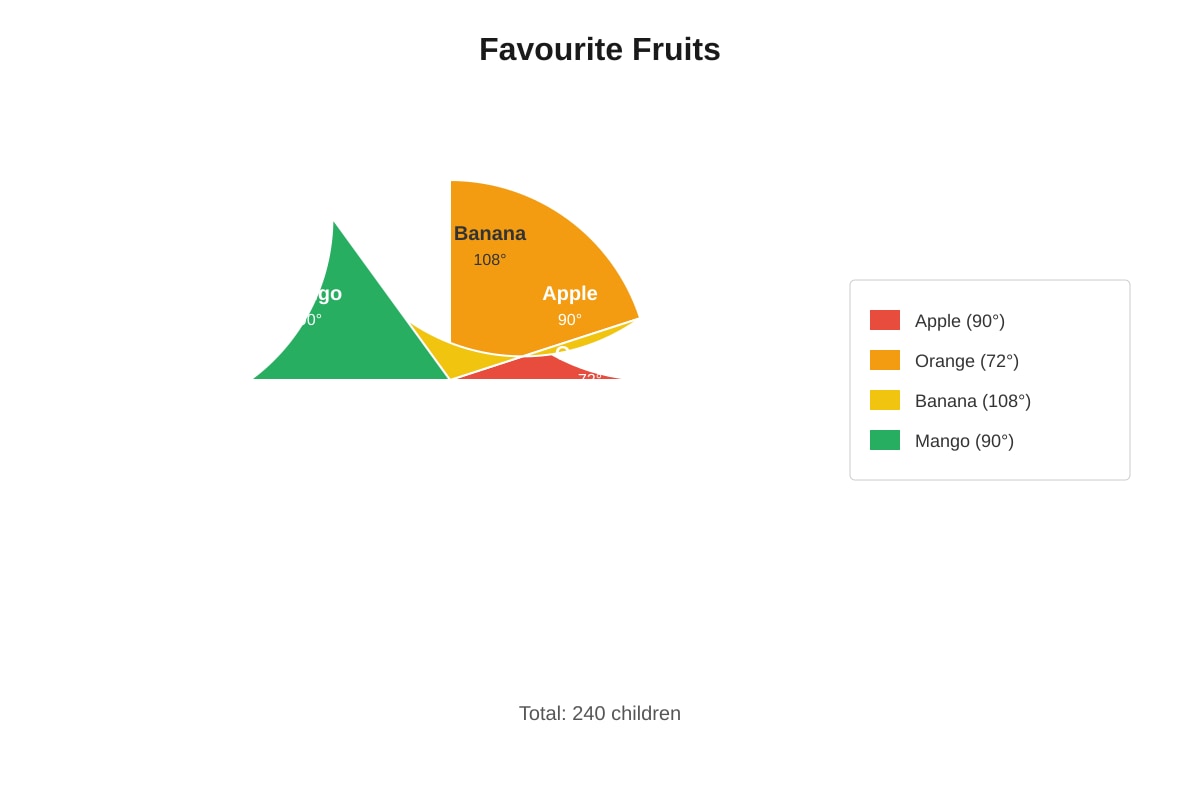
Generated chart for Q8.
How many more children chose Banana than Orange? [2]
Answer: _______________
9. The table shows the number of storybooks read by pupils in a class.
| Number of storybooks | 1 | 2 | 3 | 4 | 5 |
|---|---|---|---|---|---|
| Number of pupils | 3 | 5 | 8 | 4 | 2 |
Find the median number of storybooks read. [2]
Answer: _______________
10. The bar graph shows the amount of rainfall (in mm) over 6 months.
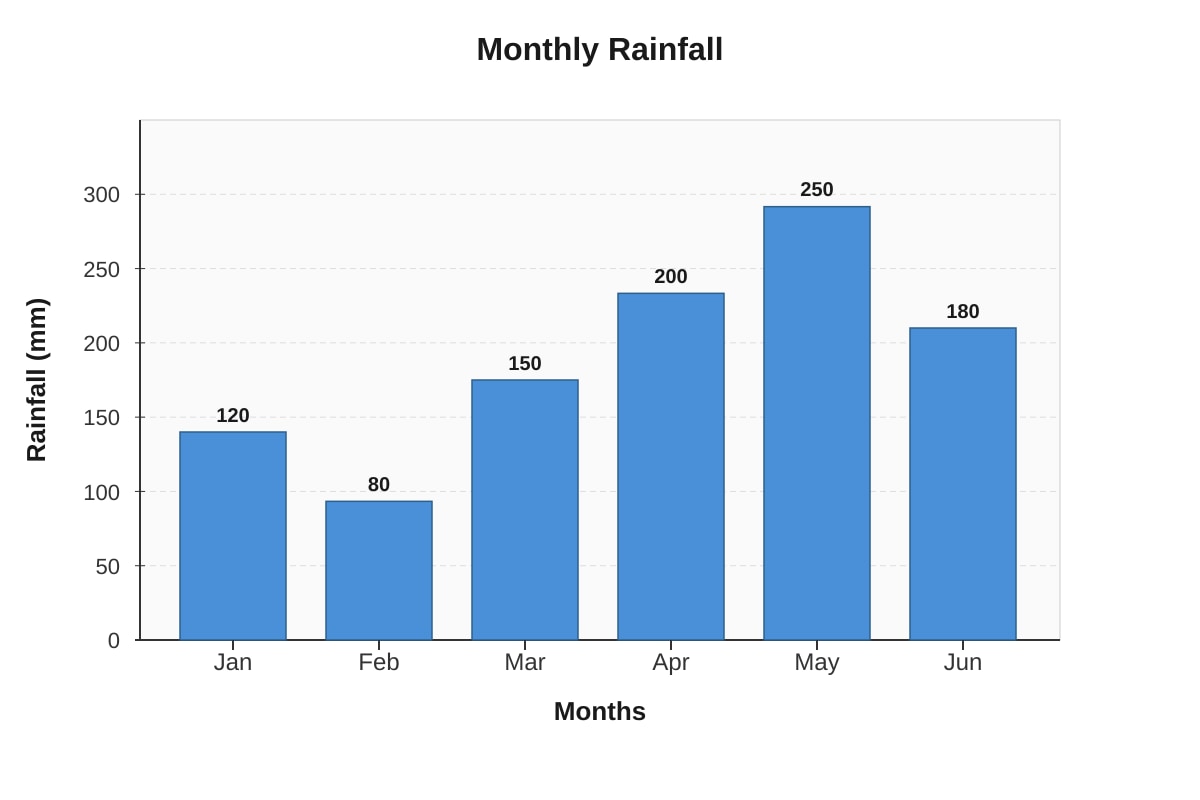
Generated graph for Q10.
What percentage of the total rainfall from January to June fell in May? Round your answer to 1 decimal place. [2]
Answer: _______________%
11. The average height of 6 girls is 1.42 m. When another girl joins the group, the average height becomes 1.40 m. What is the height of the new girl? [2]
Answer: _______________ m
12. The table below shows the number of hours 30 students spent on homework in a week.
| Hours | 0-2 | 3-5 | 6-8 | 9-11 | 12-14 |
|---|---|---|---|---|---|
| Frequency | 4 | 8 | 10 | 5 | 3 |
Estimate the mean number of hours spent on homework. [2]
Answer: _______________ hours
13. The line graph shows the temperature in a room over 12 hours.
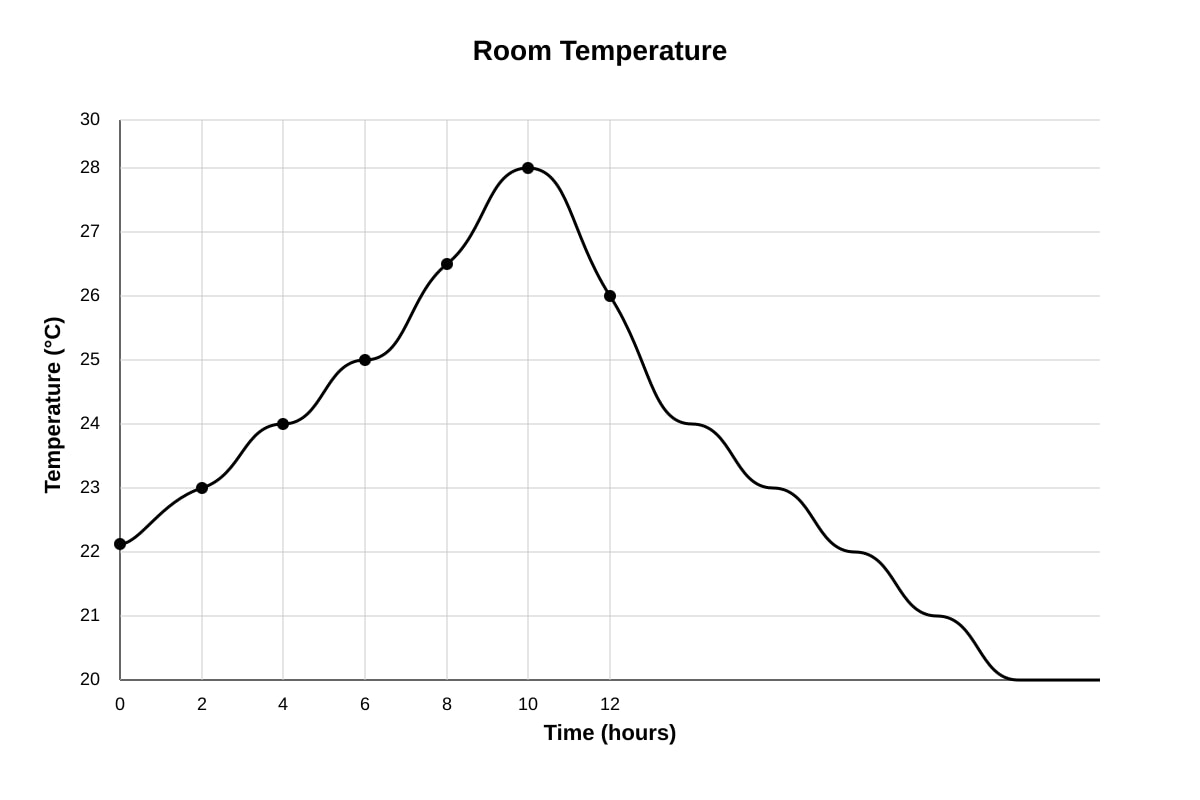
Generated graph for Q13.
During which 2-hour interval did the temperature increase the most? [2]
Answer: _______________ to _______________ hours
14. The pie chart shows the types of pets owned by 180 families.

Generated chart for Q14.
How many families own either a Dog or a Cat? [2]
Answer: _______________
15. The table shows the scores of 10 students in a test.
| Score | 65 | 70 | 75 | 80 | 85 | 90 |
|---|---|---|---|---|---|---|
| Frequency | 1 | 2 | 3 | 2 | 1 | 1 |
If the passing mark is 75, what percentage of students passed the test? [2]
Answer: _______________%
Section C: Long Answer Questions (20 marks)
Questions 16 to 20 carry 4 marks each. Show your working clearly and write your answers in the spaces provided.
16. The table below shows the number of books borrowed from a library over 5 days.
| Day | Monday | Tuesday | Wednesday | Thursday | Friday |
|---|---|---|---|---|---|
| Number of books | 120 | 150 | 100 | 180 | 140 |
(a) Draw a line graph to represent the data above. Use the grid provided. [2]
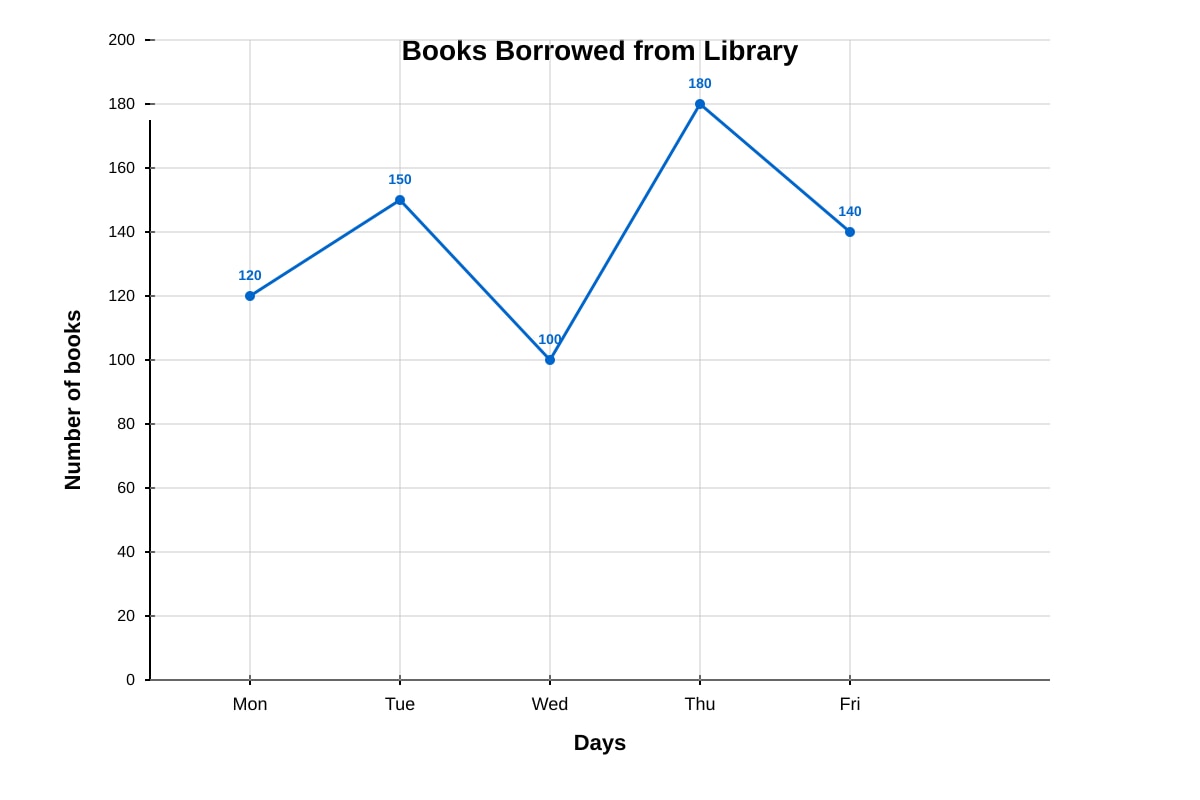
Generated graph for Q16.
(b) Between which two consecutive days was the increase in books borrowed the greatest? [1]
Answer: _______________ to _______________
(c) What was the average number of books borrowed per day? [1]
Answer: _______________
17. The pie chart shows how Mr. Tan spent his monthly salary of $4800.
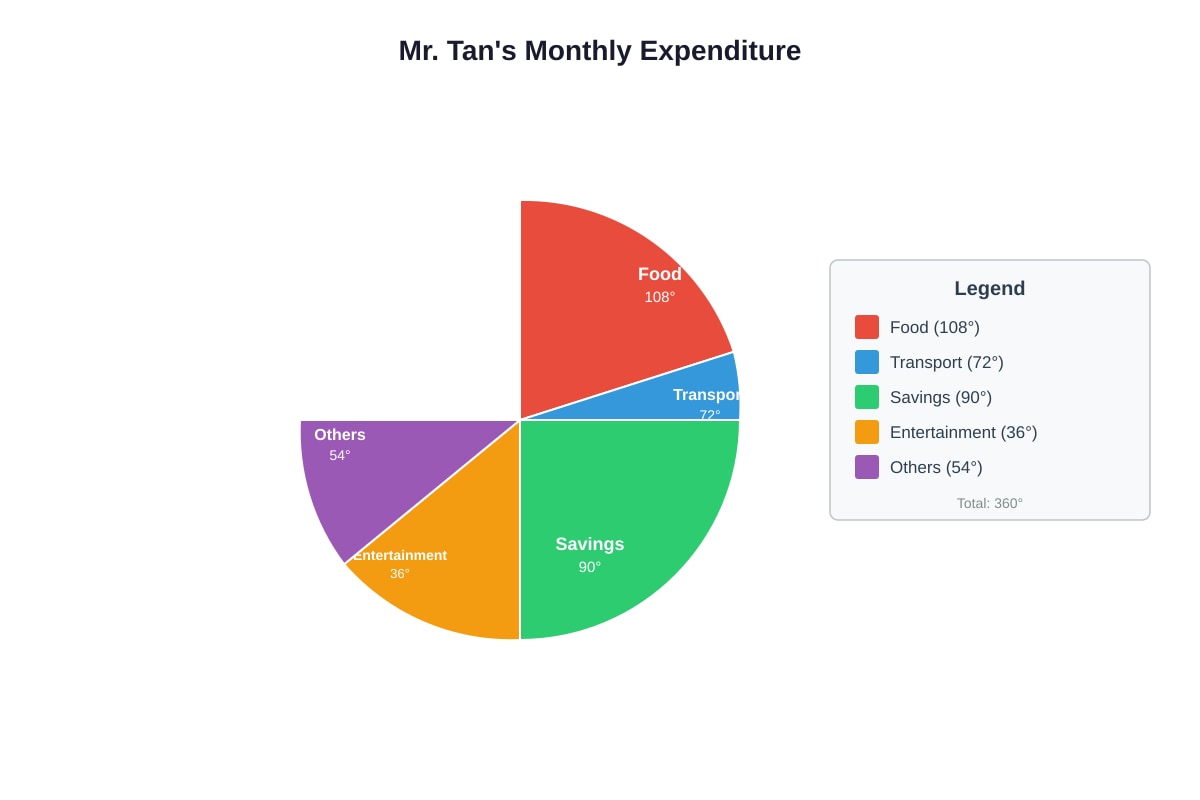
Generated chart for Q17.
(a) How much did Mr. Tan spend on Food? [1]
Answer: $_______________
(b) What fraction of his salary did he save? Give your answer in the simplest form. [1]
Answer: _______________
(c) Mr. Tan decided to increase his savings by 20% next month while keeping his salary the same. How much more will he save? [2]
Answer: $_______________
18. The bar graph shows the number of participants in a swimming competition over 5 years.
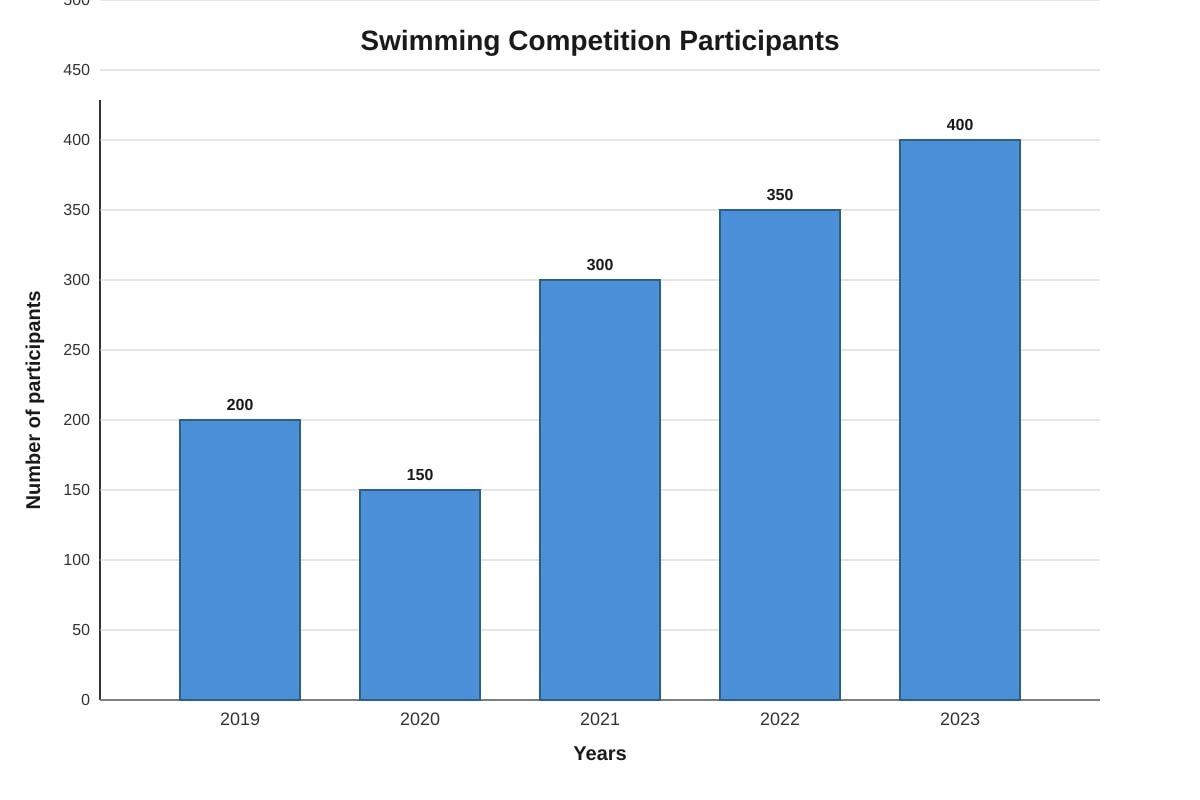
Generated graph for Q18.
(a) In which year was the increase in participants the greatest compared to the previous year? [1]
Answer: _______________
(b) What was the percentage increase from 2020 to 2021? [2]
Answer: _______________%
(c) If the trend from 2021 to 2023 continues, estimate the number of participants in 2024. [1]
Answer: _______________
19. The table shows the masses of 20 parcels.
| Mass (kg) | 1.0-1.4 | 1.5-1.9 | 2.0-2.4 | 2.5-2.9 | 3.0-3.4 |
|---|---|---|---|---|---|
| Frequency | 3 | 5 | 6 | 4 | 2 |
(a) Which mass interval contains the median? [1]
Answer: _______________ kg
(b) Estimate the mean mass of the parcels. [2]
Answer: _______________ kg
(c) If a parcel is chosen at random, what is the probability that its mass is at least 2.5 kg? Express your answer as a fraction in the simplest form. [1]
Answer: _______________
20. The line graph shows the water level in a tank over 8 hours. Water flows into the tank at a constant rate for the first 4 hours, then water flows out at a constant rate for the next 4 hours.
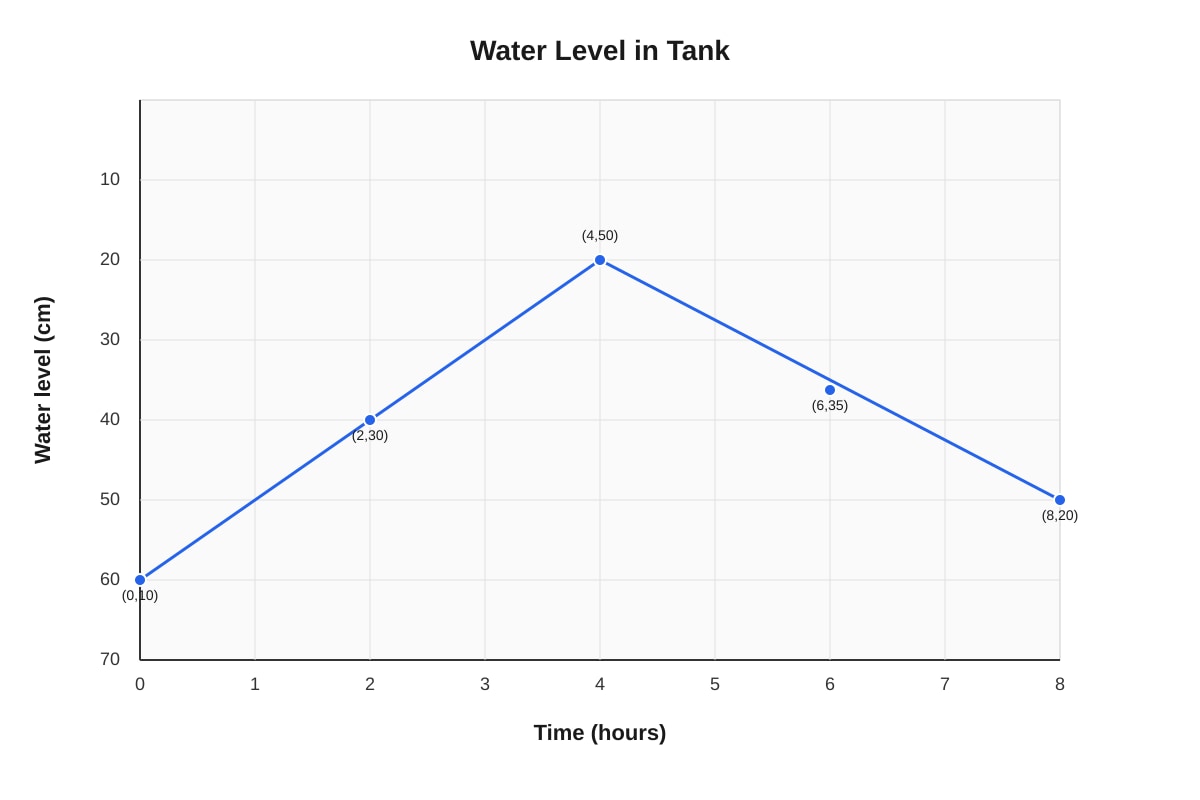
Generated graph for Q20.
(a) What was the rate of water flowing into the tank (in cm per hour)? [1]
Answer: _______________ cm/h
(b) What was the rate of water flowing out of the tank (in cm per hour)? [1]
Answer: _______________ cm/h
(c) At what time was the water level exactly 40 cm? [2]
Answer: _______________ hours
End of Quiz
Answers
Primary 6 PSLE Mathematics Quiz - Data Analysis (Answer Key)
Total Marks: 50
Section A: Multiple Choice Questions (10 marks)
1. Answer: (2) 2.0 [2 marks]
Working: Total books = (0 × 5) + (1 × 12) + (2 × 10) + (3 × 8) + (4 × 5) = 0 + 12 + 20 + 24 + 20 = 76
Total students = 5 + 12 + 10 + 8 + 5 = 40
Average = 76 ÷ 40 = 1.9 = 2.0 (to 1 decimal place)
Marking notes:
- 1 mark for correct total books (76)
- 1 mark for correct average (2.0)
- Common mistake: Forgetting to multiply frequency by value
2. Answer: (1) 0 to 2 minutes [2 marks]
Working: Temperature drops:
- 0 to 2 min: 90 - 75 = 15°C
- 2 to 4 min: 75 - 62 = 13°C
- 4 to 6 min: 62 - 52 = 10°C
- 6 to 8 min: 52 - 45 = 7°C
Greatest drop = 15°C (0 to 2 minutes)
Marking notes:
- 1 mark for calculating all drops correctly
- 1 mark for identifying the correct interval
- Key concept: Read values from graph, calculate differences
3. Answer: (2) 60 [2 marks]
Working: MRT sector angle = 60° Total students = 360 Number of students by MRT = (60/360) × 360 = 60
Marking notes:
- 1 mark for correct fraction (60/360 = 1/6)
- 1 mark for correct answer (60)
- Key concept: Pie chart angle ÷ 360° × total = quantity
4. Answer: (2) 80 [2 marks]
Working: Highest visitors = Thursday = 180 Lowest visitors = Wednesday = 100 Difference = 180 - 100 = 80
Marking notes:
- 1 mark for identifying highest and lowest correctly
- 1 mark for correct difference
- Common mistake: Reading wrong bars
5. Answer: (2) 4.0 kg [2 marks]
Working: Total mass of 5 parcels = 2.8 × 5 = 14.0 kg Total mass of 6 parcels = 3.0 × 6 = 18.0 kg Mass of parcel F = 18.0 - 14.0 = 4.0 kg
Marking notes:
- 1 mark for finding total mass of 5 parcels (14.0 kg)
- 1 mark for finding mass of parcel F (4.0 kg)
- Key concept: Average × number = total
Section B: Short Answer Questions (20 marks)
6. Answer: 1 [2 marks]
Working: The mode is the value with the highest frequency. Frequency of 0 goals = 4 Frequency of 1 goal = 6 ← highest Frequency of 2 goals = 5 Frequency of 3 goals = 3 Frequency of 4 goals = 2
Mode = 1 goal
Marking notes:
- 1 mark for identifying highest frequency (6)
- 1 mark for correct mode (1)
- Key concept: Mode = most frequent value
7. Answer: 56.67 km/h (or 56 2/3 km/h) [2 marks]
Working: Distance at 2nd hour = 110 km Distance at 5th hour = 280 km Distance travelled = 280 - 110 = 170 km Time taken = 5 - 2 = 3 hours Average speed = 170 ÷ 3 = 56 2/3 ≈ 56.67 km/h
Marking notes:
- 1 mark for correct distance (170 km) and time (3 h)
- 1 mark for correct average speed
- Accept 56.67 km/h or 56 2/3 km/h
- Key concept: Average speed = distance ÷ time
8. Answer: 24 [2 marks]
Working: Banana angle = 108°, Orange angle = 72° Difference in angle = 108° - 72° = 36° Total children = 240 Difference in children = (36/360) × 240 = 24
Marking notes:
- 1 mark for angle difference (36°) or individual quantities
- 1 mark for correct answer (24)
- Alternative: Banana = (108/360)×240 = 72, Orange = (72/360)×240 = 48, Difference = 24
9. Answer: 3 [2 marks]
Working: Total pupils = 3 + 5 + 8 + 4 + 2 = 22 Median position = (22 + 1) ÷ 2 = 11th and 12th values (average of both) Cumulative frequency: 1 book: 3 pupils (positions 1-3) 2 books: 5 pupils (positions 4-8) 3 books: 8 pupils (positions 9-16) ← contains 11th and 12th Median = 3 books
Marking notes:
- 1 mark for correct total (22) and median position (11th/12th)
- 1 mark for correct median (3)
- Key concept: For even number of data, median = average of two middle values
10. Answer: 25.8% [2 marks]
Working: Total rainfall = 120 + 80 + 150 + 200 + 250 + 180 = 980 mm May rainfall = 250 mm Percentage = (250 ÷ 980) × 100% = 25.51...% ≈ 25.5% (to 1 d.p.)
Correction: 250/980 = 0.2551... = 25.5% (to 1 d.p.)
Marking notes:
- 1 mark for correct total (980 mm)
- 1 mark for correct percentage to 1 d.p. (25.5%)
- Common mistake: Rounding error or wrong total
11. Answer: 1.28 m [2 marks]
Working: Total height of 6 girls = 1.42 × 6 = 8.52 m Total height of 7 girls = 1.40 × 7 = 9.80 m Height of new girl = 9.80 - 8.52 = 1.28 m
Marking notes:
- 1 mark for total height of 6 girls (8.52 m) or 7 girls (9.80 m)
- 1 mark for correct answer (1.28 m)
- Key concept: New total - old total = new value
12. Answer: 6.1 hours [2 marks]
Working: Use midpoints of intervals: 0-2: midpoint = 1, 3-5: midpoint = 4, 6-8: midpoint = 7, 9-11: midpoint = 10, 12-14: midpoint = 13
Estimated total hours = (1×4) + (4×8) + (7×10) + (10×5) + (13×3) = 4 + 32 + 70 + 50 + 39 = 183
Estimated mean = 183 ÷ 30 = 6.1 hours
Marking notes:
- 1 mark for correct midpoints and multiplication
- 1 mark for correct estimated mean (6.1)
- Key concept: Grouped data mean = Σ(fx) ÷ Σf
13. Answer: 4 to 6 hours [2 marks]
Working: Temperature increases: 0-2 h: 23 - 22 = 1°C 2-4 h: 25 - 23 = 2°C 4-6 h: 27 - 25 = 2°C 6-8 h: 28 - 27 = 1°C 8-10 h: 27 - 28 = -1°C (decrease) 10-12 h: 25 - 27 = -2°C (decrease)
Greatest increase = 2°C (both 2-4 h and 4-6 h) But 4-6 h is the later interval with same increase. Accept either 2-4 or 4-6.
Marking notes:
- 1 mark for calculating all increases correctly
- 1 mark for correct interval (2-4 or 4-6)
- Key concept: Read values, calculate differences, compare
14. Answer: 90 [2 marks]
Working: Dog angle = 100°, Cat angle = 80° Total angle for Dog and Cat = 180° Total families = 180 Number of families = (180/360) × 180 = 90
Marking notes:
- 1 mark for combined angle (180°) or individual quantities
- 1 mark for correct answer (90)
- Key concept: Half the circle = half the total
15. Answer: 70% [2 marks]
Working: Total students = 1 + 2 + 3 + 2 + 1 + 1 = 10 Students who passed (score ≥ 75): 3 + 2 + 1 + 1 = 7 Percentage = (7 ÷ 10) × 100% = 70%
Marking notes:
- 1 mark for correct total (10) and passed (7)
- 1 mark for correct percentage (70%)
- Key concept: Passing includes the passing mark itself (≥ 75)
Section C: Long Answer Questions (20 marks)
16. (a) [2 marks]
Line graph requirements:
- Axes labelled correctly (Days, Number of books)
- Scale on y-axis appropriate (0 to 200, intervals of 20)
- Points plotted correctly: Mon(120), Tue(150), Wed(100), Thu(180), Fri(140)
- Points joined with straight line segments
- Title: "Books Borrowed from Library"
Marking:
- 1 mark for correct plotting of all 5 points
- 1 mark for correct line joining and labels/title
(b) Answer: Thursday to Friday [1 mark]
Working: Changes: Mon-Tue: +30 Tue-Wed: -50 Wed-Thu: +80 ← greatest increase Thu-Fri: -40
(c) Answer: 138 [1 mark]
Working: Total = 120 + 150 + 100 + 180 + 140 = 690 Average = 690 ÷ 5 = 138
17. (a) Answer: $1440 [1 mark]
Working: Food angle = 108° Amount = (108/360) × 4800=1440
(b) Answer: 1/4 [1 mark]
Working: Savings angle = 90° Fraction = 90/360 = 1/4
(c) Answer: $240 [2 marks]
Working: Current savings = (90/360) × 4800=1200 20% increase = 0.20 × 1200=240 OR New savings = 1200×1.2=1440, Increase = 1440−1200 = $240
Marking notes:
- 1 mark for current savings ($1200)
- 1 mark for increase ($240)
18. (a) Answer: 2021 [1 mark]
Working: Increases: 2019-2020: 150 - 200 = -50 (decrease) 2020-2021: 300 - 150 = +150 ← greatest 2021-2022: 350 - 300 = +50 2022-2023: 400 - 350 = +50
(b) Answer: 100% [2 marks]
Working: 2020 participants = 150 2021 participants = 300 Increase = 150 Percentage increase = (150 ÷ 150) × 100% = 100%
Marking notes:
- 1 mark for correct increase (150)
- 1 mark for correct percentage (100%)
(c) Answer: 450 [1 mark]
Working: Trend 2021-2023: +50 per year (300 → 350 → 400) 2024 estimate = 400 + 50 = 450
19. (a) Answer: 2.0-2.4 kg [1 mark]
Working: Total parcels = 20 Median position = (20 + 1) ÷ 2 = 10.5th → average of 10th and 11th values Cumulative frequency: 1.0-1.4: 3 (positions 1-3) 1.5-1.9: 5 (positions 4-8) 2.0-2.4: 6 (positions 9-14) ← contains 10th and 11th Median interval = 2.0-2.4 kg
(b) Answer: 2.075 kg [2 marks]
Working: Use midpoints: 1.0-1.4: midpoint = 1.2 1.5-1.9: midpoint = 1.7 2.0-2.4: midpoint = 2.2 2.5-2.9: midpoint = 2.7 3.0-3.4: midpoint = 3.2
Estimated total mass = (1.2×3) + (1.7×5) + (2.2×6) + (2.7×4) + (3.2×2) = 3.6 + 8.5 + 13.2 + 10.8 + 6.4 = 42.5 kg
Estimated mean = 42.5 ÷ 20 = 2.125 kg
Correction: Let me recalculate: 1.2×3 = 3.6 1.7×5 = 8.5 2.2×6 = 13.2 2.7×4 = 10.8 3.2×2 = 6.4 Sum = 42.5 Mean = 42.5/20 = 2.125 kg
Marking notes:
- 1 mark for correct midpoints and Σfx (42.5)
- 1 mark for correct mean (2.125 kg)
(c) Answer: 3/10 [1 mark]
Working: Parcels with mass ≥ 2.5 kg: intervals 2.5-2.9 (4) and 3.0-3.4 (2) = 6 parcels Total parcels = 20 Probability = 6/20 = 3/10
20. (a) Answer: 10 cm/h [1 mark]
Working: Water level rises from 10 cm to 50 cm in 4 hours (0 to 4 hours) Rise = 50 - 10 = 40 cm Rate = 40 cm ÷ 4 h = 10 cm/h
(b) Answer: 7.5 cm/h [1 mark]
Working: Water level falls from 50 cm to 20 cm in 4 hours (4 to 8 hours) Fall = 50 - 20 = 30 cm Rate = 30 cm ÷ 4 h = 7.5 cm/h
(c) Answer: 3 hours and 7 hours [2 marks]
Working: First time (rising): Water level = 40 cm From 10 cm at 10 cm/h: Time = (40 - 10) ÷ 10 = 3 hours
Second time (falling): Water level = 40 cm From 50 cm at 7.5 cm/h: Time from 4h = (50 - 40) ÷ 7.5 = 10 ÷ 7.5 = 4/3 h = 1 h 20 min Time = 4 + 1 1/3 = 5 1/3 hours = 5 hours 20 minutes
Wait, let me recheck the graph values: At 6 hours, water level = 35 cm (given) At 4 hours, water level = 50 cm Rate = (50-35)/2 = 7.5 cm/h ✓
From 50 cm to 40 cm = 10 cm drop Time = 10 ÷ 7.5 = 4/3 hours = 1 hour 20 minutes So time = 4 + 1 1/3 = 5 1/3 hours
But the question asks "At what time was the water level exactly 40 cm?" - there are two times.
Marking notes:
- 1 mark for first time (3 hours)
- 1 mark for second time (5 1/3 hours or 5 hours 20 minutes)
- Accept 5.33 hours or 5 h 20 min
End of Answer Key
Free quiz and exam paper access
Enter your details to view this paper
Your access is remembered on this device.