AI Generated Quiz
Primary 6 PSLE Mathematics Data Analysis Quiz
Free P6 PSLE Maths Data Analysis quiz, Kimi2.6 AI version, with questions, answers, and PSLE-focused practice for Singapore students.
These static practice materials are generated from the site's syllabus and paper-generation workflow, with source and model context shown so students and parents can evaluate the material before use.
Questions
Primary 6 PSLE Mathematics Quiz - Data Analysis
Name: _______________________________ Class: _______
Date: ___________________ Score: _______ / 40
Duration: 40 minutes
Total Marks: 40
Instructions:
- Answer all questions.
- Show your working clearly in the space provided.
- Marks are awarded for correct method even if the final answer is inaccurate.
- Use of calculators is not allowed.
Section A: Simple Data Interpretation (Questions 1–8)
Each question carries 2 marks.
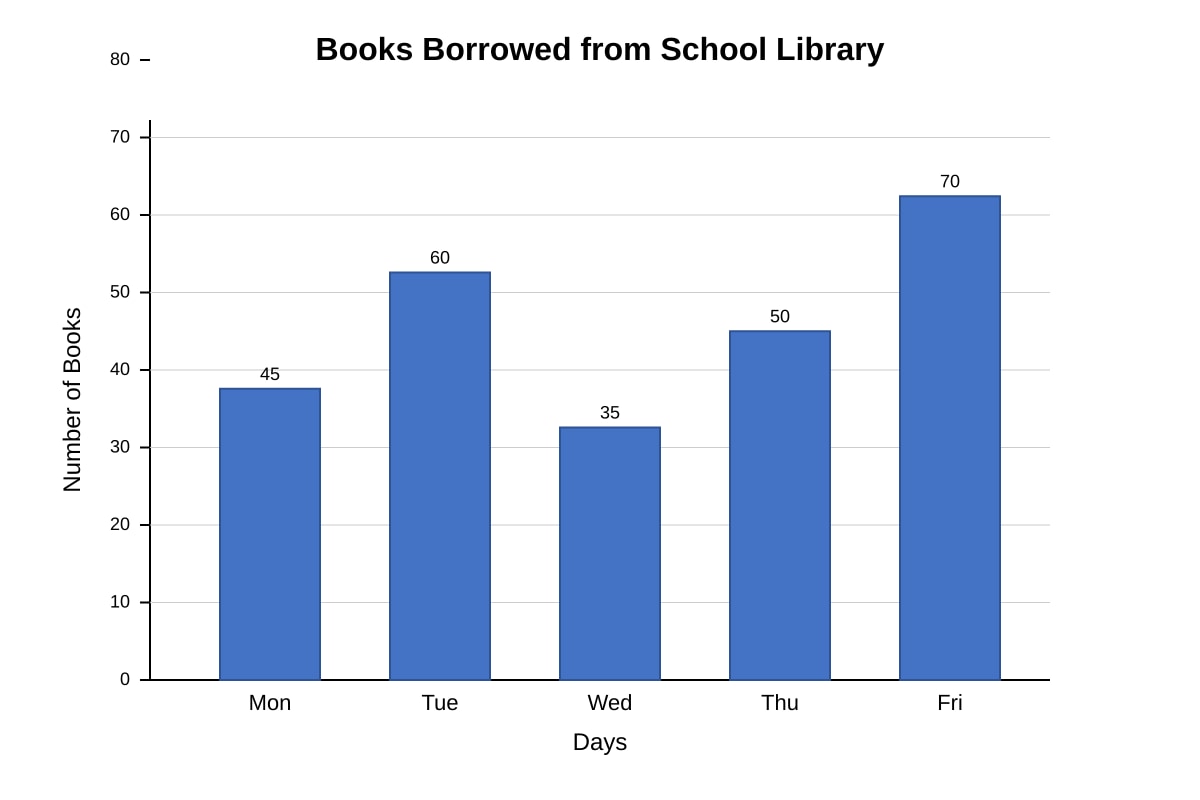
1. The bar graph below shows the number of books borrowed from the school library from Monday to Friday.
Generated bar_graph for Q1.
(a) On which day were the most books borrowed?
_______________________________________________ [1]
(b) What is the total number of books borrowed from Monday to Friday?
_______________________________________________ [1]
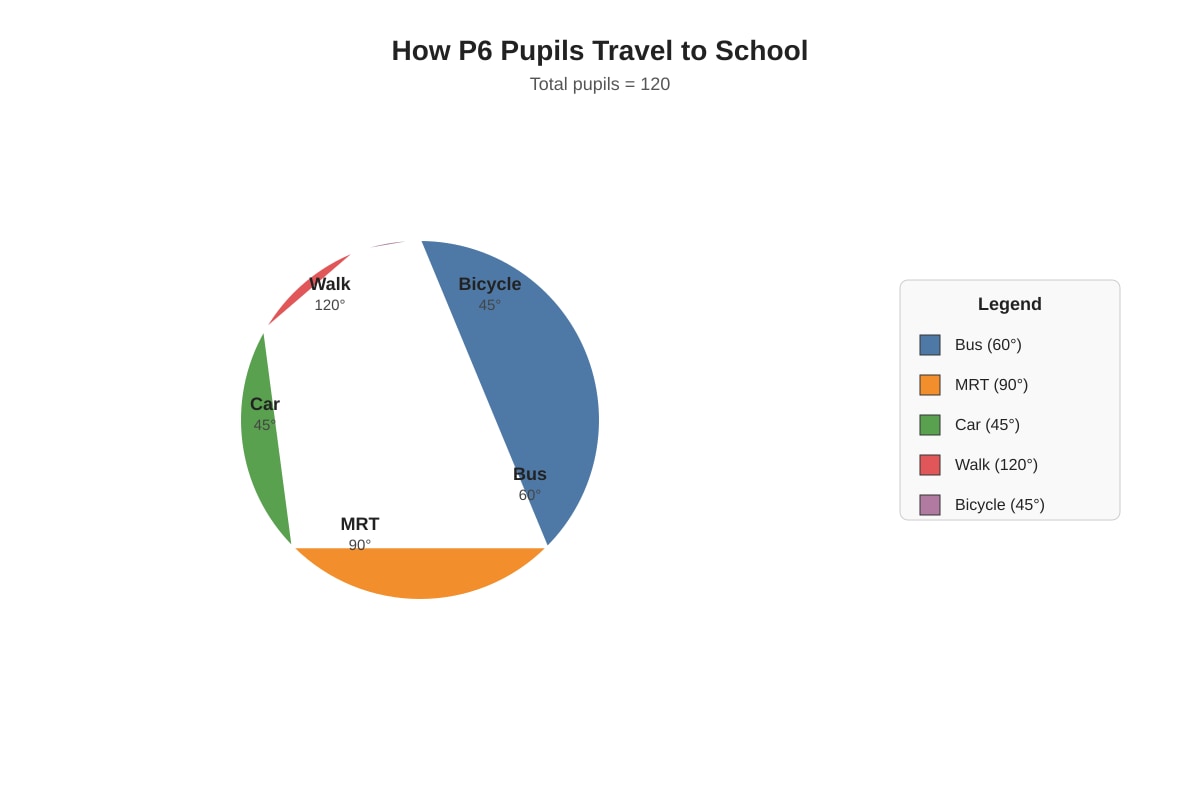
2. The pie chart below shows how 120 pupils in Primary 6 travel to school.
Generated pie_chart for Q2.
(a) What fraction of the pupils walk to school? Express your answer in the simplest form.
_______________________________________________ [1]
(b) How many more pupils travel by bus than by car?
_______________________________________________ [1]
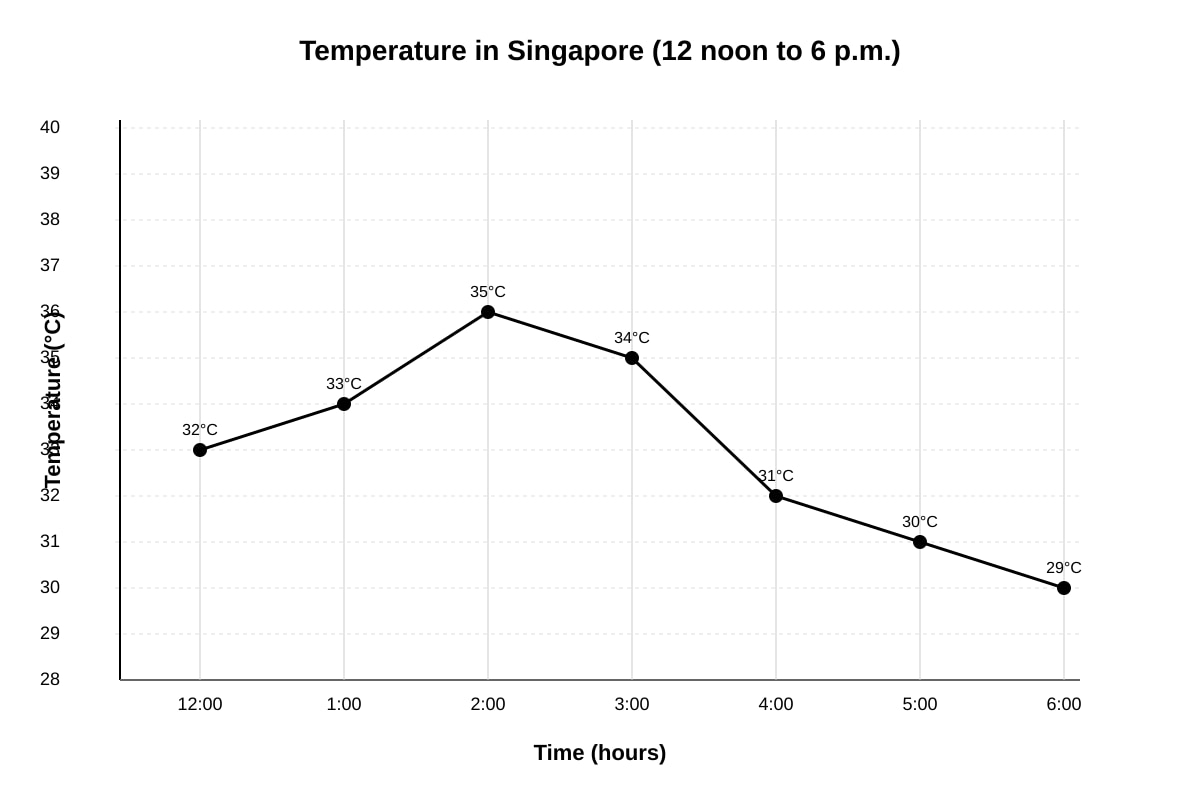
3. The line graph shows the temperature in Singapore over a 6-hour period.
Generated line_graph for Q3.
(a) What was the temperature at 2 p.m.?
_______________________________________________ [1]
(b) What was the greatest decrease in temperature between any two consecutive hours?
_______________________________________________ [1]
4. The table shows the test scores of five pupils.
| Pupil | Test Score |
|---|---|
| Alice | 78 |
| Ben | 65 |
| Clara | 92 |
| David | 65 |
| Evan | 80 |
(a) What is the mode of the test scores?
_______________________________________________ [1]
(b) What is the mean test score?
_______________________________________________ [1]
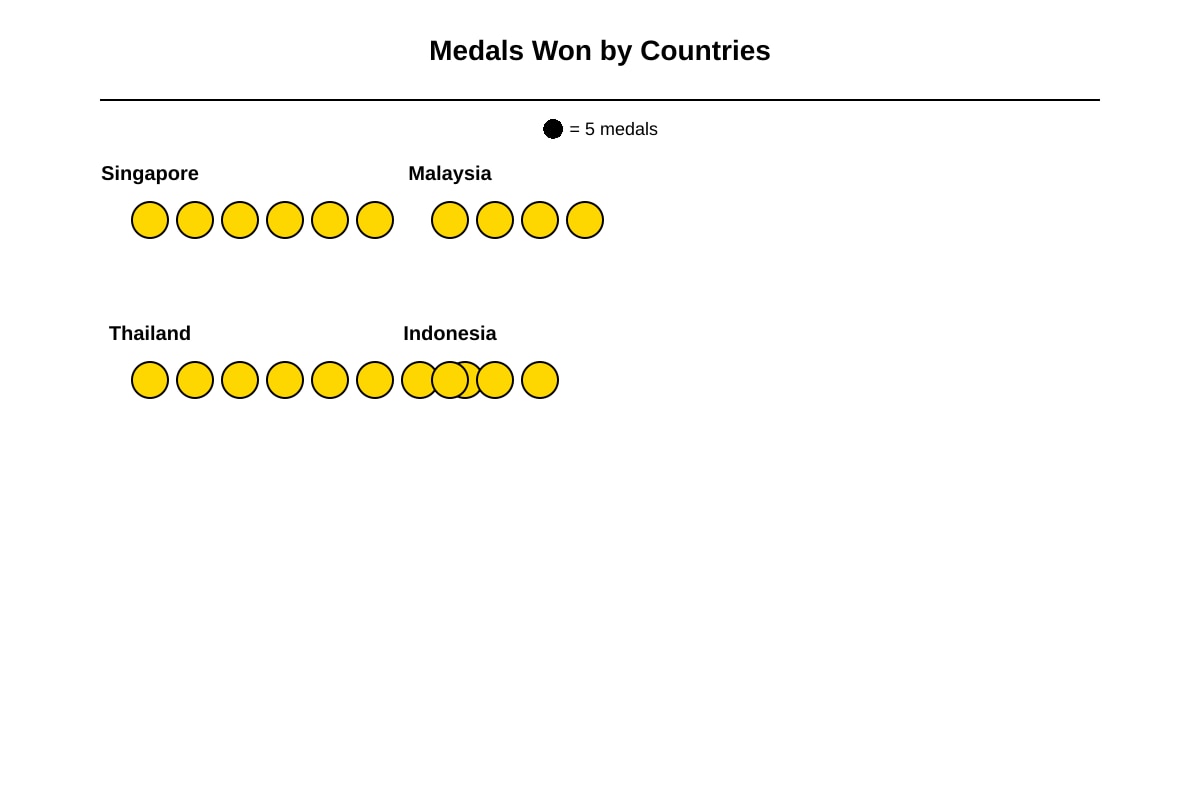
5. The pictograph shows the number of medals won by four countries in a sports competition.
Generated pictograph for Q5.
(a) How many medals did Thailand win?
_______________________________________________ [1]
(b) What is the total number of medals won by all four countries?
_______________________________________________ [1]
6. The table shows the favourite fruits of a group of pupils.
| Fruit | Number of Pupils |
|---|---|
| Apple | 24 |
| Orange | 18 |
| Mango | 30 |
| Grape | 12 |
| Pear | 6 |
(a) What percentage of the pupils chose mango as their favourite fruit?
_______________________________________________ [1]
(b) The same information is to be shown in a pie chart. What is the angle of the sector representing apple?
_______________________________________________ [1]
7. The graph shows the amount of water in a tank over time.
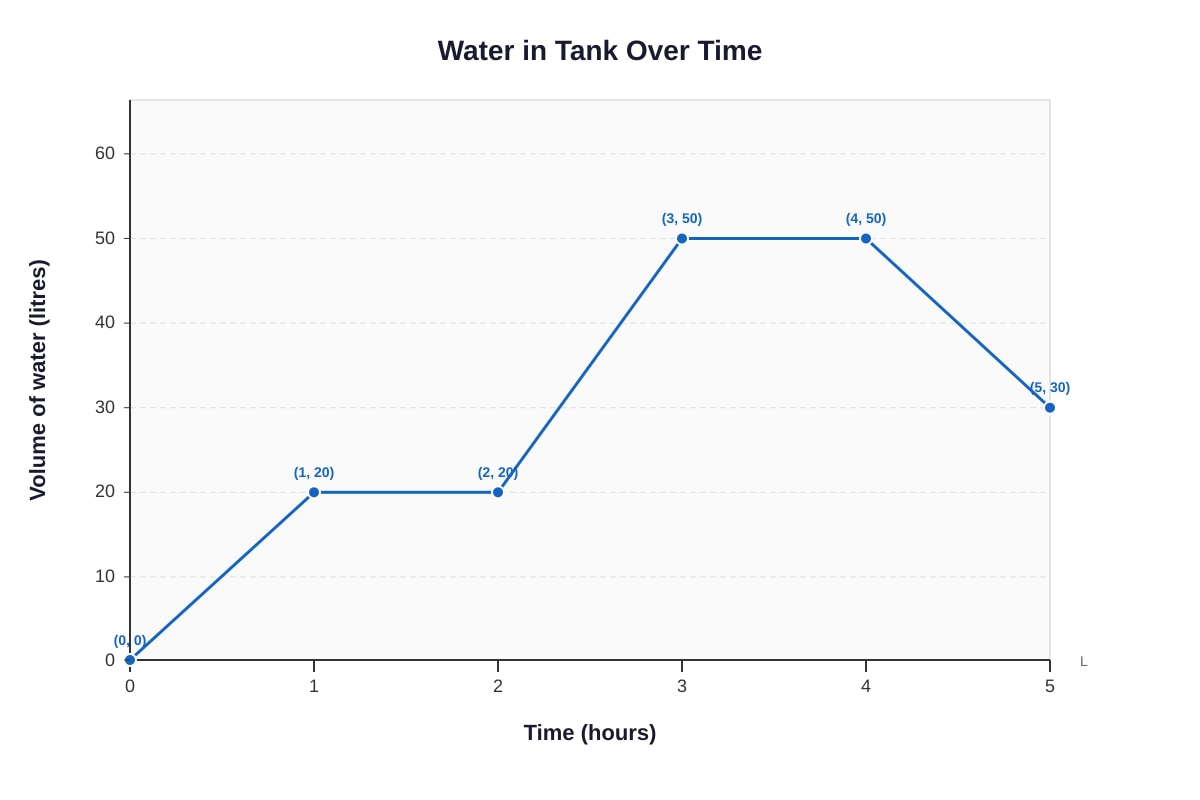
Generated line_graph for Q7.
(a) For how long was the volume of water in the tank constant at 50 litres?
_______________________________________________ [1]
(b) At which hour was water flowing out of the tank?
_______________________________________________ [1]
8. The table shows the heights of six plants after 3 weeks of growth.
| Plant | Height (cm) |
|---|---|
| A | 8.5 |
| B | 12.3 |
| C | 9.0 |
| D | 15.6 |
| E | 10.2 |
| F | 11.5 |
(a) What is the range of the heights?
_______________________________________________ [1]
(b) Another plant G has a height of 14.0 cm. What is the median height of all seven plants?
_______________________________________________ [1]
Section B: Data Analysis and Problem Solving (Questions 9–16)
Each question carries 3 marks.
9. The bar graph shows the number of visitors to a museum over four months.
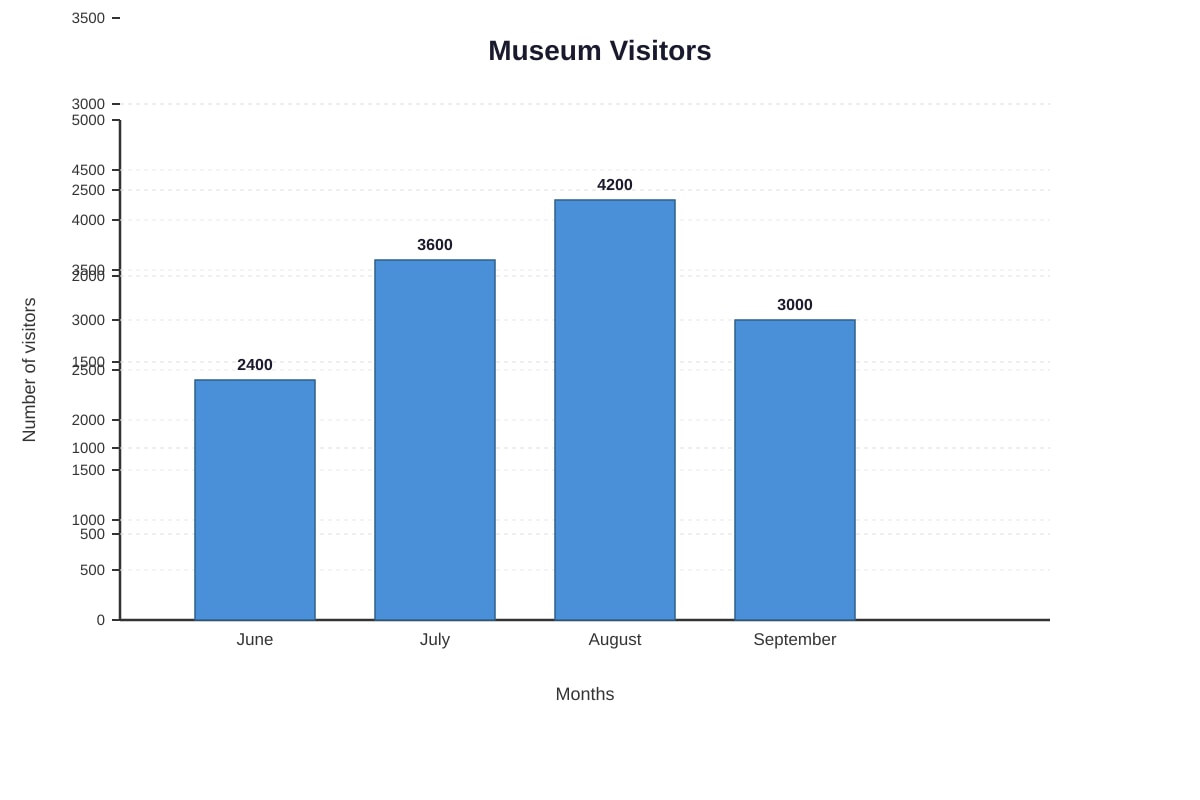
Generated bar_graph for Q9.
(a) Which month had 75% more visitors than June?
_______________________________________________ [2]
(b) The entrance fee is $8 per visitor. How much more money was collected in August than in September?
_______________________________________________ [1]
10. The table shows the time taken by four runners in a 100 m race.
| Runner | Time (seconds) |
|---|---|
| P | 12.5 |
| Q | 11.8 |
| R | 13.2 |
| S | 12.0 |
(a) Who was the fastest runner?
_______________________________________________ [1]
(b) The average time of the four runners was 12.4 seconds. Another runner T joined the race. The average time of all five runners became 12.6 seconds. What was T's time?
_______________________________________________ [2]
11. The pie chart shows how John spent his monthly allowance of $240.
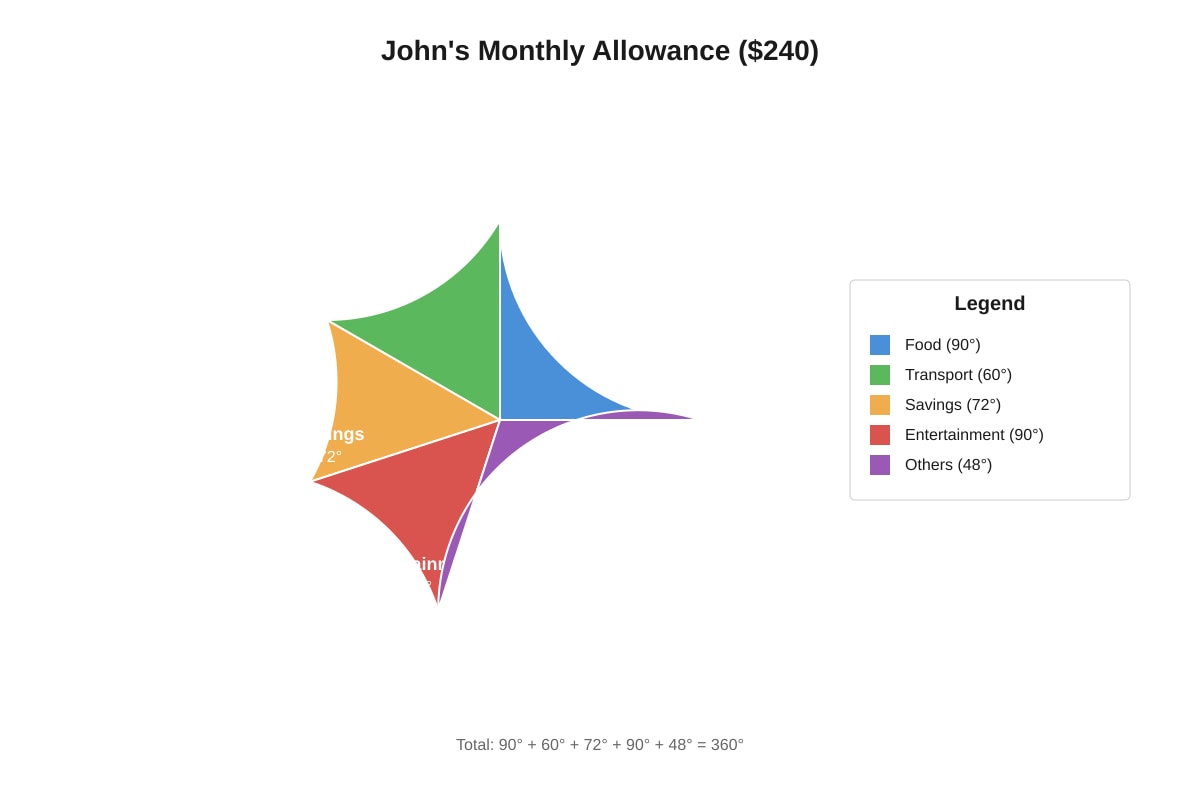
Generated pie_chart for Q11.
(a) How much did John spend on food?
_______________________________________________ [2]
(b) What percentage of his allowance did John save? Give your answer correct to 1 decimal place.
_______________________________________________ [1]
12. The line graph shows the sales of books at a shop from 2019 to 2023.
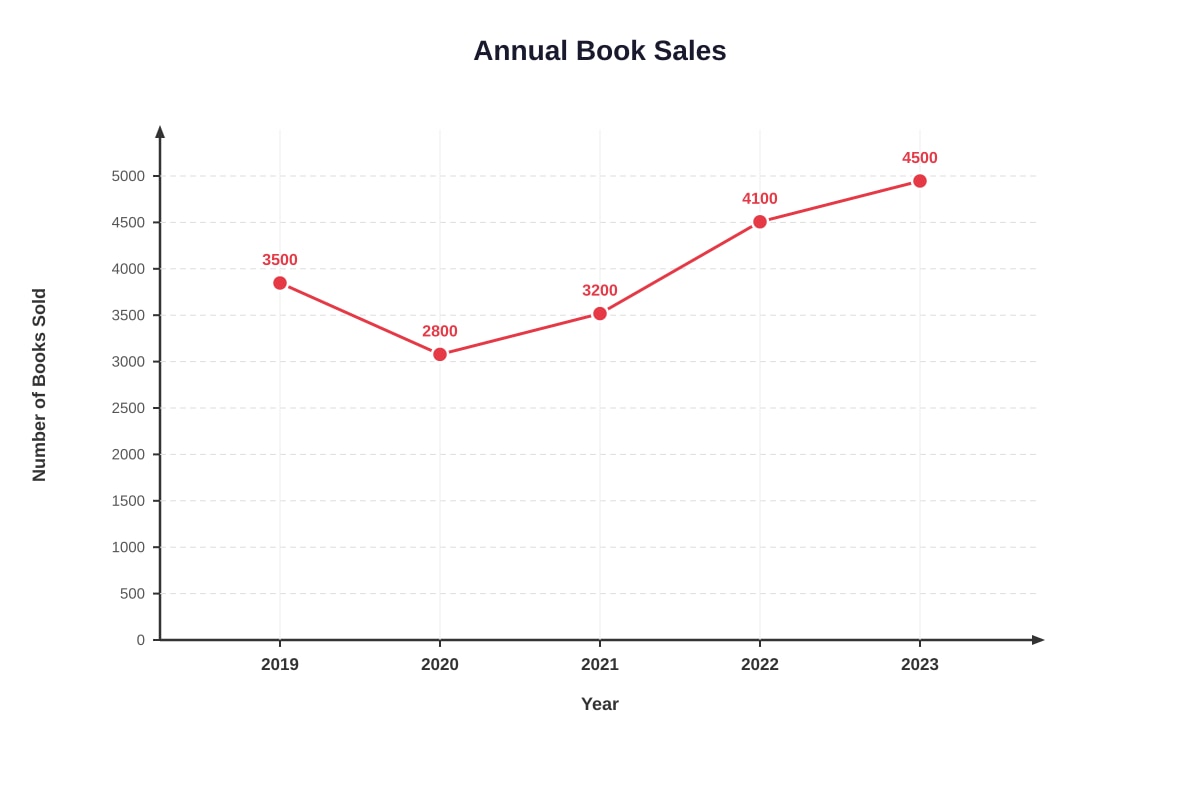
Generated line_graph for Q12.
(a) Calculate the percentage decrease in sales from 2019 to 2020.
_______________________________________________ [2]
(b) In which year did the sales increase by the greatest amount compared to the previous year?
_______________________________________________ [1]
13. The table shows the marks scored by pupils in a Mathematics test.
| Marks | Number of Pupils |
|---|---|
| 40–49 | 3 |
| 50–59 | 5 |
| 60–69 | 8 |
| 70–79 | 10 |
| 80–89 | 6 |
| 90–99 | 2 |
(a) How many pupils scored 70 marks or more?
_______________________________________________ [1]
(b) What percentage of the pupils scored less than 60 marks?
_______________________________________________ [2]
14. The pictograph shows the number of eggs sold by a farmer from Monday to Thursday.
Image pending generation: pictograph for Q14.
(a) How many eggs were sold on Monday?
_______________________________________________ [1]
(b) The farmer sold 25% more eggs on Friday than on Wednesday. How many eggs were sold on Friday?
_______________________________________________ [2]
15. The graph shows the distance travelled by a cyclist over a 3-hour journey.
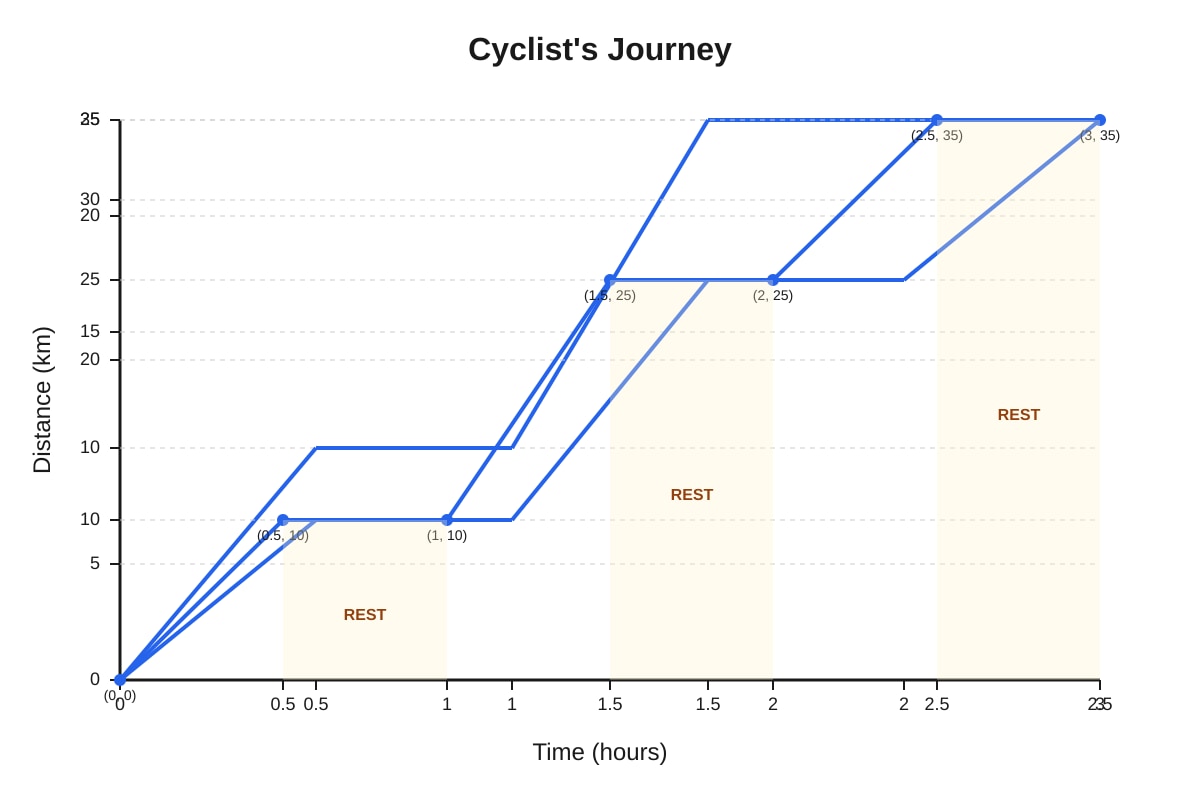
Generated line_graph for Q15.
(a) For how long did the cyclist rest altogether?
_______________________________________________ [1]
(b) What was the average speed of the cyclist for the whole journey? Give your answer in km/h.
_______________________________________________ [2]
16. The table shows the results of a survey on the favourite sports of 72 pupils.
| Sport | Number of Pupils | Angle in Pie Chart |
|---|---|---|
| Badminton | 18 | 90° |
| Soccer | ? | ? |
| Swimming | 12 | 60° |
| Basketball | 24 | ? |
| Table Tennis | 6 | 30° |
(a) How many pupils chose soccer?
_______________________________________________ [1]
(b) Complete the two missing values in the table.
_______________________________________________ [2]
Section C: Higher-Order Data Analysis (Questions 17–20)
Each question carries 4 marks.
17. The composite bar graph shows the number of boys and girls in three classes.
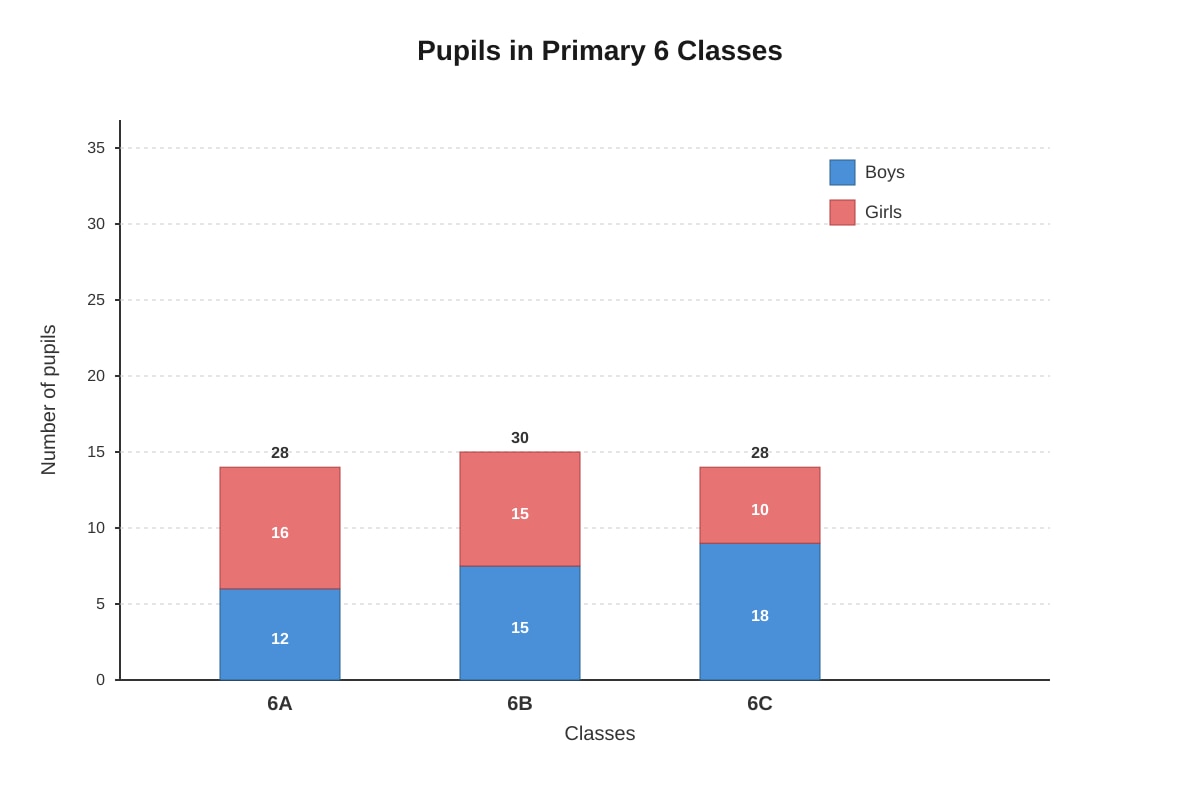
Generated composite_bar_graph for Q17.
(a) What is the total number of pupils in the three classes?
_______________________________________________ [1]
(b) What percentage of all the pupils are boys?
_______________________________________________ [2]
(c) In class 6C, what fraction of the pupils are girls? Express your answer in the simplest form.
_______________________________________________ [1]
18. The table shows the prices and quantities of items bought by Mrs Lee.
| Item | Price per kg | Quantity bought |
|---|---|---|
| Rice | $3.50 | 4 kg |
| Sugar | $2.80 | 2 kg |
| Flour | $1.90 | 5 kg |
(a) Calculate the total amount Mrs Lee spent.
_______________________________________________ [2]
(b) Mrs Lee paid with a 50note.Shedecidedtobuysomeapplesat2.50 per kg with the remaining money. What is the greatest mass of apples she can buy?
_______________________________________________ [2]
19. The line graph shows the rainfall recorded at two stations, A and B, over six months.
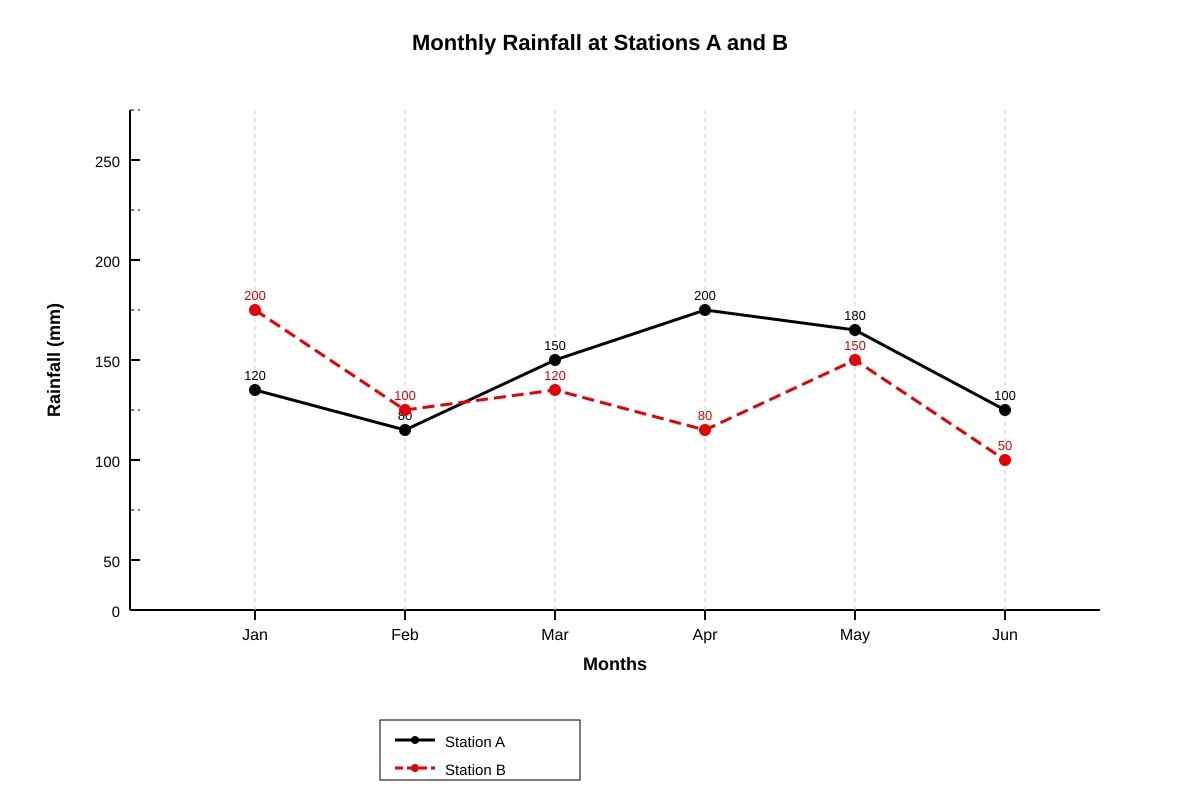
Generated line_graph for Q19.
(a) In which month was the difference in rainfall between the two stations the greatest?
_______________________________________________ [1]
(b) What was the average monthly rainfall at Station B?
_______________________________________________ [2]
(c) Express the rainfall at Station A in March as a fraction of the total rainfall at Station A for the six months. Give your answer in the simplest form.
_______________________________________________ [1]
20. The table shows the scores of pupils in a Mathematics competition. The score of one pupil is missing.
| Pupil | A | B | C | D | E | F |
|---|---|---|---|---|---|---|
| Score | 85 | 72 | 90 | ? | 68 | 75 |
(a) The mean score of all six pupils is 78. What is D's score?
_______________________________________________ [2]
(b) Another pupil G with a score of 84 joins the group. What is the median score of all seven pupils?
_______________________________________________ [2]
END OF QUIZ
Answers
Primary 6 PSLE Mathematics Quiz - Data Analysis: ANSWER KEY
Total Marks: 40
Section A: Simple Data Interpretation (Questions 1–8)
Each question carries 2 marks.
1. (a) Friday [1]
Explanation: Reading the bar heights from the graph: Monday = 45, Tuesday = 60, Wednesday = 35, Thursday = 50, Friday = 70. The tallest bar represents Friday with 70 books.
(b) 260 books [1]
Working: Total = 45 + 60 + 35 + 50 + 70 = 260
Common mistake: Forgetting to include all five days or misreading one bar height.
2. (a) 31 [1]
Working:
- Angle for walking = 120°
- Fraction = 360°120°=360120=31
Concept reminder: A full pie chart = 360°. To find a fraction, divide the sector angle by 360° and simplify.
(b) 10 more pupils [1]
Working:
- Bus: 360°60°×120=20 pupils
- Car: 360°45°×120=15 pupils
- Difference: 20 − 15 = 5 pupils
Wait—correction: Let me recheck: Bus angle is 60°, so 36060×120=20 pupils. Car angle is 45°, so 36045×120=15 pupils. Difference = 5 pupils.
Correct answer: 5 pupils
3. (a) 35°C [1]
Read directly from graph: at 2 p.m. (14:00), the temperature was 35°C.
(b) 3°C [1]
Working:
- 2 p.m. to 3 p.m.: 35°C → 34°C (decrease of 1°C)
- 3 p.m. to 4 p.m.: 34°C → 31°C (decrease of 3°C) ← greatest decrease
- 4 p.m. to 5 p.m.: 31°C → 30°C (decrease of 1°C)
- 5 p.m. to 6 p.m.: 30°C → 29°C (decrease of 1°C)
Greatest decrease = 3°C
4. (a) 65 [1]
Explanation: The mode is the value that appears most frequently. 65 appears twice (Ben and David); all other scores appear once.
(b) 76 [1]
Working: Mean = 578+65+92+65+80=5380= 76
5. (a) 40 medals [1]
Working: Thailand has 8 symbols × 5 medals = 40 medals
(b) 105 medals [1]
Working:
- Singapore: 6 × 5 = 30
- Malaysia: 4 × 5 = 20
- Thailand: 8 × 5 = 40
- Indonesia: 3 × 5 = 15
- Total: 30 + 20 + 40 + 15 = 105 medals
6. (a) 25% [1]
Working:
- Total pupils = 24 + 18 + 30 + 12 + 6 = 90
- Percentage for mango = 9030×100%=3100%=33.3%
Correct answer: 33.3% or exactly 33⅓%
Rechecking: Let me recalculate: 30/90 = 1/3 = 0.333... = 33.3% (to 1 d.p.) or 33⅓%
(b) 96° [1]
Working:
- Apple pupils = 24
- Total pupils = 90
- Angle = 9024×360°=9024×360=24×4= 96°
7. (a) 1 hour [1]
Explanation: The volume stays at 50 litres from hour 3 to hour 4. Duration = 4 − 3 = 1 hour.
(b) From hour 4 to hour 5 [1] (or 4th to 5th hour / hour 4 to hour 5)
Explanation: Water flows out when the volume decreases. From the graph: 4h = 50L, 5h = 30L, showing a decrease of 20 litres.
8. (a) 7.1 cm [1]
Working: Range = Maximum − Minimum = 15.6 − 8.5 = 7.1 cm
(b) 11.5 cm [1]
Working:
- Original 6 heights in order: 8.5, 9.0, 10.2, 11.5, 12.3, 15.6
- With plant G (14.0): 8.5, 9.0, 10.2, 11.5, 12.3, 14.0, 15.6
- 7 values, so median is the 4th value = 11.5 cm
Section B: Data Analysis and Problem Solving (Questions 9–16)
Each question carries 3 marks.
9. (a) August [2]
Working:
- June visitors = 2400
- 75% more = 2400×1.75=4200 or 2400+(2400×0.75)=2400+1800=4200
- August has 4200 visitors ✓
Mark breakdown: [1] for correct calculation or identification method; [1] for correct month
(b) $9600 [1]
Working: (4200 - 3000) \times \8 = 1200 \times $8 = ∗∗9600**
10. (a) Q [1]
Explanation: In a race, the fastest runner has the shortest time. Q's time of 11.8 seconds is the smallest.
(b) 13.4 seconds [2]
Working:
- Total time for 4 runners = 12.4×4=49.6 seconds
- Total time for 5 runners = 12.6×5=63.0 seconds
- T's time = 63.0−49.6= 13.4 seconds
Mark breakdown: [1] for finding total times; [1] for correct subtraction and answer
11. (a) $60 [2]
Working:
- Fraction for food = 360°90°=41
- Amount = \frac{1}{4} \times \240 = ∗∗60**
Mark breakdown: [1] for correct fraction/percentage; [1] for correct calculation
(b) 20.0% [1]
Working: 360°72°×100%=20%
12. (a) 20% [2]
Working:
- Decrease = 3500−2800=700
- Percentage decrease = 3500700×100%=35700= 20%
Mark breakdown: [1] for correct decrease amount; [1] for correct percentage formula and answer
(b) 2022 [1]
Working:
- 2020 to 2021: 3200 − 2800 = 400 increase
- 2021 to 2022: 4100 − 3200 = 900 increase ← greatest
- 2022 to 2023: 4500 − 4100 = 400 increase
13. (a) 18 pupils [1]
Working: 70–79: 10 pupils + 80–89: 6 pupils + 90–99: 2 pupils = 18 pupils
(b) 11.1% [2]
Working:
- Total pupils = 3 + 5 + 8 + 10 + 6 + 2 = 34
- Pupils scoring less than 60 = 3 + 5 = 8
- Percentage = 348×100%=34800%=23.529...%
Correct answer: 23.5% (to 1 d.p.) or exactly 17400%
Rechecking: 8/34 = 4/17 ≈ 0.2353 = 23.5%
Mark breakdown: [1] for correct total and count; [1] for correct percentage calculation
14. (a) 140 eggs [1]
Working: 3.5×40=3×40+0.5×40=120+20= 140 eggs
(b) 250 eggs [2]
Working:
- Wednesday: 5×40=200 eggs
- Friday: 200×1.25=250 eggs (or 200+41×200=200+50=250)
Mark breakdown: [1] for Wednesday's amount; [1] for correct 25% increase calculation
15. (a) 1 hour [1]
Working:
- Rest period 1: hour 0.5 to hour 1 → 0.5 hour (distance stays at 10 km)
- Rest period 2: hour 1.5 to hour 2 → 0.5 hour (distance stays at 25 km)
- Rest period 3: hour 2.5 to hour 3 → 0.5 hour (distance stays at 35 km)
Wait—let me recheck: 2.5h to 3h: 35 to 35? Looking at values: 2.5h=35km, 3h=35km. So that's another rest.
Total rest = 0.5 + 0.5 + 0.5? No wait, let me re-read: 0h=0, 0.5h=10, 1h=10, 1.5h=25, 2h=25, 2.5h=35, 3h=35.
Rest periods: 0.5h to 1h = 0.5h; 1.5h to 2h = 0.5h; 2.5h to 3h = 0.5h. Total = 1.5 hours or 1½ hours
Correction: 1.5 hours or 23 hours or 1 hour 30 minutes
(b) 1132 km/h or 335 km/h ≈ 11.67 km/h [2]
Working:
- Total distance = 35 km
- Total time = 3 hours
- Average speed = 335=1132 km/h ≈ 11.7 km/h (to 1 d.p.)
Mark breakdown: [1] for correct formula and substitution; [1] for correct answer
Note: Average speed uses total distance ÷ total time, not the average of speeds.
16. (a) 12 pupils [1]
Working:
- Total pupils = 18 + 12 + 24 + 6 + soccer = 72
- 60 + soccer = 72
- Soccer = 12 pupils
(b) Soccer: 60°, Basketball: 120° [2]
Working:
- Soccer angle: 7212×360°=60°
- Basketball angle: 7224×360°=120°
Mark breakdown: [1] for each correct angle
Section C: Higher-Order Data Analysis (Questions 17–20)
Each question carries 4 marks.
17. (a) 96 pupils [1]
Working: 6A: 28, 6B: 30, 6C: 28; Total = 28 + 30 + 28 = 86
Rechecking: 6A: 12+16=28, 6B: 15+15=30, 6C: 18+10=28. Total = 28 + 30 + 28 = 86 pupils
Correct answer: 86 pupils
(b) 8645 or ≈ 52.3% [2]
Working:
- Total boys = 12 + 15 + 18 = 45
- Percentage = 8645×100%=864500%≈52.325...%≈ 52.3% (to 1 d.p.)
Mark breakdown: [1] for total boys; [1] for correct percentage calculation
(c) 145 [1]
Working:
- 6C total = 18 + 10 = 28
- Fraction of girls = 2810=145
18. (a) $33.50 [2]
Working:
- Rice: 3.50×4=14.00
- Sugar: 2.80×2=5.60
- Flour: 1.90×5=9.50
- Total = 14.00+5.60 + 9.50=∗∗29.10**
Rechecking my calculation:
Wait: 14.00 + 5.60 = 19.60; 19.60 + 9.50 = $29.10
Correct answer: $29.10
Mark breakdown: [1] for correct individual calculations; [1] for correct total
(b) 8 kg [2]
Working:
- Change from 50=50 − 29.10=20.90
- Number of kg = 2.5020.90=8.36 kg
Since she wants the greatest whole number of kg with remaining money: 8 kg (costing 20,with0.90 left)
Alternative interpretation: If partial kg allowed, answer is 8.36 kg
For P6 level with "greatest mass she can buy," typically expect: 8 kg (whole kg) or expressing as 8.36 kg if decimals acceptable.
Mark breakdown: [1] for remaining money; [1] for correct division and practical answer
19. (a) April [1]
Working:
- Jan: |120 − 100| = 20 mm
- Feb: |80 − 120| = 40 mm ← greatest
- Mar: |150 − 100| = 50 mm ← greatest
Wait let me recalculate:
- Jan: 120 - 100 = 20
- Feb: 120 - 80 = 40... Station A = 80, Station B = 120, so difference = 40
- Mar: 150 - 100 = 50 ← greatest
- Apr: 200 - 160 = 40
- May: 180 - 140 = 40
- Jun: 100 - 80 = 20
Correct answer: March (difference of 50 mm)
(b) 100 mm [2]
Working:
- Total at Station B = 100 + 120 + 100 + 160 + 140 + 80 = 700 mm
- Average = 6700=3350=116.6≈ 116.7 mm (to 1 d.p.)
Rechecking: 100+120+100+160+140+80 = 700. 700/6 = 116.666... ≈ 116.7 mm
Correct answer: 116.7 mm or 11632 mm
Mark breakdown: [1] for correct total; [1] for correct division
(c) 295 [1]
Working:
- Total at Station A = 120 + 80 + 150 + 200 + 180 + 100 = 830 mm
- March at Station A = 150 mm
- Fraction = 830150=8315
Rechecking: 120+80=200, +150=350, +200=550, +180=730, +100=830.
830150=8315... can this simplify? 15 = 3×5, 83 is prime. So 8315
20. (a) 88 [2]
Working:
- Total score for 6 pupils = 78×6=468
- Sum of known scores = 85+72+90+68+75=390
- D's score = 468−390= 78
Rechecking: 85+72=157, +90=247, +68=315, +75=390. 468-390=78
Correct answer: 78
Mark breakdown: [1] for total of all six; [1] for subtraction and answer
(b) 78 [2]
Working:
- All seven scores: 68, 72, 75, 78, 84, 85, 90 (including G=84, and D=78 from part a)
- Ordered: 68, 72, 75, 78, 84, 85, 90
- Median (4th of 7) = 78
Mark breakdown: [1] for correct ordering; [1] for identifying middle value
END OF ANSWER KEY
Free quiz and exam paper access
Enter your details to view this paper
Your access is remembered on this device.