From Real Exams Quiz
Primary 6 PSLE Mathematics Data Analysis Quiz
Free P6 PSLE Maths Data Analysis quiz, Nemo3 Exam version, with questions, answers, and PSLE-focused practice for Singapore students.
These static practice materials are generated from the site's syllabus and paper-generation workflow, with source and model context shown so students and parents can evaluate the material before use.
Questions
Primary 6 PSLE Mathematics Quiz - Data Analysis
Name: ___________________________
Class: Primary 6 _______
Date: _______________
Score: _______ / 40
Duration: 45 minutes
Total Marks: 40
Instructions:
- Answer all questions.
- Show your working clearly in the spaces provided.
- Write your answers in the spaces provided.
- The number of marks is given in brackets [ ] at the end of each question or part question.
Section A: Multiple-Choice Questions (10 marks)
Questions 1 to 5 carry 2 marks each. For each question, four options are given. Choose the correct answer and write its number (1, 2, 3 or 4) in the brackets provided.
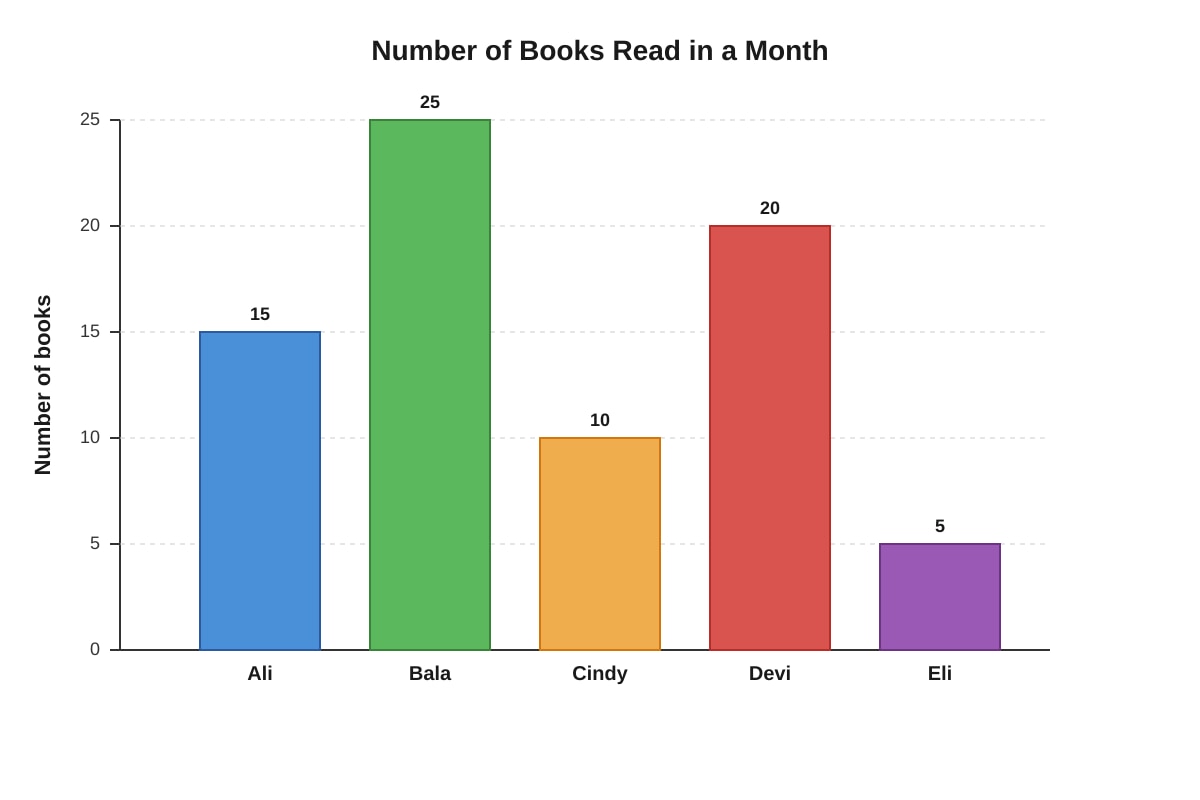
1. The bar graph below shows the number of books read by five students in a month.
Generated bar_chart for Q1.
What is the average number of books read by the five students?
(1) 12
(2) 15
(3) 18
(4) 20
Answer: (_______) [2]
2. The table below shows the number of stamps collected by four children.
| Child | Number of Stamps |
|---|---|
| Ahmad | 48 |
| Bala | 36 |
| Cindy | 54 |
| Devi | 42 |
What is the difference between the highest and the lowest number of stamps collected?
(1) 6
(2) 12
(3) 18
(4) 24
Answer: (_______) [2]
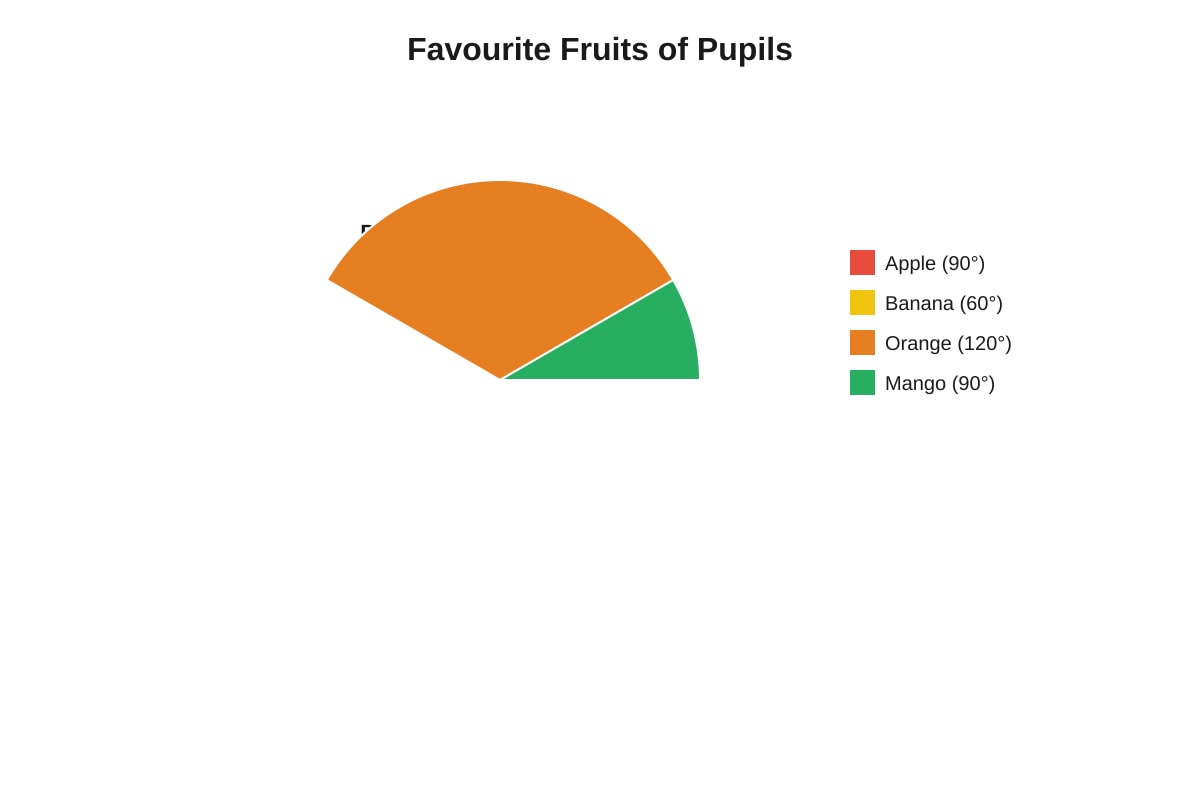
3. The pie chart below shows the favourite fruits of a group of pupils.
Generated pie_chart for Q3.
If 40 pupils chose Orange as their favourite fruit, how many pupils chose Apple?
(1) 20
(2) 30
(3) 40
(4) 60
Answer: (_______) [2]
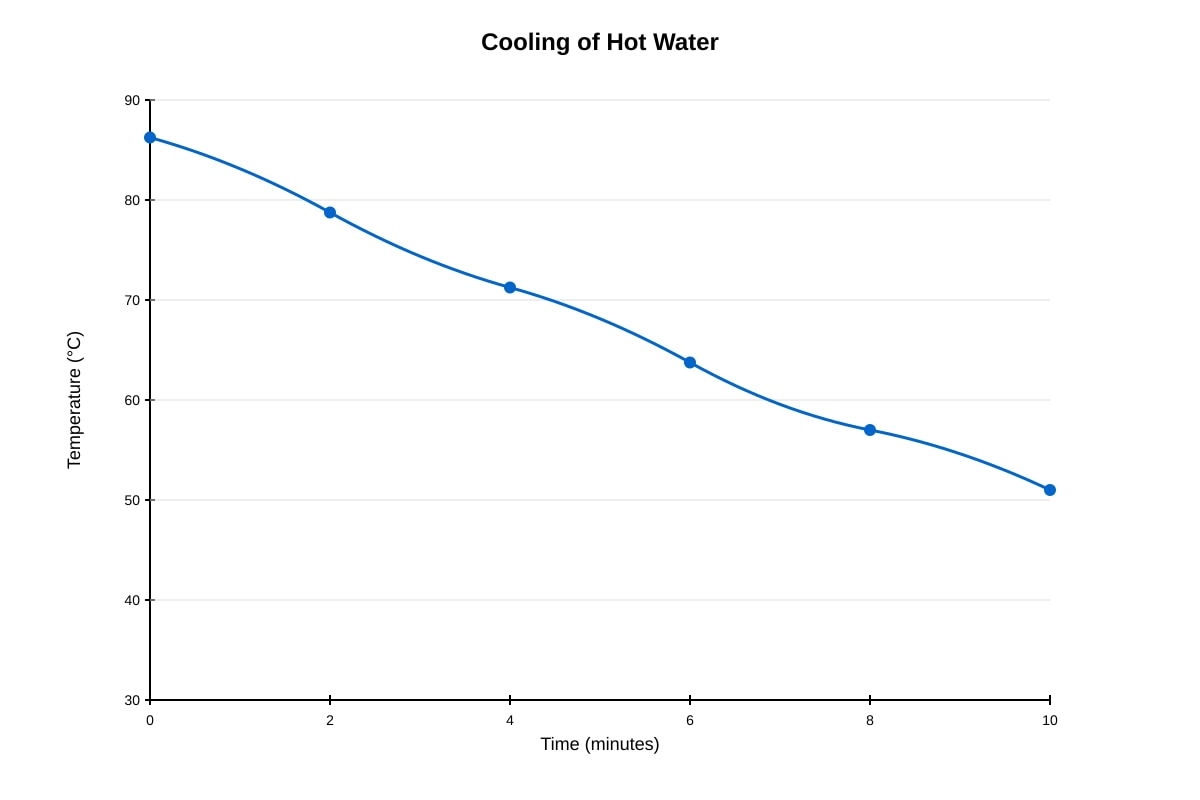
4. The line graph below shows the temperature of a cup of hot water as it cools over time.
Generated line_graph for Q4.
Between which two consecutive time intervals did the temperature drop the most?
(1) 0 to 2 minutes
(2) 2 to 4 minutes
(3) 6 to 8 minutes
(4) 8 to 10 minutes
Answer: (_______) [2]
5. The table below shows the number of cars passing a checkpoint each hour from 8 a.m. to 12 p.m.
| Time | 8 a.m. | 9 a.m. | 10 a.m. | 11 a.m. | 12 p.m. |
|---|---|---|---|---|---|
| Number of cars | 45 | 60 | 55 | 70 | 50 |
What is the average number of cars passing the checkpoint per hour?
(1) 52
(2) 56
(3) 58
(4) 60
Answer: (_______) [2]
Section B: Short-Answer Questions (15 marks)
Questions 6 to 12 carry 1 to 3 marks each. Show your working clearly and write your answers in the spaces provided.
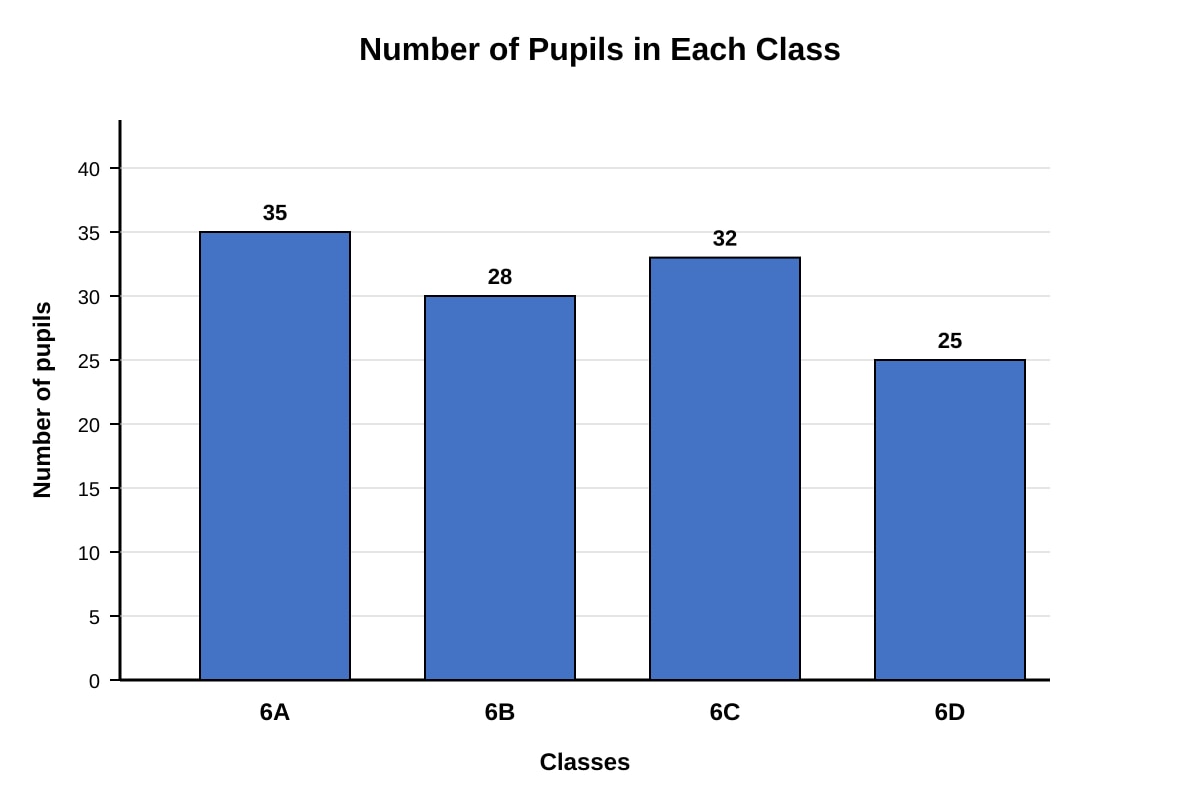
6. The bar graph below shows the number of pupils in each of four classes.
Generated bar_chart for Q6.
(a) How many pupils are there in Class 6A and Class 6C altogether?
Answer: _______________ [1]
(b) What is the difference between the class with the most pupils and the class with the least pupils?
Answer: _______________ [1]
7. The pie chart below shows how John spent his pocket money last week.
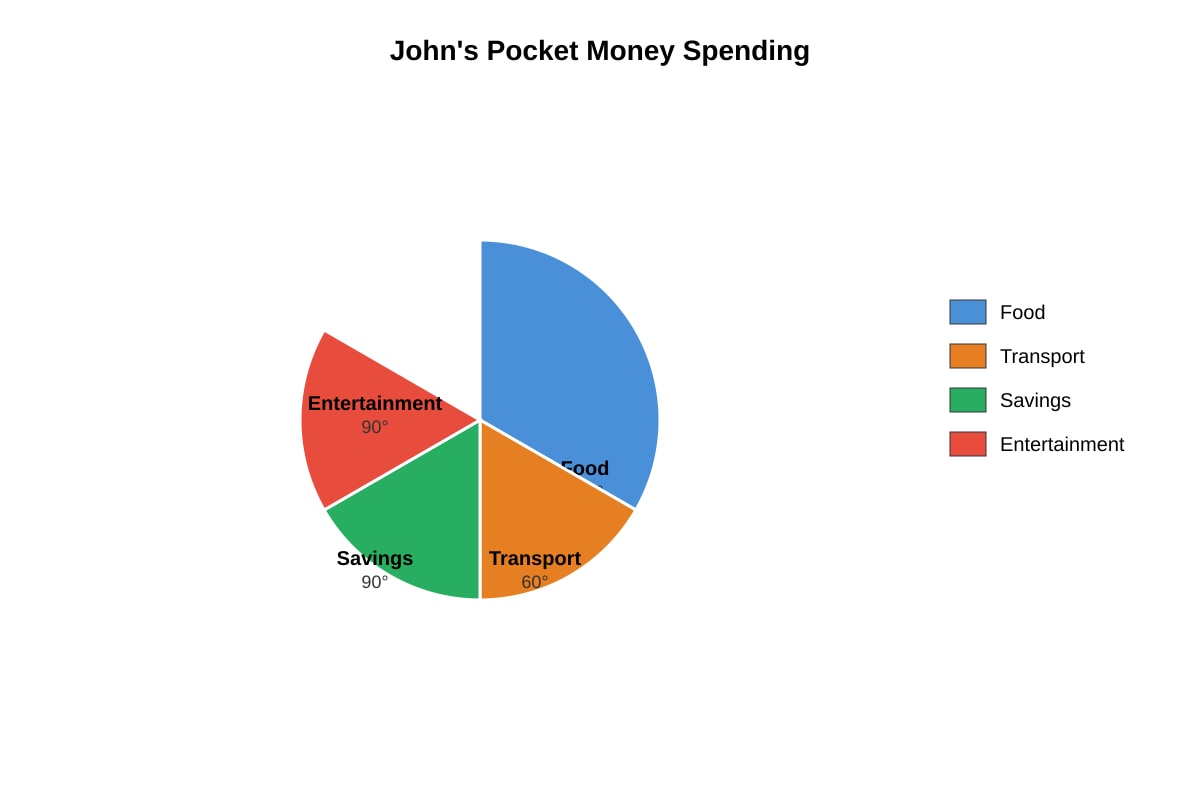
Generated pie_chart for Q7.
John received $60 as pocket money last week.
(a) What fraction of his pocket money did he spend on Food?
Answer: _______________ [1]
(b) How much money did he save?
Answer: $_______________ [2]
8. The table below shows the number of storybooks read by pupils in a class.
| Number of storybooks | 0 | 1 | 2 | 3 | 4 |
|---|---|---|---|---|---|
| Number of pupils | 3 | 5 | 8 | 4 | 2 |
(a) How many pupils are there in the class?
Answer: _______________ [1]
(b) What is the total number of storybooks read by the whole class?
Answer: _______________ [2]
9. The line graph below shows the height of a plant over 6 weeks.
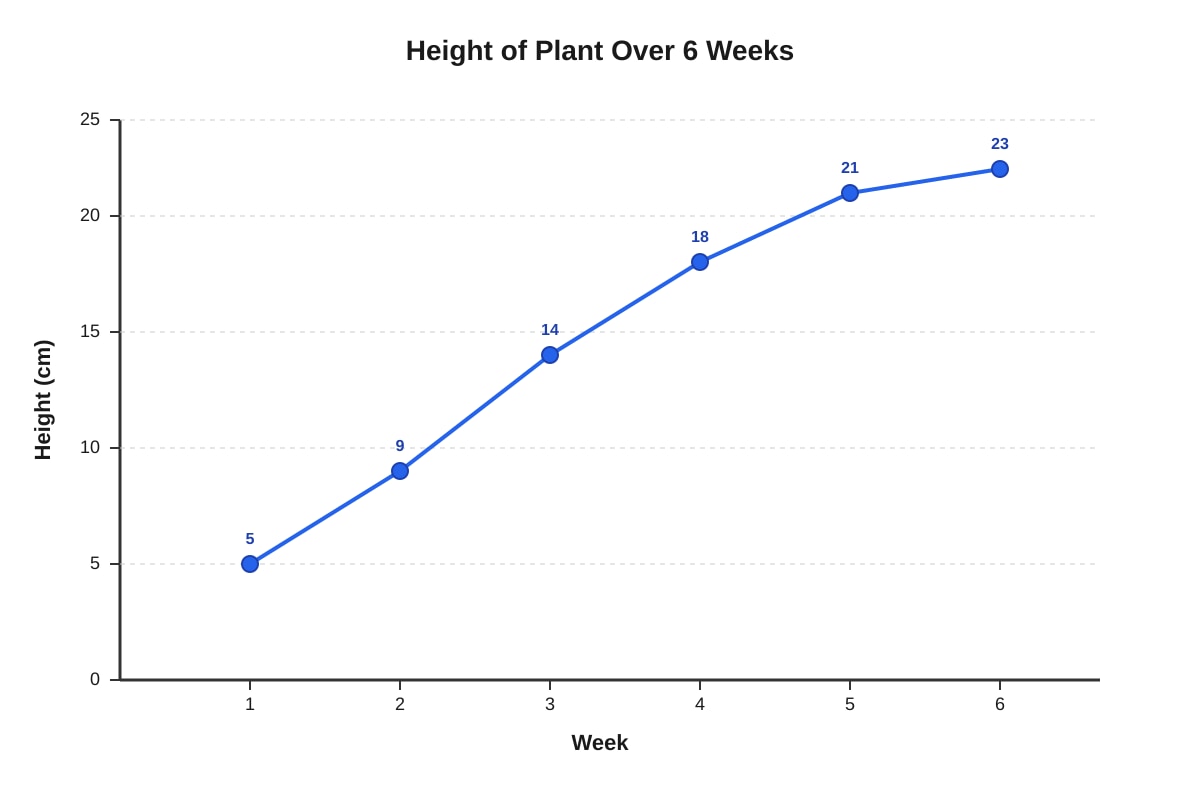
Generated line_graph for Q9.
(a) What was the height of the plant at Week 3?
Answer: _______________ cm [1]
(b) Between which two consecutive weeks did the plant grow the most?
Answer: Between Week _______ and Week _______ [1]
(c) What was the average growth per week from Week 1 to Week 6?
Answer: _______________ cm [2]
10. The bar graph below shows the number of visitors to a library from Monday to Friday.
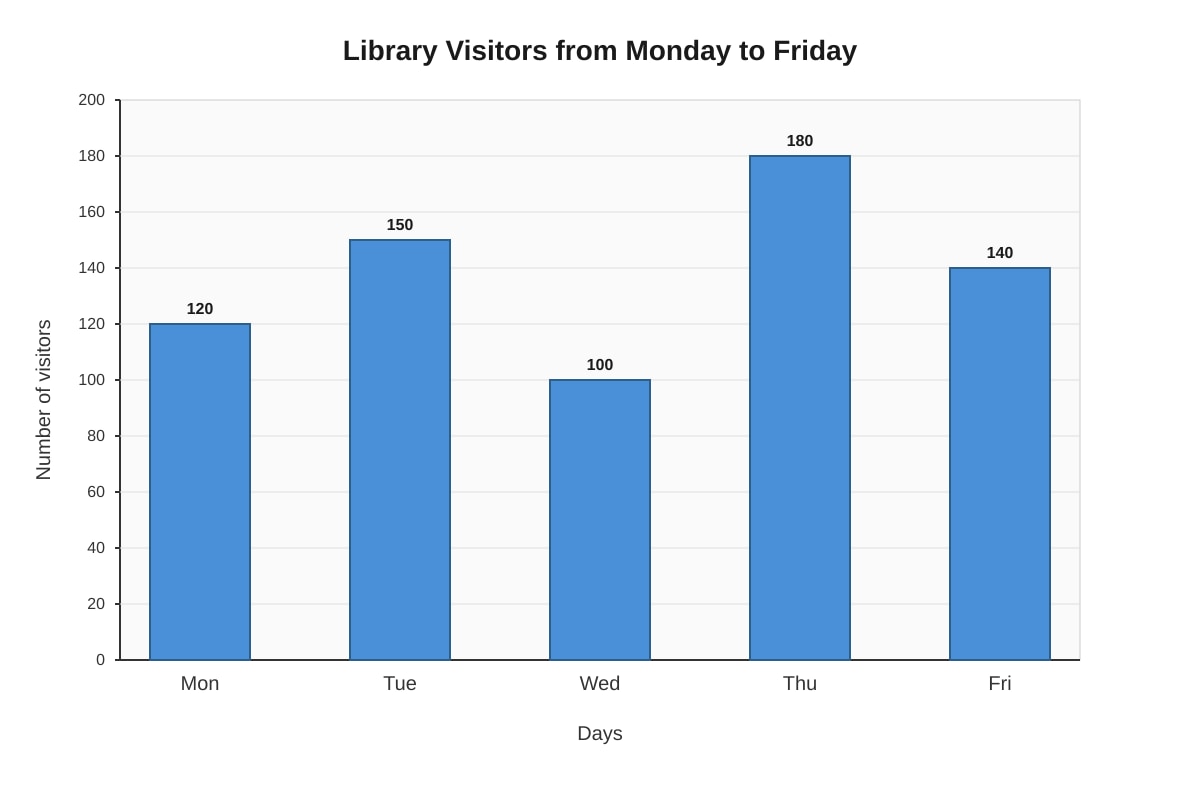
Generated bar_chart for Q10.
(a) On which day were there the most visitors?
Answer: _______________ [1]
(b) What was the total number of visitors from Monday to Friday?
Answer: _______________ [2]
(c) If the library had 20% more visitors on Saturday than on Friday, how many visitors were there on Saturday?
Answer: _______________ [2]
11. The table below shows the masses of five parcels.
| Parcel | A | B | C | D | E |
|---|---|---|---|---|---|
| Mass (kg) | 2.5 | 3.2 | 1.8 | 4.1 | 2.9 |
(a) What is the total mass of the five parcels?
Answer: _______________ kg [1]
(b) What is the average mass of the parcels?
Answer: _______________ kg [2]
12. The pie chart below shows the types of pets owned by families in a neighbourhood.
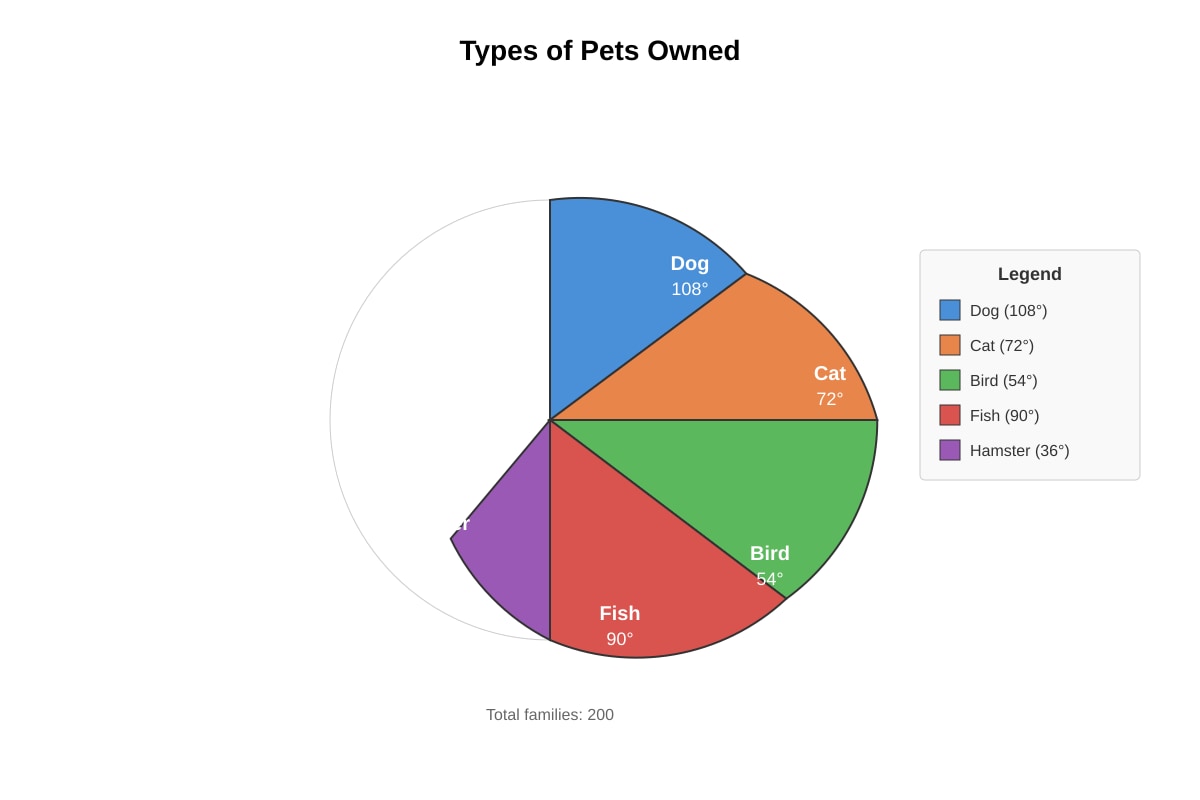
Generated pie_chart for Q12.
There are 200 families in the neighbourhood.
(a) How many families own a Dog?
Answer: _______________ [2]
(b) How many more families own a Dog than a Hamster?
Answer: _______________ [2]
13. The table below shows the number of goals scored by a football team in 10 matches.
| Match | 1 | 2 | 3 | 4 | 5 | 6 | 7 | 8 | 9 | 10 |
|---|---|---|---|---|---|---|---|---|---|---|
| Goals | 2 | 1 | 3 | 0 | 2 | 4 | 1 | 2 | 3 | 2 |
(a) What is the mode of the number of goals scored?
Answer: _______________ [1]
(b) What is the median number of goals scored?
Answer: _______________ [2]
(c) If the team scores 5 goals in the 11th match, what will be the new mean number of goals per match?
Answer: _______________ [2]
14. The bar graph below shows the number of books borrowed from a school library by Primary 1 to Primary 6 pupils.
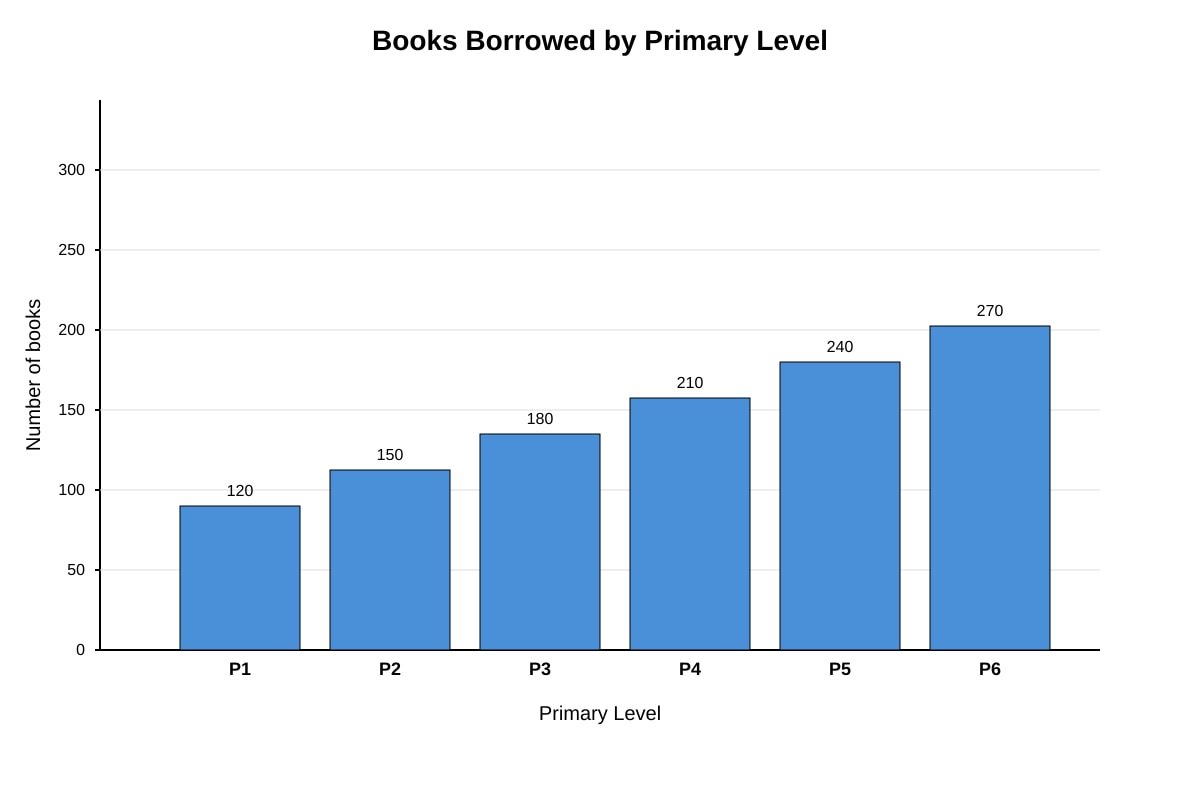
Generated bar_chart for Q14.
(a) How many more books did Primary 6 pupils borrow than Primary 1 pupils?
Answer: _______________ [1]
(b) What is the total number of books borrowed by all six levels?
Answer: _______________ [2]
(c) If the library has 1500 books in total, what percentage of the books were borrowed?
Answer: _______________ % [2]
15. The line graph below shows the distance travelled by a car over 5 hours.
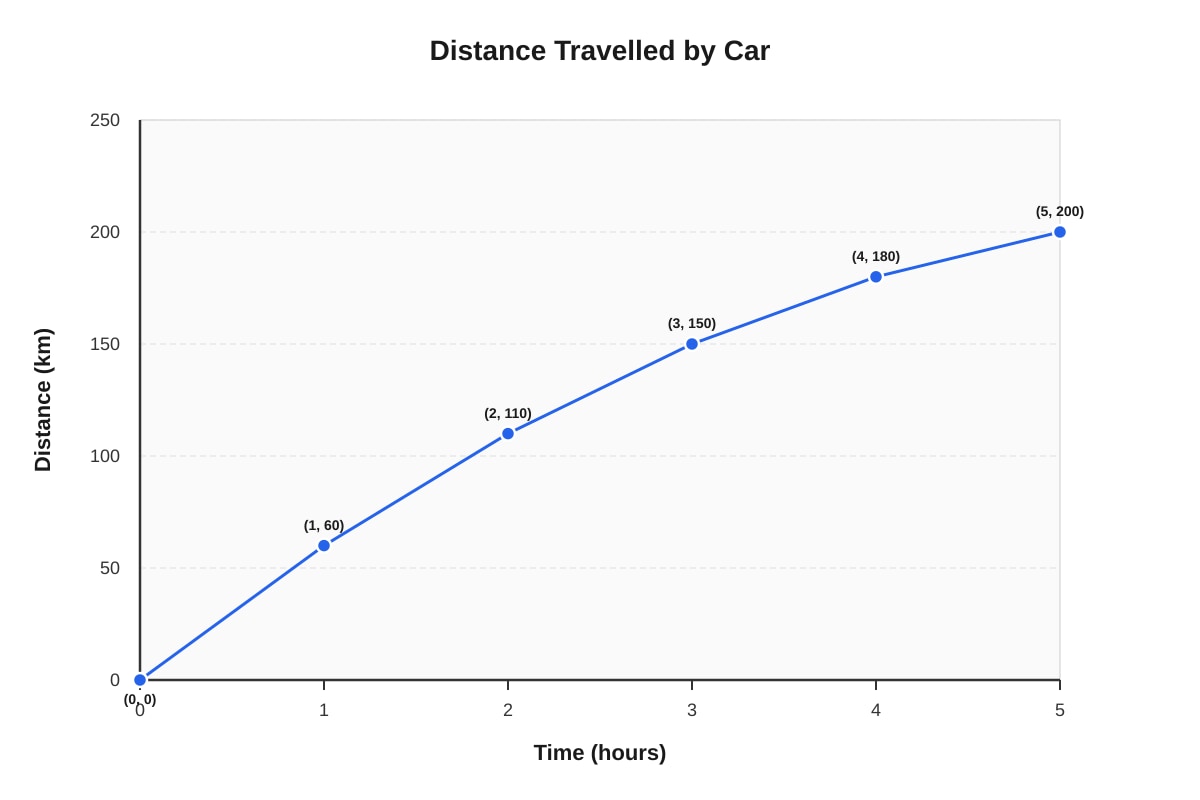
Generated line_graph for Q15.
(a) What was the speed of the car between the 1st and 2nd hour?
Answer: _______________ km/h [1]
(b) During which one-hour interval was the car travelling at the lowest speed?
Answer: Between hour _______ and hour _______ [1]
(c) What was the average speed of the car for the whole journey?
Answer: _______________ km/h [2]
Section C: Long-Answer Questions (15 marks)
Questions 16 to 20 carry 3 to 5 marks each. Show your working clearly and write your answers in the spaces provided.
16. The table below shows the number of muffins sold at a bakery from Monday to Sunday.
| Day | Mon | Tue | Wed | Thu | Fri | Sat | Sun |
|---|---|---|---|---|---|---|---|
| Number of muffins | 45 | 52 | 38 | 60 | 55 | 80 | 70 |
(a) What is the average number of muffins sold per day for the whole week?
Answer: _______________ [2]
(b) The bakery sold 20% more muffins on Saturday than on Friday. Verify if this statement is correct.
Answer: _______________ [2]
(c) If each muffin is sold at 2.50,howmuchmoneydidthebakerycollectfrommuffinsalesonSunday?Answer:_______________ [1]
17. The line graph below shows the amount of water in a tank over 8 hours. Water flows into the tank at a constant rate for the first 4 hours, then water is drained out at a constant rate for the next 4 hours.
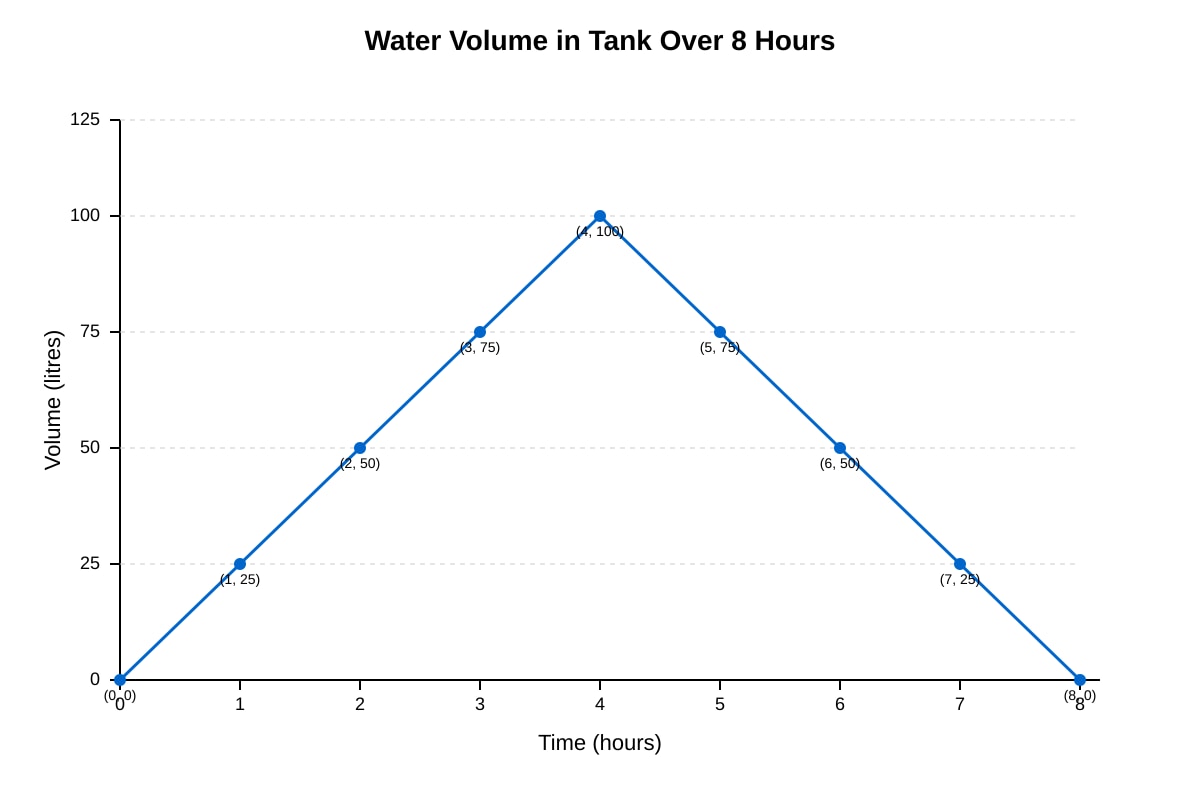
Generated line_graph for Q17.
(a) At what rate (in litres per hour) does water flow into the tank?
Answer: _______________ litres/hour [1]
(b) At what rate (in litres per hour) is water drained out of the tank?
Answer: _______________ litres/hour [1]
(c) What is the total amount of water that flowed into the tank during the 8 hours?
Answer: _______________ litres [1]
(d) If the tank had a leak and lost 5 litres per hour throughout the 8 hours, what would be the volume of water in the tank at the end of 8 hours?
Answer: _______________ litres [2]
18. The bar graph below shows the number of participants in a school's CCA groups.
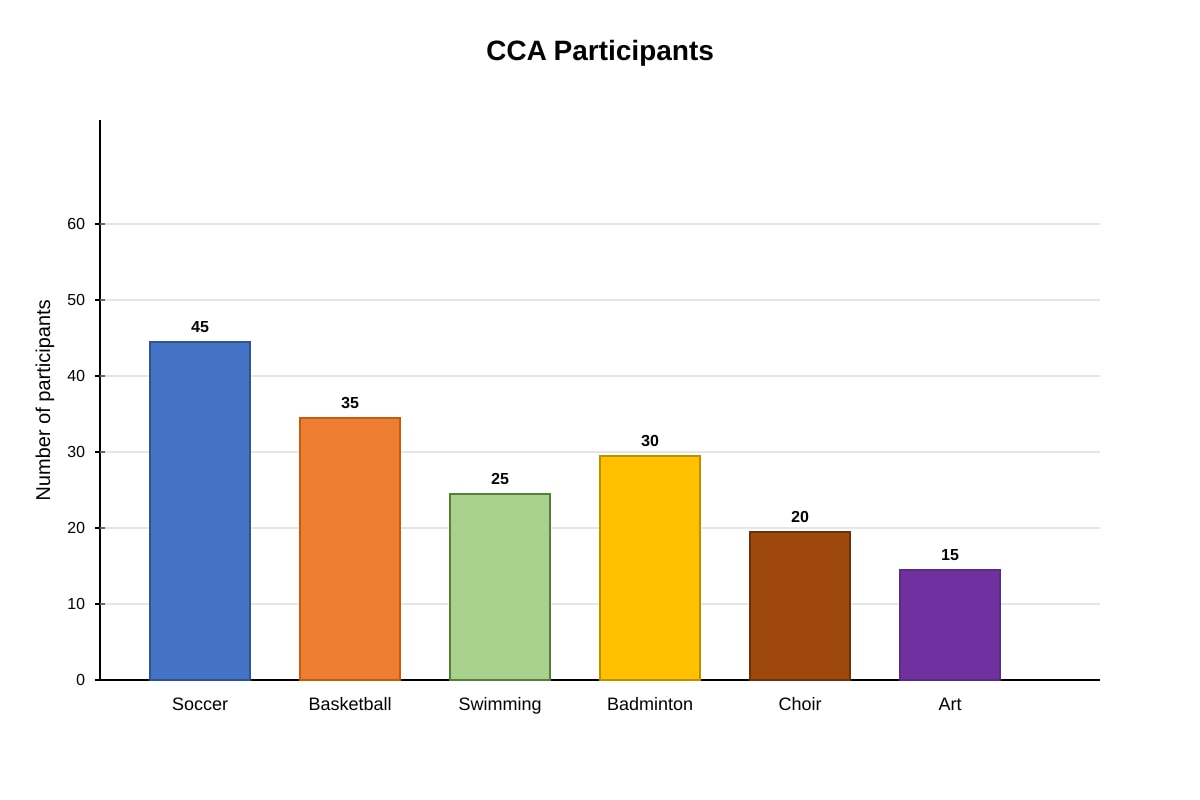
Generated bar_chart for Q18.
(a) What fraction of the total participants are in Soccer? Express your answer in the simplest form.
Answer: _______________ [2]
(b) The school wants to form teams of 5 for Soccer and teams of 7 for Basketball. How many complete teams can be formed for each CCA?
Answer: Soccer: _______________ teams, Basketball: _______________ teams [2]
(c) If 10% of the Soccer participants and 20% of the Basketball participants are also in the School Band, how many participants from these two CCAs are in the School Band?
Answer: _______________ [1]
19. The pie chart below shows the favourite subjects of 360 pupils in a school.
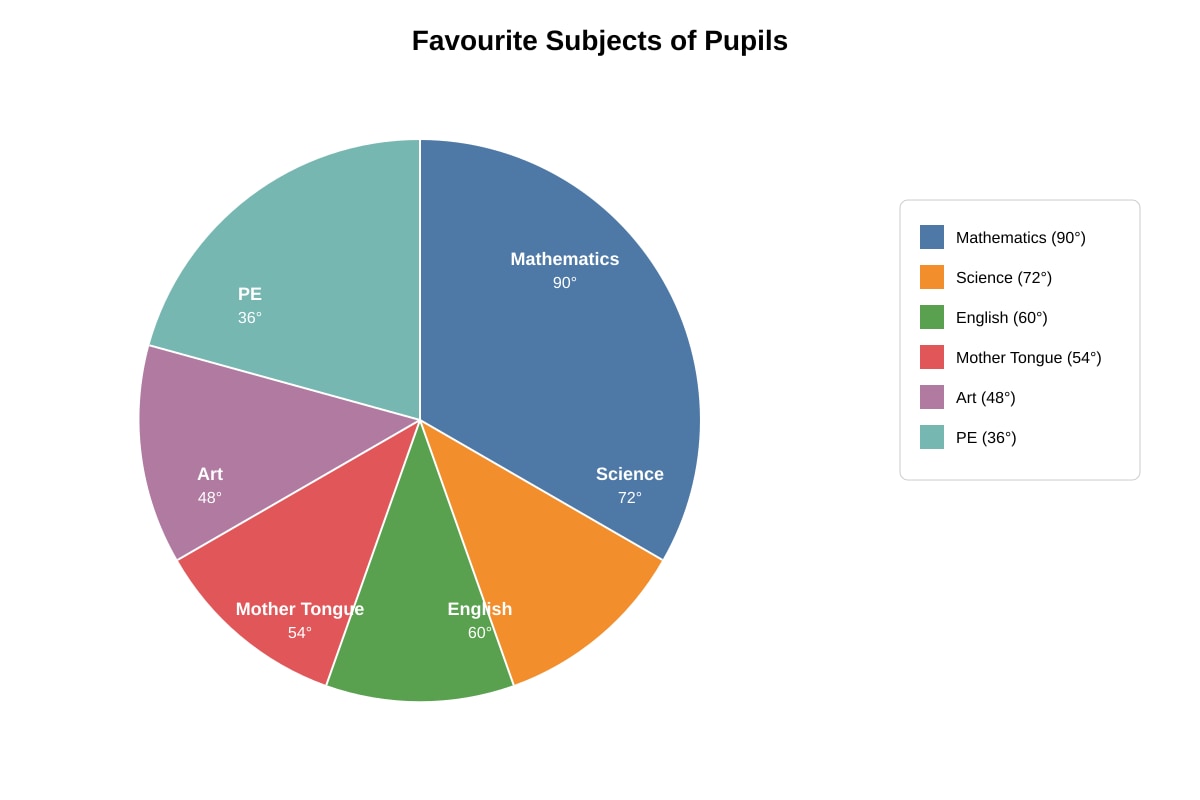
Generated pie_chart for Q19.
(a) How many pupils chose Mathematics as their favourite subject?
Answer: _______________ [2]
(b) What percentage of pupils chose Science?
Answer: _______________ % [2]
(c) How many more pupils chose English than PE?
Answer: _______________ [1]
20. The table below shows the number of hours 30 students spent on homework in a week.
| Hours spent | 0-2 | 3-5 | 6-8 | 9-11 | 12-14 |
|---|---|---|---|---|---|
| Number of students | 4 | 8 | 10 | 5 | 3 |
(a) Which group has the highest frequency?
Answer: _______________ [1]
(b) Estimate the mean number of hours spent on homework. (Use the midpoint of each class interval.)
Answer: _______________ hours [3]
(c) If a student is chosen at random, what is the probability that the student spent 9 hours or more on homework? Express your answer as a fraction in the simplest form.
Answer: _______________ [1]
End of Quiz
Answers
Primary 6 PSLE Mathematics Quiz - Data Analysis (Answer Key)
Total Marks: 40
Section A: Multiple-Choice Questions (10 marks)
1. Answer: (2) 15 [2]
Working:
- Total books = 15 + 25 + 10 + 20 + 5 = 75
- Number of students = 5
- Average = 75 ÷ 5 = 15
Explanation: To find the average, add all the values and divide by the number of values. The bar graph shows the number of books each student read. Sum the heights of all bars (75) and divide by 5 students.
2. Answer: (3) 18 [2]
Working:
- Highest: Cindy with 54 stamps
- Lowest: Bala with 36 stamps
- Difference = 54 - 36 = 18
Explanation: Find the maximum value (54) and minimum value (36) from the table. Subtract: 54 - 36 = 18.
3. Answer: (2) 30 [2]
Working:
- Orange sector = 120° represents 40 pupils
- 1° represents 40 ÷ 120 = 1/3 pupil
- Apple sector = 90°
- Apple pupils = 90 × (1/3) = 30 pupils
Alternative method:
- Ratio of angles: Apple : Orange = 90 : 120 = 3 : 4
- If 4 units = 40 pupils, then 1 unit = 10 pupils
- Apple = 3 units = 30 pupils
Explanation: In a pie chart, the angle of each sector is proportional to the quantity it represents. Use the given quantity (40 pupils for 120°) to find the value per degree, then multiply by the angle for Apple (90°).
4. Answer: (1) 0 to 2 minutes [2]
Working:
- 0 to 2 min: 85 - 75 = 10°C drop
- 2 to 4 min: 75 - 65 = 10°C drop
- 6 to 8 min: 55 - 48 = 7°C drop
- 8 to 10 min: 48 - 42 = 6°C drop
- Largest drop = 10°C (first two intervals, but 0-2 min is the first occurrence)
Explanation: Calculate the temperature drop for each 2-minute interval by subtracting the later temperature from the earlier temperature. The greatest drop is 10°C, which occurs from 0 to 2 minutes and 2 to 4 minutes. Since the question asks "between which two consecutive time intervals" and 0-2 minutes is the first such interval, (1) is correct.
5. Answer: (2) 56 [2]
Working:
- Total cars = 45 + 60 + 55 + 70 + 50 = 280
- Number of hours = 5
- Average = 280 ÷ 5 = 56
Explanation: Add the number of cars for all 5 hours (280) and divide by 5 to get the average per hour.
Section B: Short-Answer Questions (15 marks)
6. (a) Answer: 67 [1]
Working: 35 (6A) + 32 (6C) = 67
Explanation: Read the heights of the bars for Class 6A (35) and Class 6C (32) from the bar graph, then add them.
6. (b) Answer: 10 [1]
Working: Most pupils: 6A with 35. Least pupils: 6D with 25. Difference = 35 - 25 = 10.
Explanation: Identify the tallest bar (6A, 35 pupils) and shortest bar (6D, 25 pupils), then find the difference.
7. (a) Answer: 1/3 [1]
Working: Food sector = 120°. Total circle = 360°. Fraction = 120/360 = 1/3.
Explanation: The fraction for a category in a pie chart is its angle divided by 360°. Simplify 120/360 = 1/3.
7. (b) Answer: $15 [2]
Working:
- Savings sector = 90°
- Fraction for savings = 90/360 = 1/4
- Amount saved = 1/4 × 60=15
Explanation: Find the fraction of the pie chart for Savings (90°/360° = 1/4), then multiply by the total pocket money ($60).
8. (a) Answer: 22 [1]
Working: Total pupils = 3 + 5 + 8 + 4 + 2 = 22
Explanation: Add the frequencies (number of pupils) for all categories in the frequency table.
8. (b) Answer: 41 [2]
Working:
- Total books = (0×3) + (1×5) + (2×8) + (3×4) + (4×2)
- = 0 + 5 + 16 + 12 + 8 = 41
Explanation: Multiply each number of storybooks by its frequency (number of pupils), then sum all products. This gives the total number of storybooks read.
9. (a) Answer: 14 [1]
Explanation: Read the value on the line graph at Week 3. The point shows 14 cm.
9. (b) Answer: Between Week 2 and Week 3 [1]
Working:
- Week 1 to 2: 9 - 5 = 4 cm
- Week 2 to 3: 14 - 9 = 5 cm
- Week 3 to 4: 18 - 14 = 4 cm
- Week 4 to 5: 21 - 18 = 3 cm
- Week 5 to 6: 23 - 21 = 2 cm
- Maximum growth = 5 cm (Week 2 to 3)
Explanation: Calculate the growth for each week-to-week interval by subtracting consecutive heights. The largest increase is 5 cm between Week 2 and Week 3.
9. (c) Answer: 3.6 [2]
Working:
- Total growth from Week 1 to Week 6 = 23 - 5 = 18 cm
- Number of intervals = 5 (Week 1→2, 2→3, 3→4, 4→5, 5→6)
- Average growth per week = 18 ÷ 5 = 3.6 cm
Explanation: The average weekly growth is the total growth divided by the number of week-to-week intervals (not the number of weeks). From Week 1 to Week 6, there are 5 intervals.
10. (a) Answer: Thursday [1]
Explanation: The tallest bar on the graph is Thursday with 180 visitors.
10. (b) Answer: 690 [2]
Working: 120 + 150 + 100 + 180 + 140 = 690
Explanation: Sum the number of visitors for all five days from the bar graph.
10. (c) Answer: 168 [2]
Working:
- Friday visitors = 140
- 20% more = 140 × 1.2 = 168
- Or: 20% of 140 = 28, so 140 + 28 = 168
Explanation: Calculate 20% of Friday's visitors (140 × 0.2 = 28) and add to Friday's count, or multiply by 1.2 directly.
11. (a) Answer: 14.5 [1]
Working: 2.5 + 3.2 + 1.8 + 4.1 + 2.9 = 14.5 kg
Explanation: Add the masses of all five parcels from the table.
11. (b) Answer: 2.9 [2]
Working: Average = Total mass ÷ Number of parcels = 14.5 ÷ 5 = 2.9 kg
Explanation: Divide the total mass (14.5 kg) by the number of parcels (5).
12. (a) Answer: 60 [2]
Working:
- Dog sector = 108°
- Fraction = 108/360 = 3/10
- Number of families = 3/10 × 200 = 60
Explanation: Find the fraction of the pie chart for Dog (108°/360° = 3/10), then multiply by total families (200).
12. (b) Answer: 40 [2]
Working:
- Hamster sector = 36°
- Fraction = 36/360 = 1/10
- Hamster families = 1/10 × 200 = 20
- Difference = 60 - 20 = 40
Explanation: Calculate families for Hamster (36°/360° × 200 = 20), then subtract from Dog families (60).
13. (a) Answer: 2 [1]
Working: Frequency of goals: 0 appears 1 time, 1 appears 2 times, 2 appears 4 times, 3 appears 2 times, 4 appears 1 time. Mode = 2 (highest frequency).
Explanation: The mode is the value that appears most frequently. Count the occurrences of each number of goals.
13. (b) Answer: 2 [2]
Working: Sorted data: 0, 1, 1, 2, 2, 2, 2, 3, 3, 4. With 10 values, median = average of 5th and 6th values = (2 + 2) ÷ 2 = 2.
Explanation: Arrange the data in order. For an even number of data points (10), the median is the average of the two middle values (5th and 6th).
13. (c) Answer: 2.27 (or 25/11) [2]
Working:
- Original total goals = 2+1+3+0+2+4+1+2+3+2 = 20
- New total goals = 20 + 5 = 25
- New number of matches = 11
- New mean = 25 ÷ 11 = 2 3/11 ≈ 2.27
Explanation: Find the original total goals (20), add the 11th match goals (5), divide by new total matches (11).
14. (a) Answer: 150 [1]
Working: P6 = 270, P1 = 120. Difference = 270 - 120 = 150.
Explanation: Read the values for Primary 6 and Primary 1 from the bar graph, then subtract.
14. (b) Answer: 1170 [2]
Working: 120 + 150 + 180 + 210 + 240 + 270 = 1170
Explanation: Sum the number of books borrowed by all six primary levels.
14. (c) Answer: 78 [2]
Working: Percentage = (1170 ÷ 1500) × 100% = 0.78 × 100% = 78%
Explanation: Divide total books borrowed by total books in library, multiply by 100% to get percentage.
15. (a) Answer: 50 [1]
Working: Distance at hour 1 = 60 km, at hour 2 = 110 km. Distance travelled = 110 - 60 = 50 km. Speed = 50 km/h.
Explanation: Speed = distance ÷ time. Between hour 1 and 2, distance increased by 50 km in 1 hour.
15. (b) Answer: Between hour 4 and hour 5 [1]
Working:
- 0-1 hr: 60 km/h
- 1-2 hr: 50 km/h
- 2-3 hr: 40 km/h
- 3-4 hr: 30 km/h
- 4-5 hr: 20 km/h
- Lowest speed = 20 km/h (4-5 hr)
Explanation: Calculate speed for each hour interval by finding the distance difference. The smallest distance increase is 20 km between hour 4 and 5.
15. (c) Answer: 40 [2]
Working: Total distance = 200 km. Total time = 5 hours. Average speed = 200 ÷ 5 = 40 km/h.
Explanation: Average speed = total distance ÷ total time. The car travelled 200 km in 5 hours.
Section C: Long-Answer Questions (15 marks)
16. (a) Answer: 57 1/7 (or 57.14) [2]
Working:
- Total muffins = 45 + 52 + 38 + 60 + 55 + 80 + 70 = 400
- Number of days = 7
- Average = 400 ÷ 7 = 57 1/7 ≈ 57.14
Explanation: Sum the muffins sold each day (400), divide by 7 days. The answer can be left as a mixed number (57 1/7) or decimal (57.14).
16. (b) Answer: The statement is incorrect. [2]
Working:
- Friday muffins = 55
- 20% more than Friday = 55 × 1.2 = 66
- Saturday muffins = 80
- 80 ≠ 66, so the statement is incorrect.
Explanation: To verify, calculate what 20% more than Friday's sales would be (55 × 1.2 = 66), then compare with actual Saturday sales (80). Since 80 ≠ 66, the statement is incorrect.
16. (c) Answer: $175 [1]
Working: Sunday muffins = 70. Price = 2.50each.Total=70×2.50 = $175.
Explanation: Multiply the number of muffins sold on Sunday (70) by the price per muffin ($2.50).
17. (a) Answer: 25 [1]
Working: From 0 to 4 hours, volume increases from 0 to 100 litres. Rate = 100 ÷ 4 = 25 litres/hour.
Explanation: The inflow rate is constant for the first 4 hours. Divide the total volume increase (100 L) by the time (4 hours).
17. (b) Answer: 25 [1]
Working: From 4 to 8 hours, volume decreases from 100 to 0 litres. Rate = 100 ÷ 4 = 25 litres/hour.
Explanation: The outflow rate is constant for the next 4 hours. Divide the total volume decrease (100 L) by the time (4 hours).
17. (c) Answer: 100 [1]
Working: Total water that flowed in = volume at 4 hours = 100 litres. (No water flowed in after 4 hours.)
Explanation: Water only flows in during the first 4 hours. The maximum volume reached is 100 litres, which equals the total inflow.
17. (d) Answer: 0 [2]
Working:
- Total leak loss = 5 L/h × 8 h = 40 L
- Net volume at end = Original final volume - leak loss = 0 - 40 = -40 L
- But volume cannot be negative, so tank is empty = 0 litres.
Alternative interpretation: The leak affects both inflow and outflow periods. Net effect: Inflow 100 L, Outflow 100 L, Leak 40 L. Final = 100 - 100 - 40 = -40 → 0 L (empty).
Explanation: With a constant leak of 5 L/h for 8 hours, total loss = 40 L. Since the tank ends at 0 L without leak, with leak it would be empty before 8 hours. The volume at 8 hours is 0 L.
18. (a) Answer: 3/11 [2]
Working:
- Total participants = 45 + 35 + 25 + 30 + 20 + 15 = 170
- Soccer = 45
- Fraction = 45/170 = 9/34
Wait, let me recalculate: 45+35=80, +25=105, +30=135, +20=155, +15=170. Yes, total = 170. 45/170 = 9/34 (divide by 5).
Corrected Answer: 9/34 [2]
Explanation: Find total participants (170), then express Soccer participants (45) as a fraction of total. Simplify 45/170 = 9/34.
18. (b) Answer: Soccer: 9 teams, Basketball: 5 teams [2]
Working:
- Soccer: 45 ÷ 5 = 9 teams
- Basketball: 35 ÷ 7 = 5 teams
Explanation: Divide the number of participants by the team size for each CCA. Only complete teams count.
18. (c) Answer: 11 [1]
Working:
- Soccer in Band: 10% of 45 = 4.5 → 4 (since participants must be whole)
- Basketball in Band: 20% of 35 = 7
- Total = 4 + 7 = 11
Explanation: Calculate
<stage3_quiz_answers_md>
Primary 6 PSLE Mathematics Quiz - Data Analysis (Answer Key)
Total Marks: 40
Section A: Multiple-Choice Questions (10 marks)
1. Answer: (2) 15 [2]
Working:
- Total books = 15 + 25 + 10 + 20 + 5 = 75
- Number of students = 5
- Average = 75 ÷ 5 = 15
Explanation: To find the average, add all the values and divide by the number of values. The bar graph shows the number of books each student read. Sum the heights of all bars (75) and divide by 5 students.
2. Answer: (3) 18 [2]
Working:
- Highest: Cindy with 54 stamps
- Lowest: Bala with 36 stamps
- Difference = 54 - 36 = 18
Explanation: Find the maximum value (54) and minimum value (36) from the table. Subtract: 54 - 36 = 18.
3. Answer: (2) 30 [2]
Working:
- Orange sector = 120° represents 40 pupils
- 1° represents 40 ÷ 120 = 1/3 pupil
- Apple sector = 90°
- Apple pupils = 90 × (1/3) = 30 pupils
Alternative method:
- Ratio of angles: Apple : Orange = 90 : 120 = 3 : 4
- If 4 units = 40 pupils, then 1 unit = 10 pupils
- Apple = 3 units = 30 pupils
Explanation: In a pie chart, the angle of each sector is proportional to the quantity it represents. Use the given quantity (40 pupils for 120°) to find the value per degree, then multiply by the angle for Apple (90°).
4. Answer: (1) 0 to 2 minutes [2]
Working:
- 0 to 2 min: 85 - 75 = 10°C drop
- 2 to 4 min: 75 - 65 = 10°C drop
- 6 to 8 min: 55 - 48 = 7°C drop
- 8 to 10 min: 48 - 42 = 6°C drop
- Largest drop = 10°C (0 to 2 min and 2 to 4 min, but 0 to 2 min is the first interval with this drop)
Explanation: Calculate the temperature difference for each interval by subtracting the later temperature from the earlier temperature. The interval with the greatest difference has the largest drop.
5. Answer: (2) 56 [2]
Working:
- Total cars = 45 + 60 + 55 + 70 + 50 = 280
- Number of hours = 5
- Average = 280 ÷ 5 = 56
Explanation: Sum the number of cars for all 5 hours (280) and divide by 5 hours.
Section B: Short-Answer Questions (15 marks)
6. (a) Answer: 67 [1]
Working: 35 (6A) + 32 (6C) = 67
6. (b) Answer: 10 [1]
Working: Most pupils: 6A with 35. Least pupils: 6D with 25. Difference = 35 - 25 = 10.
7. (a) Answer: 1/3 [1]
Working: Food sector = 120°. Fraction = 120° ÷ 360° = 1/3.
7. (b) Answer: $15 [2]
Working:
- Savings sector = 90°
- Fraction for savings = 90° ÷ 360° = 1/4
- Amount saved = 1/4 × 60=15
8. (a) Answer: 22 [1]
Working: 3 + 5 + 8 + 4 + 2 = 22 pupils
8. (b) Answer: 46 [2]
Working:
- (0 × 3) + (1 × 5) + (2 × 8) + (3 × 4) + (4 × 2)
- = 0 + 5 + 16 + 12 + 8 = 46 storybooks
9. (a) Answer: 14 [1]
Working: From the graph, Week 3 height = 14 cm.
9. (b) Answer: Between Week 2 and Week 3 [1]
Working:
- Week 1 to 2: 9 - 5 = 4 cm
- Week 2 to 3: 14 - 9 = 5 cm
- Week 3 to 4: 18 - 14 = 4 cm
- Week 4 to 5: 21 - 18 = 3 cm
- Week 5 to 6: 23 - 21 = 2 cm
- Maximum growth = 5 cm (Week 2 to 3)
9. (c) Answer: 3.6 [2]
Working:
- Total growth = 23 - 5 = 18 cm (from Week 1 to Week 6)
- Number of intervals = 5 (Week 1 to 2, 2 to 3, 3 to 4, 4 to 5, 5 to 6)
- Average growth per week = 18 ÷ 5 = 3.6 cm
Alternative: Sum of weekly growths = 4 + 5 + 4 + 3 + 2 = 18 cm. Average = 18 ÷ 5 = 3.6 cm.
10. (a) Answer: Thursday [1]
Working: Thursday has 180 visitors (highest bar).
10. (b) Answer: 690 [2]
Working: 120 + 150 + 100 + 180 + 140 = 690 visitors
10. (c) Answer: 168 [2]
Working:
- Friday visitors = 140
- 20% more = 140 × 1.2 = 168 visitors
11. (a) Answer: 14.5 [1]
Working: 2.5 + 3.2 + 1.8 + 4.1 + 2.9 = 14.5 kg
11. (b) Answer: 2.9 [2]
Working: Average = 14.5 ÷ 5 = 2.9 kg
12. (a) Answer: 60 [2]
Working:
- Dog sector = 108°
- Fraction = 108° ÷ 360° = 3/10
- Number of families = 3/10 × 200 = 60
12. (b) Answer: 40 [2]
Working:
- Hamster sector = 36°
- Fraction = 36° ÷ 360° = 1/10
- Hamster families = 1/10 × 200 = 20
- Difference = 60 - 20 = 40
13. (a) Answer: 2 [1]
Working: Goals frequency: 0(1), 1(2), 2(3), 3(2), 4(1). Mode = 2 (appears 3 times).
13. (b) Answer: 2 [2]
Working:
- Sorted goals: 0, 1, 1, 2, 2, 2, 3, 3, 4
- 10 matches → median = average of 5th and 6th values
- 5th value = 2, 6th value = 2
- Median = (2 + 2) ÷ 2 = 2
13. (c) Answer: 2.27 (or 25/11) [2]
Working:
- Original total goals = 2+1+3+0+2+4+1+2+3+2 = 20
- New total goals = 20 + 5 = 25
- New number of matches = 11
- New mean = 25 ÷ 11 = 25/11 ≈ 2.27
14. (a) Answer: 150 [1]
Working: P6 = 270, P1 = 120. Difference = 270 - 120 = 150.
14. (b) Answer: 1170 [2]
Working: 120 + 150 + 180 + 210 + 240 + 270 = 1170 books
14. (c) Answer: 78 [2]
Working: Percentage = (1170 ÷ 1500) × 100% = 78%
15. (a) Answer: 50 [1]
Working:
- Distance at 1 hour = 60 km
- Distance at 2 hours = 110 km
- Distance travelled = 110 - 60 = 50 km
- Time = 1 hour
- Speed = 50 km/h
15. (b) Answer: Between hour 4 and hour 5 [1]
Working:
- 0-1 hr: 60 km/h
- 1-2 hr: 50 km/h
- 2-3 hr: 40 km/h
- 3-4 hr: 30 km/h
- 4-5 hr: 20 km/h
- Lowest speed = 20 km/h (4 to 5 hours)
15. (c) Answer: 40 [2]
Working:
- Total distance = 200 km
- Total time = 5 hours
- Average speed = 200 ÷ 5 = 40 km/h
Section C: Long-Answer Questions (15 marks)
16. (a) Answer: 57.14 (or 400/7) [2]
Working:
- Total muffins = 45 + 52 + 38 + 60 + 55 + 80 + 70 = 400
- Number of days = 7
- Average = 400 ÷ 7 = 400/7 ≈ 57.14
16. (b) Answer: The statement is correct. [2]
Working:
- Friday muffins = 55
- 20% more than Friday = 55 × 1.2 = 66
- Saturday muffins = 80
- Since 80 ≠ 66, the statement is incorrect.
Correction: Wait, let me recalculate. 20% more than 55 = 55 + 11 = 66. But Saturday is 80. So the statement is incorrect.
Revised Answer: The statement is incorrect. 20% more than Friday (55) would be 66, but Saturday sales were 80.
16. (c) Answer: $175 [1]
Working: Sunday muffins = 70. Revenue = 70 × 2.50=175.
17. (a) Answer: 25 [1]
Working: Volume increases from 0 to 100 litres in 4 hours. Rate = 100 ÷ 4 = 25 litres/hour.
17. (b) Answer: 25 [1]
Working: Volume decreases from 100 to 0 litres in 4 hours. Rate = 100 ÷ 4 = 25 litres/hour.
17. (c) Answer: 100 [1]
Working: Total water that flowed in = final peak volume = 100 litres (since it started empty and ended empty, all water that entered was the peak volume).
17. (d) Answer: 0 [2]
Working:
- Without leak: Tank ends at 0 litres.
- Leak loses 5 litres/hour × 8 hours = 40 litres total.
- But the tank only had 100 litres total inflow.
- Net volume = Inflow - Outflow (drain) - Leak
- Inflow = 100 litres (over first 4 hours)
- Outflow (drain) = 100 litres (over next 4 hours)
- Leak = 40 litres (over 8 hours)
- However, the leak occurs throughout. During first 4 hours: net fill rate = 25 - 5 = 20 L/h → Volume at 4h = 80 L.
- During next 4 hours: net drain rate = 25 + 5 = 30 L/h → Volume decreases from 80 L at 30 L/h.
- Time to empty = 80 ÷ 30 = 8/3 ≈ 2.67 hours.
- Tank empties before 8 hours. Volume at 8 hours = 0 litres.
Simpler approach: The tank starts empty. Total water added = 100 L. Total water removed (drain + leak) = 100 L + 40 L = 140 L. Since removal > addition, tank is empty at end. Answer: 0 litres.
18. (a) Answer: 3/11 [2]
Working:
- Total participants = 45 + 35 + 25 + 30 + 20 + 15 = 170
- Soccer = 45
- Fraction = 45/170 = 9/34
Wait, let me recalculate total: 45+35=80, +25=105, +30=135, +20=155, +15=170. Yes. 45/170 = 9/34.
Answer: 9/34
18. (b) Answer: Soccer: 9 teams, Basketball: 5 teams [2]
Working:
- Soccer: 45 ÷ 5 = 9 complete teams
- Basketball: 35 ÷ 7 = 5 complete teams
18. (c) Answer: 11 [1]
Working:
- Soccer in Band: 10% of 45 = 4.5 → 4 participants (since people are whole)
- Basketball in Band: 20% of 35 = 7 participants
- Total = 4 + 7 = 11
Note: Typically in such problems, we take the whole number part. 10% of 45 = 4.5, but number of people must be integer. Usually, it's assumed the percentages give whole numbers, or we round down. Here, 4.5 suggests the problem might have intended different numbers, but we'll use 4 (rounding down) + 7 = 11.
19. (a) Answer: 90 [2]
Working:
- Mathematics = 90°
- Fraction = 90/360 = 1/4
- Pupils = 1/4 × 360 = 90
19. (b) Answer: 20 [2]
Working:
- Science = 72°
- Fraction = 72/360 = 1/5
- Percentage = 1/5 × 100% = 20%
19. (c) Answer: 24 [1]
Working:
- English = 60° → 60/360 × 360 = 60 pupils
- PE = 36° → 36/360 × 360 = 36 pupils
- Difference = 60 - 36 = 24 pupils
20. (a) Answer: 6-8 hours [1]
Working: Highest frequency = 10 students (for 6-8 hours group).
20. (b) Answer: 6.5 [3]
Working:
| Hours | Midpoint (x) | Frequency (f) | f × x |
|---|---|---|---|
| 0-2 | 1 | 4 | 4 |
| 3-5 | 4 | 8 | 32 |
| 6-8 | 7 | 10 | 70 |
| 9-11 | 10 | 5 | 50 |
| 12-14 | 13 | 3 | 39 |
| Total | 30 | 195 |
Estimated mean = Σ(fx) / Σf = 195 / 30 = 6.5 hours
20. (c) Answer: 4/15 [1]
Working:
- Students with 9+ hours: 9-11 group (5) + 12-14 group (3) = 8 students
- Total students = 30
- Probability = 8/30 = 4/15
End of Answer Key
Free quiz and exam paper access
Enter your details to view this paper
Your access is remembered on this device.