AI Generated Quiz
Primary 5 Mathematics Data Analysis Quiz
Free P5 Maths Data Analysis quiz, HY3 AI version, with questions, answers, and syllabus-aligned practice for Singapore students.
These static practice materials are generated from the site's syllabus and paper-generation workflow, with source and model context shown so students and parents can evaluate the material before use.
Questions
Primary 5 Mathematics Quiz - Data Analysis
Name: ___________________________
Class: _________
Date: ____________
Score: _______ / 40
Duration: 50 minutes
Total Marks: 40
Instructions:
- This quiz has 20 questions on Data Analysis.
- Section A: 10 short questions (1 mark each).
- Section B: 6 questions (2 marks each).
- Section C: 4 questions (3 marks each).
- Show your working clearly where needed.
- No calculator unless stated.
Section A (1 mark each, Questions 1–10)
1. A bar chart shows the number of books read by 5 students. The heights are: Ali 4, Ben 6, Cy 3, Dan 6, Eve 5. What is the total number of books read?
2. The table below shows the favourite fruit of 20 students:
| Fruit | Number |
|---|---|
| Apple | 8 |
| Orange | 5 |
| Pear | 7 |
How many students chose Apple or Pear?
3. A line plot shows the number of goals scored by a team in 8 matches: 2, 0, 3, 1, 2, 2, 1, 0. What is the mode (most frequent value)?
4. The average of 4 numbers is 10. Three of them are 8, 12, and 9. What is the fourth number?
5. A pie chart is divided into 4 equal parts. What percentage does each part represent?
6. The tally for a survey of pets is: Dog |||| (4), Cat ||||| (5), Bird || (2). How many more cats than birds?
7. A table shows the temperature at noon for 5 days: 30°C, 32°C, 31°C, 29°C, 33°C. What is the range?
8. A bar chart has a scale where 1 cm = 2 units. A bar is drawn 5 cm tall. What value does it show?
9. The mean of 5 test scores is 80. If one score is removed and the new mean is 78, what was the removed score?
10. A pictograph uses 1 symbol = 5 children. The row for "Cycling" has 4 symbols. How many children chose cycling?
Section B (2 marks each, Questions 11–16)
11. The table shows the number of stickers collected by 4 children:
| Name | Stickers |
|---|---|
| Amy | 12 |
| Bob | 18 |
| Cai | 10 |
| Dee | 20 |
Find the average number of stickers. Show your working.
12. A bar chart shows the sales of drinks: Juice 15, Water 10, Soda 25, Milk 5. (a) Which drink sold the most? (b) What is the total number sold?
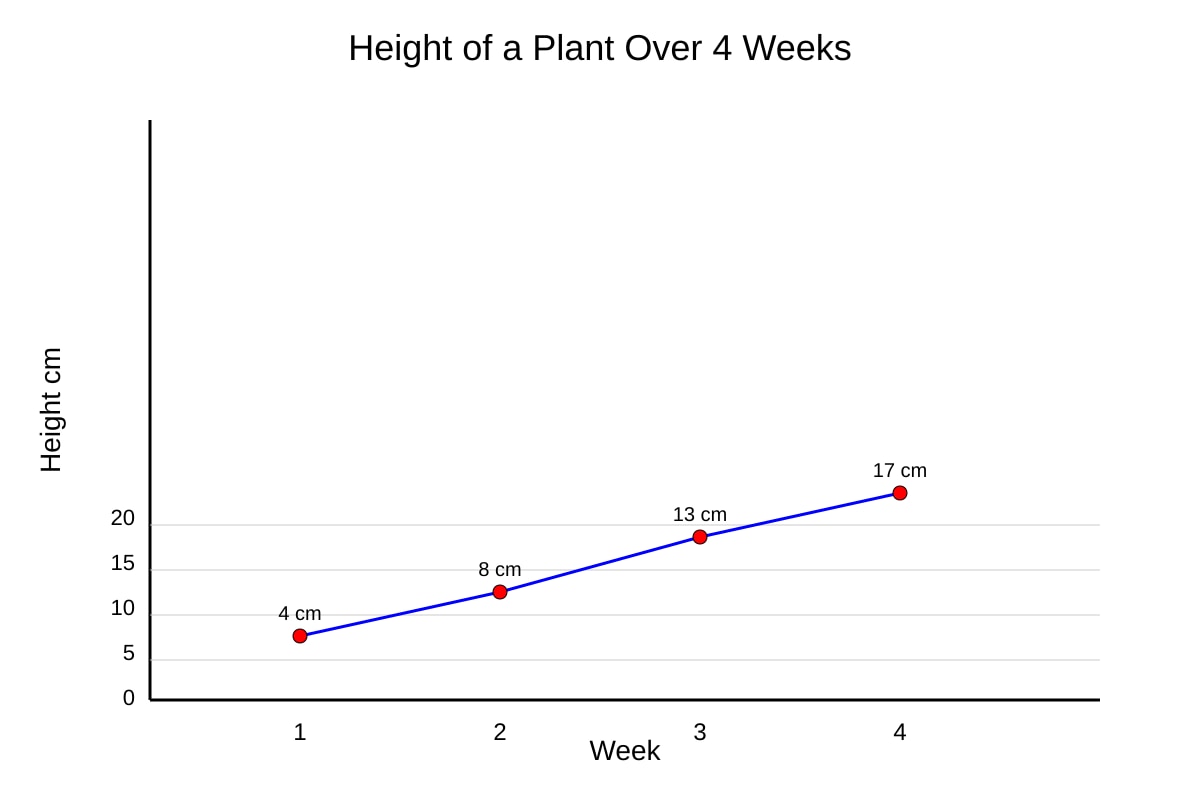
13. The line graph below shows the height of a plant over 4 weeks.
Image pending generation: graph for Q13.
(a) How much did the plant grow from Week 1 to Week 3? (1 mark) (b) Find the average growth per week from Week 1 to Week 4. (1 mark)
14. A class of 30 students voted for their favourite sport. The results: Football 12, Swimming 9, Badminton 6, Others 3. (a) What fraction of the class chose Swimming? (1 mark) (b) What percentage chose Football? (1 mark)
15. The table shows the time (min) taken by 6 pupils to finish homework: 20, 25, 30, 15, 30, 40. (a) Find the median time. (1 mark) (b) Find the mean time. (1 mark)
16. A pie chart shows the favourite subject of 40 students. Maths takes up 90°, Science 120°, English 90°, others 60°. (a) What fraction of the pie is Maths? (1 mark) (b) How many students chose Science? (1 mark)
Section C (3 marks each, Questions 17–20)
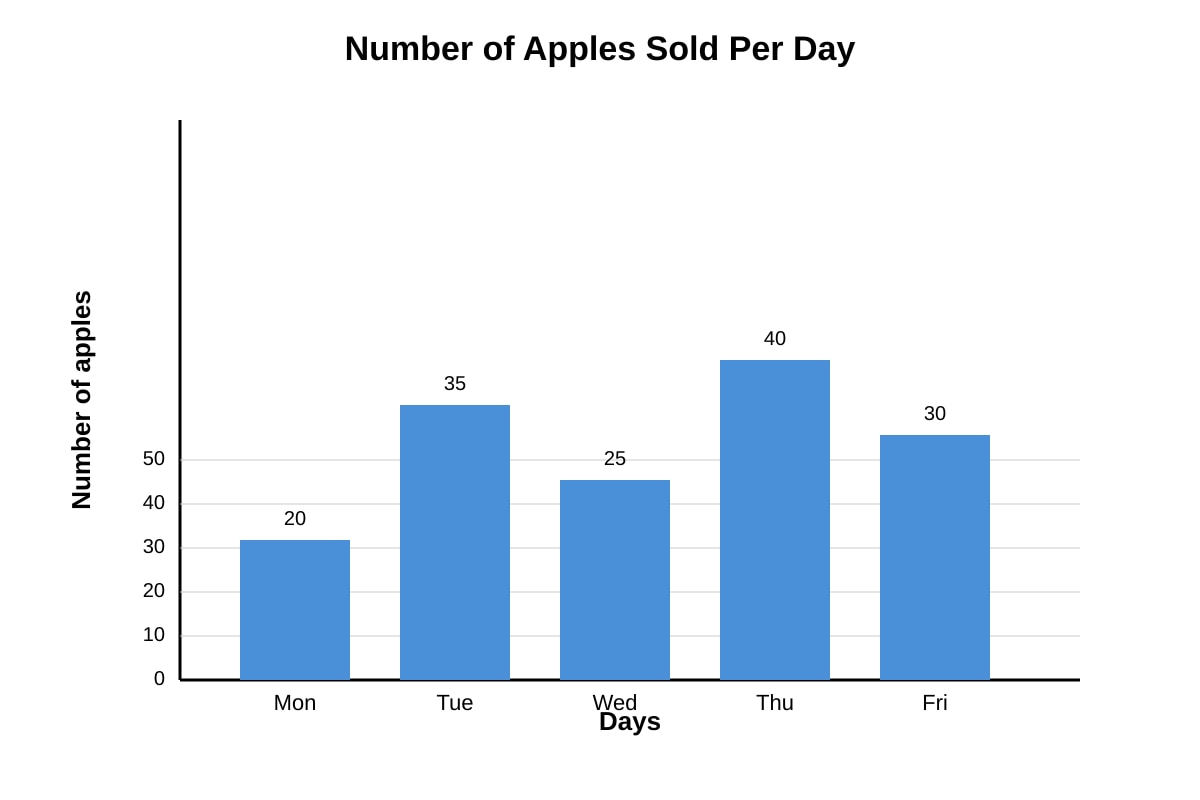
17. The bar chart below shows the number of apples sold at a stall over 5 days.
Image pending generation: bar_chart for Q17.
(a) On which day were the most apples sold? (1 mark) (b) Find the total apples sold in the 5 days. (1 mark) (c) Find the average number sold per day. (1 mark)
18. A survey of 50 pupils asked how they travel to school. The results: Bus 15, MRT 10, Walk 12, Car 13. (a) Draw a table with the mode of transport and number. (1 mark) (b) What is the range of the numbers? (1 mark) (c) If 10 more pupils walk, what is the new total for Walk and what fraction of 60 is that? (1 mark)
19. The line plot shows the number of marbles owned by 10 boys: 3,5,5,2,5,4,3,5,2,1. (a) Find the mode. (1 mark) (b) Find the mean. (1 mark) (c) Explain why the mean is greater than the smallest value but less than the largest. (1 mark)
20. A class recorded the temperature at 8am for a week: Mon 26°C, Tue 28°C, Wed 27°C, Thu 29°C, Fri 30°C, Sat 31°C, Sun 25°C. (a) Find the mean temperature. (1 mark) (b) Find the range. (1 mark) (c) On how many days was the temperature above the mean? (1 mark)
Answers
Primary 5 Mathematics Quiz - Data Analysis (Answer Key)
Total Marks: 40
Topic: Data Analysis (syllabus-first, Stage 4/5 generated; no Stage 3 past-paper evidence available)
Section A (1 mark each)
Q1. Total = 4 + 6 + 3 + 6 + 5 = 24 books.
Teaching note: Add all bar heights from the chart. Mode is not asked; just sum.
Q2. Apple 8 + Pear 7 = 15 students.
Teaching note: Read the table and add the two rows.
Q3. Mode = 2 (appears three times: positions 1,5,6).
Teaching note: Mode is the value occurring most often. 2 appears 3 times, 0 twice, 1 twice, 3 once.
Q4. Sum of 4 numbers = 4 × 10 = 40. Fourth = 40 − (8+12+9) = 40 − 29 = 11.
Teaching note: Average × count = total. Subtract known to find missing.
Q5. 100% ÷ 4 = 25% each.
Teaching note: Full circle is 100%; equal parts split equally.
Q6. Cats 5 − Birds 2 = 3 more.
Teaching note: Tally: 5 cat marks, 2 bird marks.
Q7. Range = 33 − 29 = 4°C.
Teaching note: Range = highest − lowest.
Q8. 5 cm × 2 units/cm = 10 units.
Teaching note: Scale means each cm represents 2, so multiply.
Q9. Total of 5 = 5 × 80 = 400. Total of 4 = 4 × 78 = 312. Removed = 400 − 312 = 88.
Teaching note: Use total before and after.
Q10. 4 symbols × 5 = 20 children.
Teaching note: Pictograph key: 1 symbol = 5.
Section B (2 marks each)
Q11. Total = 12+18+10+20 = 60. Average = 60 ÷ 4 = 15 stickers.
Marking: 1 mark for total, 1 mark for division.
Teaching note: Average = sum ÷ count.
Q12. (a) Soda (25). (b) Total = 15+10+25+5 = 55.
Marking: 1m each.
Teaching note: Read tallest bar; sum all bars.
Q13. (a) Week3 13cm − Week1 4cm = 9cm. (b) Total growth = 17−4 = 13cm over 3 weeks → 13 ÷ 3 ≈ 4.33 cm/week.
Marking: 1m each. Accept 4⅓ or 4.3.
Teaching note: From graph values in placeholder. Average per week = (final−start) ÷ intervals.
Q14. (a) 9/30 = 3/10. (b) 12/30 = 40%.
Marking: 1m fraction simplified, 1m percent.
Teaching note: Fraction = part/whole; percent = fraction × 100.
Q15. Ordered: 15,20,25,30,30,40. (a) Median = (25+30)/2 = 27.5 min. (b) Mean = (20+25+30+15+30+40)=160 ÷ 6 ≈ 26.67 min.
Marking: 1m median, 1m mean.
Teaching note: Median for even count is middle pair average.
Q16. (a) 90°/360° = 1/4. (b) Science 120°/360° = 1/3 of 40 = 13⅓ → 13 or 14? Exact = 13.33, but students: 40 × 120/360 = 13.33, round to nearest whole = 13.
Marking: 1m fraction, 1m count.
Teaching note: Angle/360 = fraction of pie.
Section C (3 marks each)
Q17. (a) Thu (40). (b) 20+35+25+40+30 = 150. (c) 150 ÷ 5 = 30 apples/day.
Marking: 1m each.
Teaching note: From bar values in placeholder.
Q18. (a) Table: Bus 15, MRT 10, Walk 12, Car 13. (b) Range = 15−10 = 5. (c) New Walk = 12+10=22; 22/60 = 11/30.
Marking: 1m table, 1m range, 1m fraction.
Teaching note: Range from max−min of original counts.
Q19. (a) Mode = 5 (4 times). (b) Sum = 3+5+5+2+5+4+3+5+2+1 = 35; mean = 35 ÷ 10 = 3.5. (c) Mean lies between min (1) and max (5) because it is the balance point of all values.
Marking: 1m each.
Teaching note: Mean is affected by all values, so between extremes.
Q20. Sum = 26+28+27+29+30+31+25 = 196. (a) Mean = 196 ÷ 7 = 28°C. (b) Range = 31−25 = 6°C. (c) Above 28: Thu(29), Fri(30), Sat(31) → 3 days.
Marking: 1m each.
Teaching note: Compare each day to computed mean.
Free quiz and exam paper access
Enter your details to view this paper
Your access is remembered on this device.