Primary 5 Mathematics Quiz - Data Analysis
Name: ___________________________
Class: ___________
Date: ___________
Score: ___________ / 40
Duration: 60 minutes
Total Marks: 40
Instructions:
- This quiz has 20 questions on Data Analysis.
- Section A: 10 short questions (2 marks each). Section B: 6 questions (2 marks each). Section C: 4 questions (2 marks each).
- Show your working clearly where needed.
- Use the tables and charts provided to answer the questions.
Section A (Questions 1–10, 2 marks each)
1. The table below shows the number of books read by 5 students in a month.
| Student | Books |
|---|
| Ali | 4 |
| Bala | 6 |
| Chen | 5 |
| Dan | 3 |
| Esha | 7 |
What is the total number of books read?
__________ books
2. Using the table in Q1, what is the average number of books read per student? (Give your answer in decimal.)
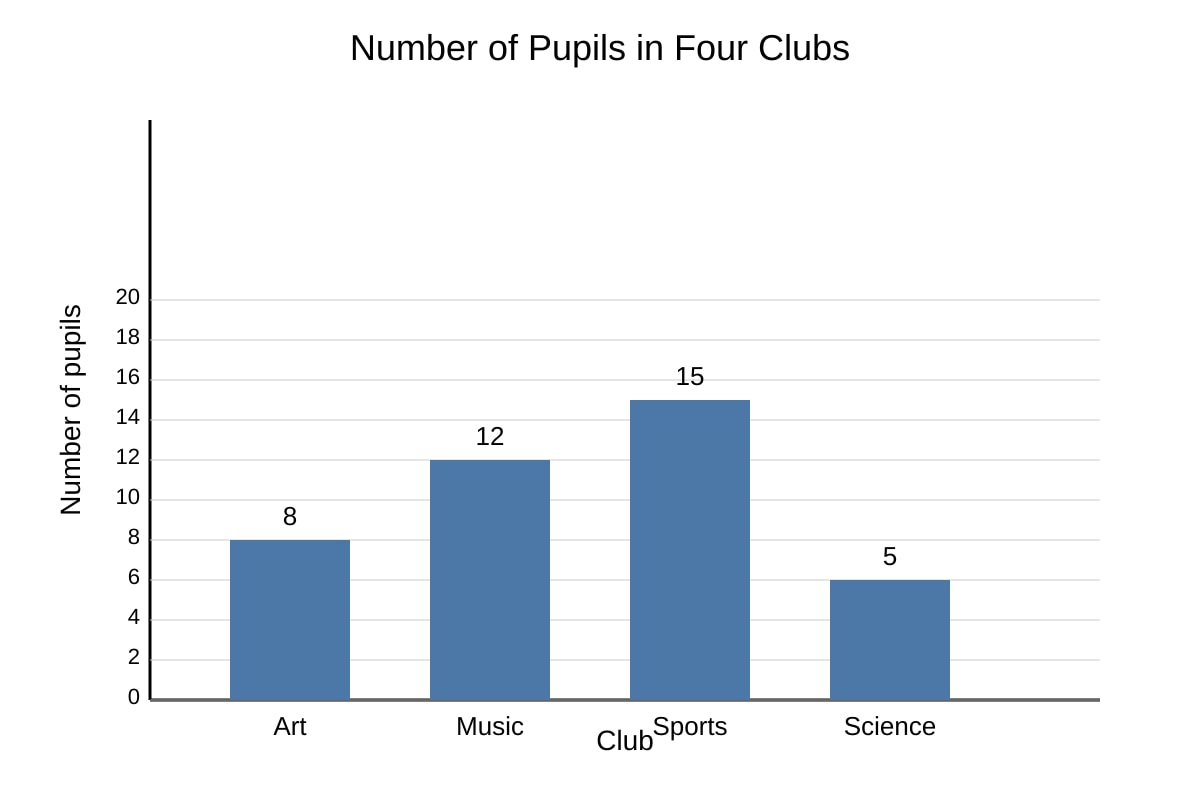
3. The bar chart shows the number of pupils in four clubs.
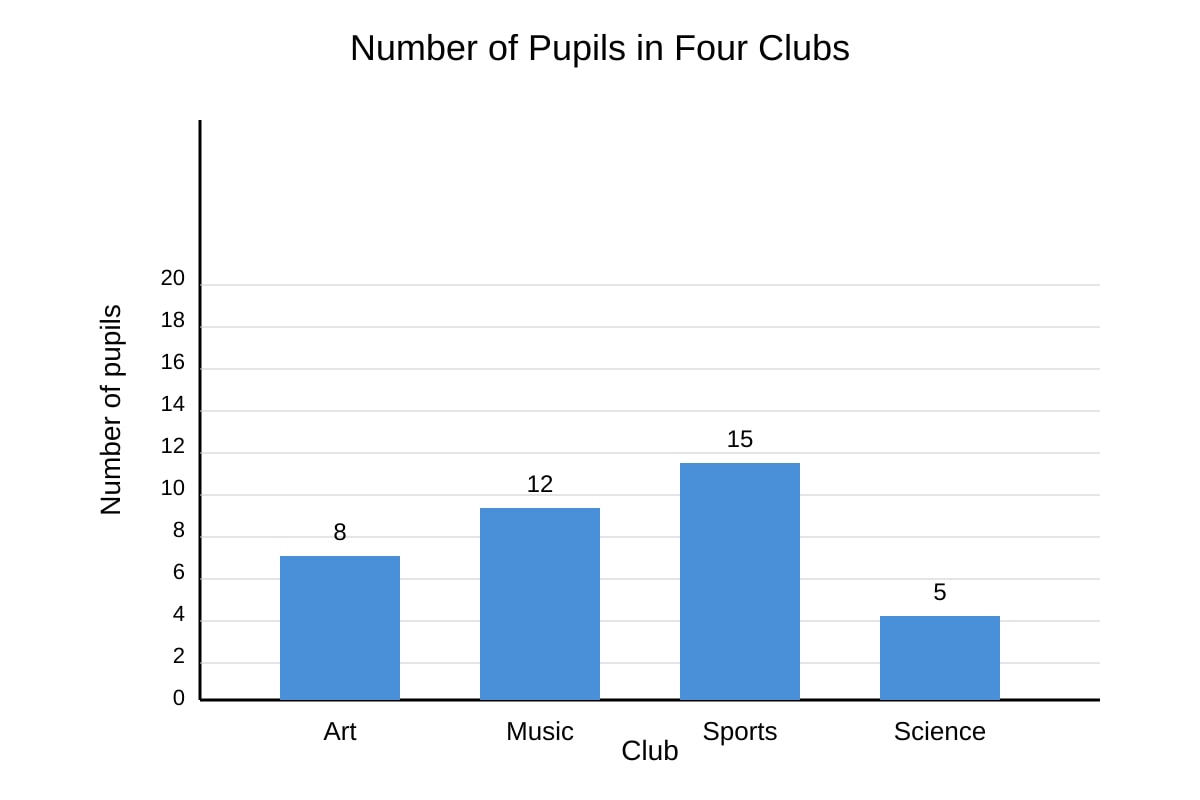
Generated bar_chart for Q3.
How many more pupils are in Sports Club than in Science Club?
__________ pupils
4. From the bar chart in Q3, which club has the smallest number of pupils?
5. A class tally chart for favourite fruit is shown.
| Fruit | Tally |
|---|
| Apple | |
| Orange | |
| Pear | |
How many pupils chose Orange?
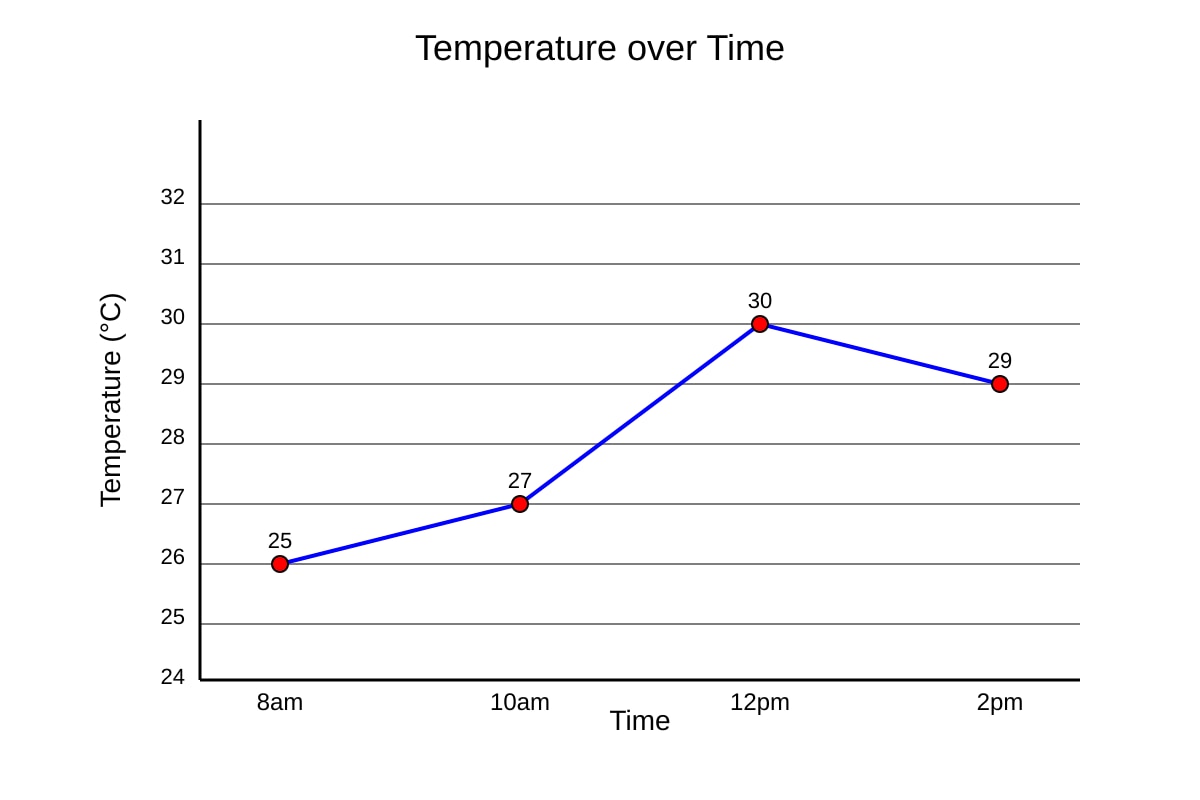
6. The line graph shows the temperature at 8am, 10am, 12pm, 2pm.
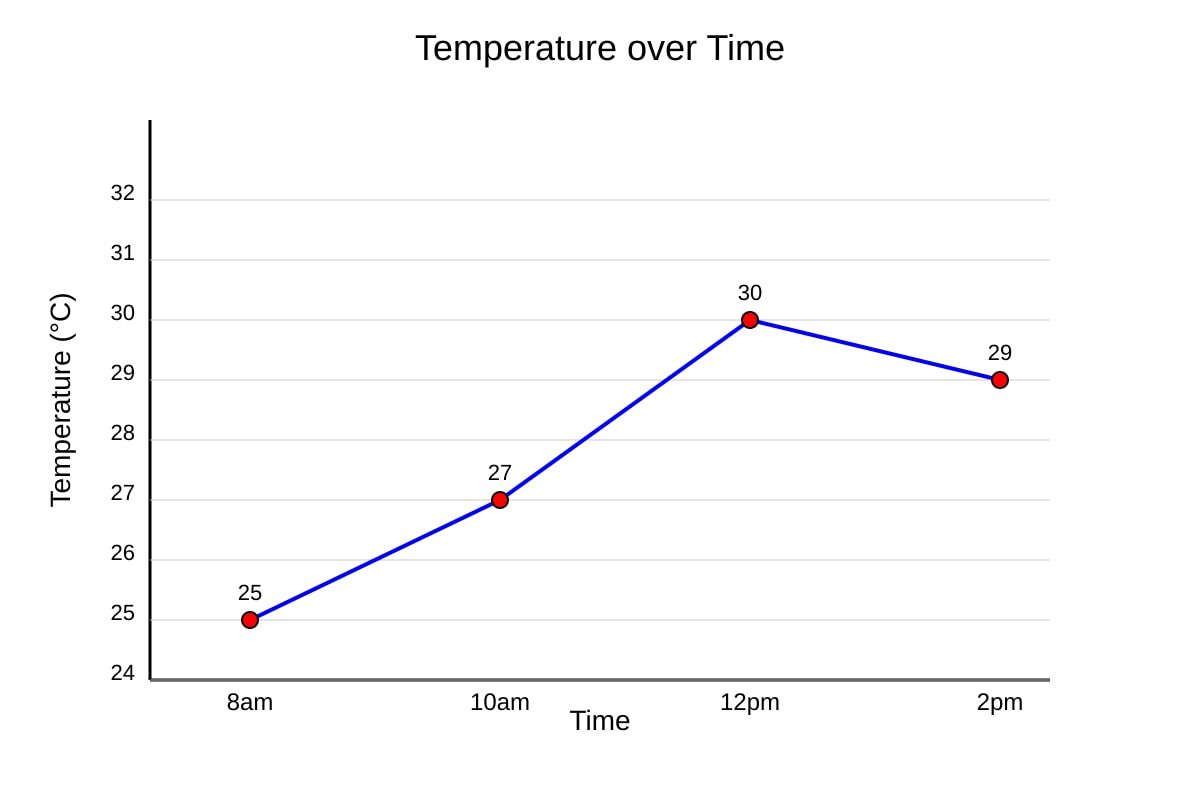
Generated line_graph for Q6.
What was the temperature at 12pm?
__________ °C
7. Using the line graph in Q6, what is the difference in temperature between 12pm and 2pm?
__________ °C
8. A table shows the mass of 4 packets: 2kg, 3kg, 5kg, 4kg. What is the average mass?
__________ kg
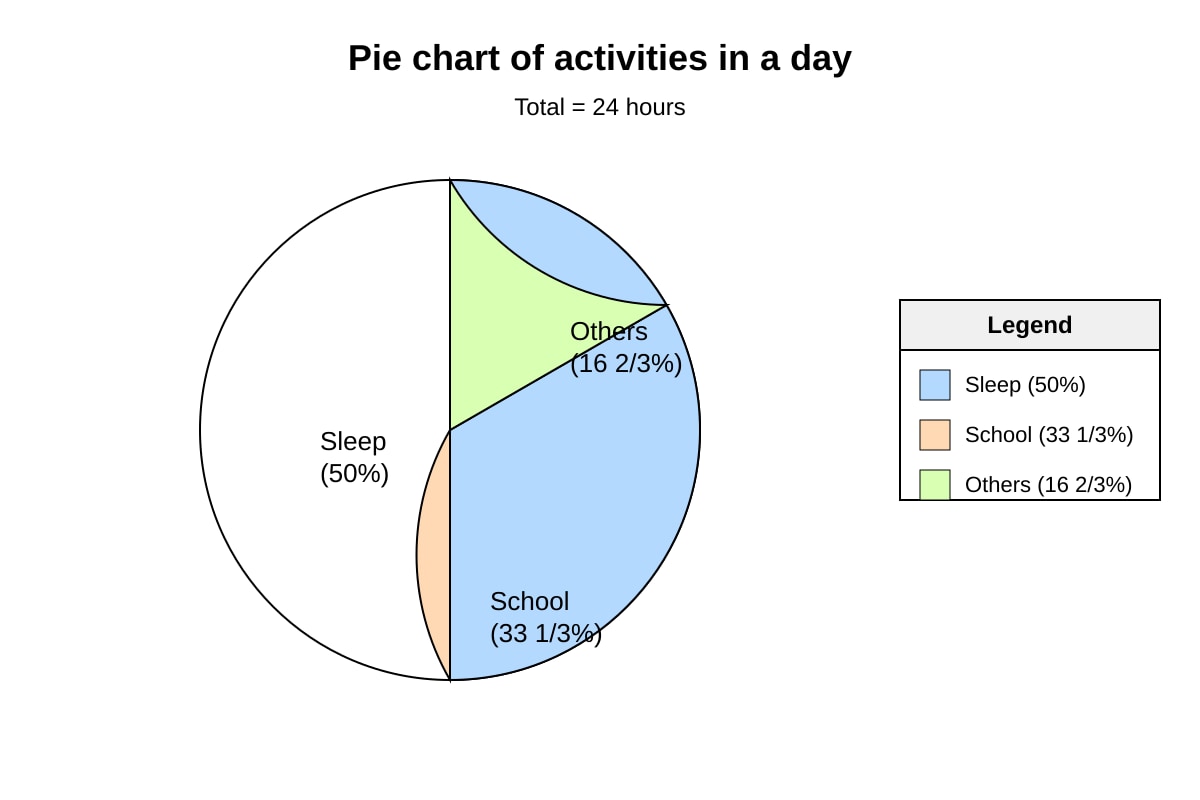
9. The pie chart shows how a student spent 24 hours.
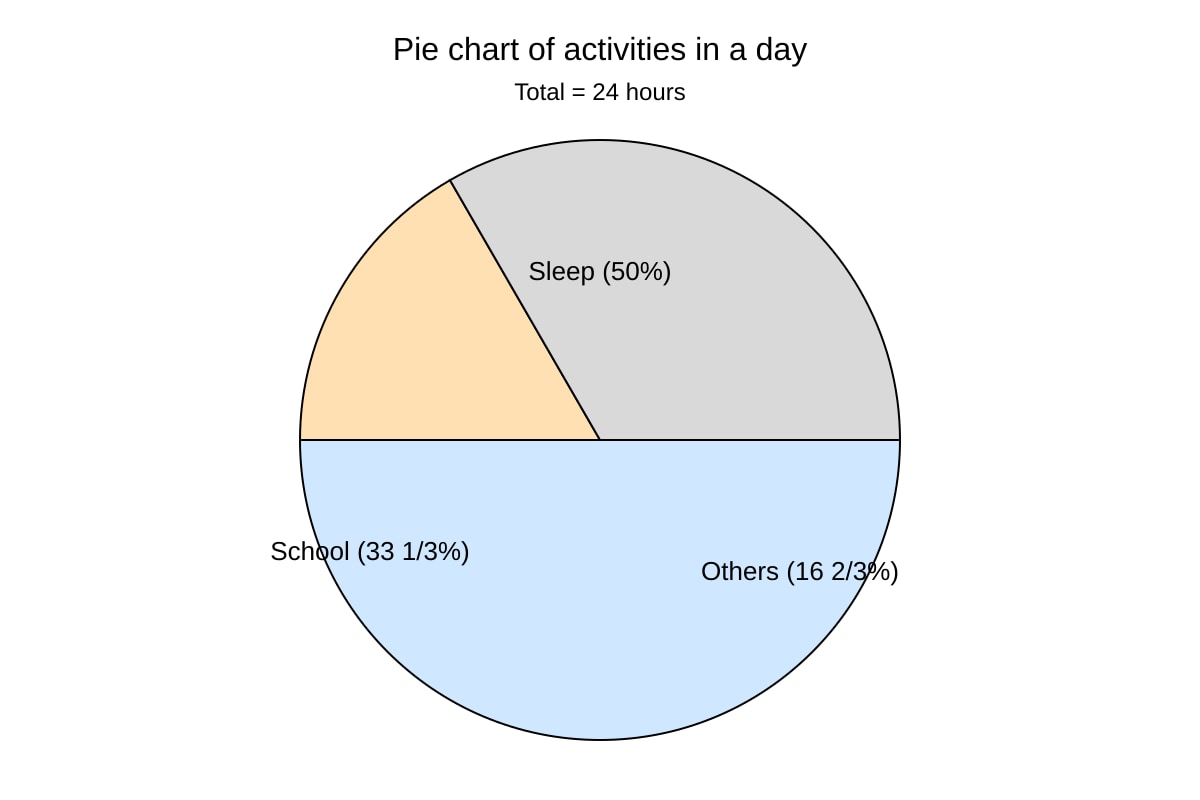
Generated pie_chart for Q9.
How many hours were spent on Sleep?
__________ hours
10. From the pie chart in Q9, how many hours were spent on School?
__________ hours
Section B (Questions 11–16, 2 marks each)
11. The table shows the number of stickers collected by 3 children.
| Name | Stickers |
|---|
| Ravi | 10 |
| Siti | 14 |
| Tom | 16 |
What is the average number of stickers collected?
12. A bar chart shows the sales of ice-cream flavours: Vanilla 20, Chocolate 35, Strawberry 25. What is the total sales?
13. Using the ice-cream data in Q12, find the difference between the highest and lowest sales.
14. The line graph shows the water level in a tank at 1h, 2h, 3h, 4h: 50ℓ, 40ℓ, 30ℓ, 20ℓ. What is the average water level?
__________ ℓ
15. From the line graph in Q14, by how much did the water level drop from 1h to 4h?
__________ ℓ
16. A class of 30 pupils voted for their favourite sport. The results: Football 12, Swimming 8, Badminton 10. How many did not choose these three?
Section C (Questions 17–20, 2 marks each)
17. The table shows the marks of 5 tests: 60, 70, 80, 90, 100. Find the average mark.
18. A pie chart shows 360 pupils. 25% walk to school, 50% take bus, rest cycle. How many cycle?
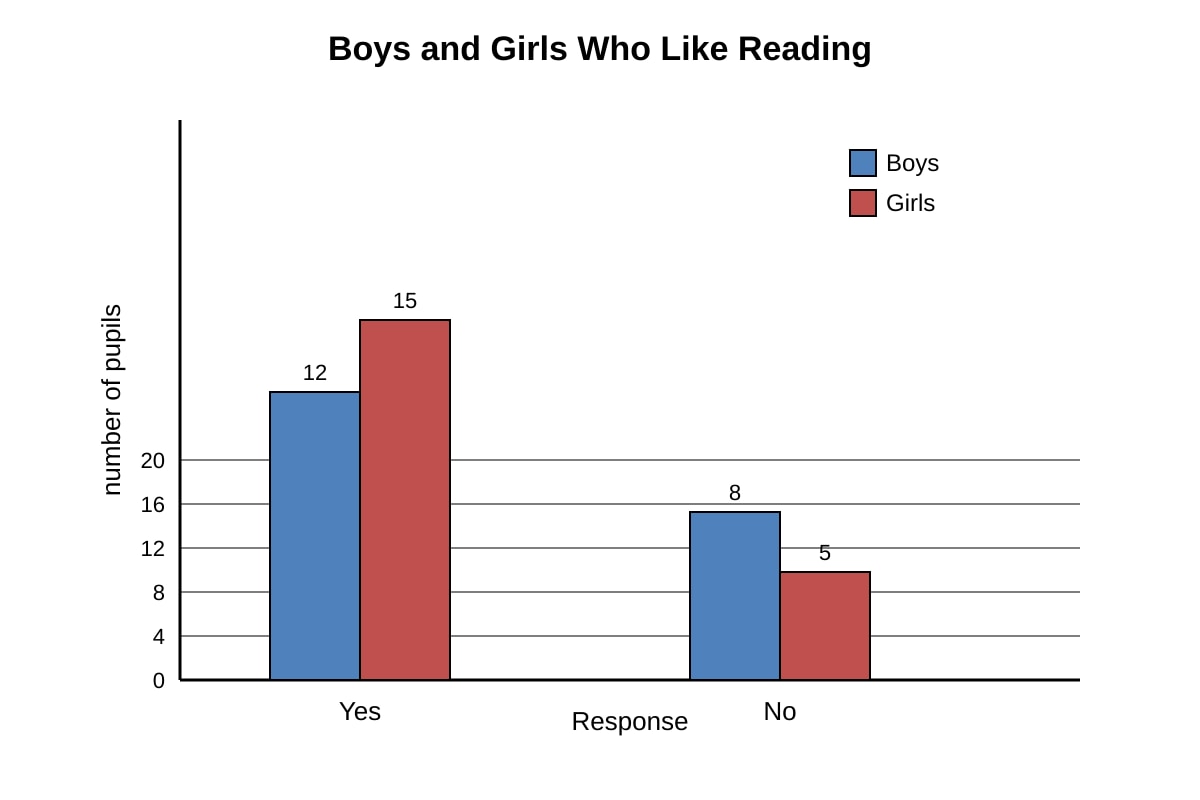
19. The bar chart compares boys and girls who like reading.
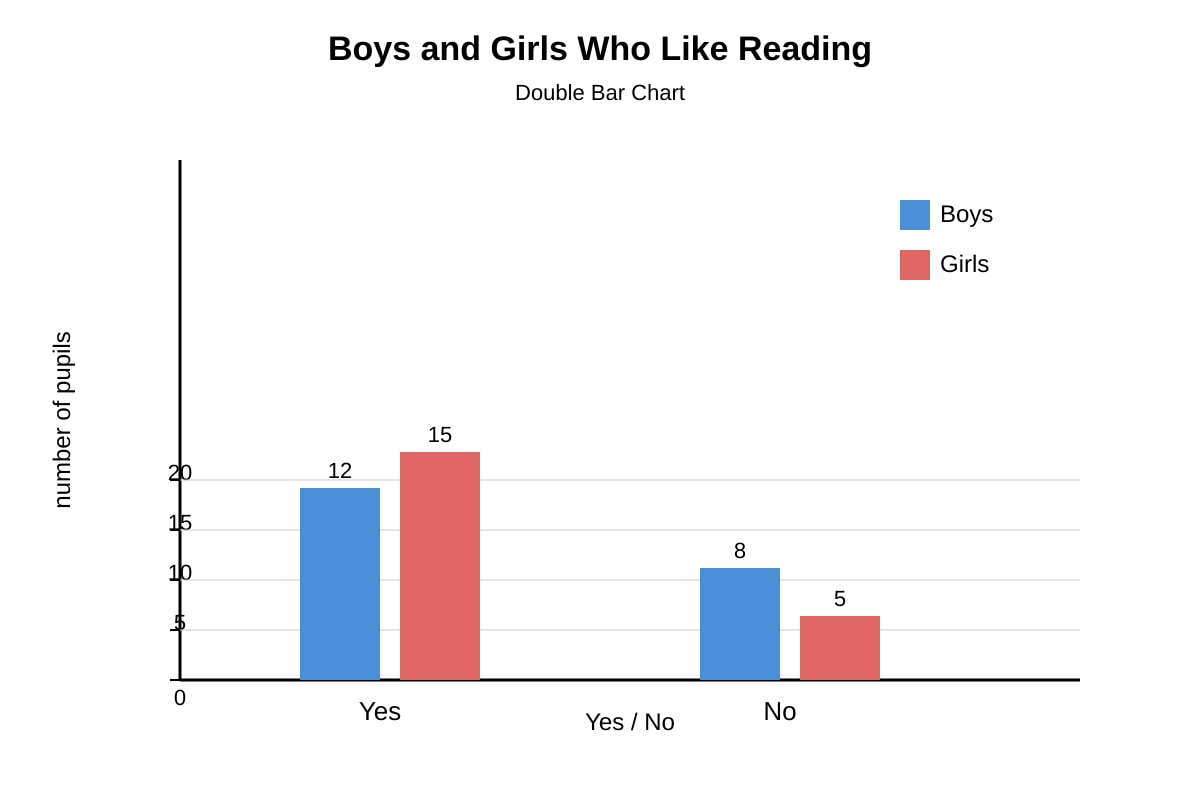
Generated bar_chart for Q19.
How many more girls than boys said "Yes"?
20. From the chart in Q19, what is the total number of pupils who said "No"?
</stage3_quiz_answers_md>
<stage3_quiz_answers_md>
Primary 5 Mathematics Quiz - Data Analysis (Answer Key)
Total Marks: 40
Topic: Data Analysis
Section A
Q1. 25 books
Working: 4 + 6 + 5 + 3 + 7 = 25.
Teaching note: Add all values in the "Books" column to find total.
Marks: 2 (1 for correct addition, 1 for answer)
Q2. 5
Working: Total = 25 (from Q1), 25 ÷ 5 = 5.
Teaching note: Average = total ÷ number of students.
Marks: 2 (1 for method, 1 for answer)
Q3. 10 pupils
Working: Sports = 15, Science = 5, 15 − 5 = 10.
Teaching note: Read bar heights from chart; subtract.
Marks: 2 (1 for values, 1 for answer)
Q4. Science
Working: From chart, Science = 5 (lowest).
Marks: 2 (1 for reading, 1 for name)
Q5. 6
Working: |||| | = 4 + 1 = 5? Wait: |||| is 4, plus | is 1, total 5? Actually tally: |||| = 4, | = 1, so 5. But table shows "|||| |" meaning 5. Correction: 5 pupils.
Teaching note: Each | is 1, group of 4 with strike = 5.
Marks: 2 (1 for tally count, 1 for answer)
Common mistake: miscounting tally groups.
Q6. 30 °C
Working: From graph, point at 12pm = 30.
Marks: 2 (1 for reading, 1 for unit)
Q7. 1 °C
Working: 30 − 29 = 1.
Marks: 2 (1 for values, 1 for answer)
Q8. 3.5 kg
Working: (2+3+5+4) = 14, 14 ÷ 4 = 3.5.
Marks: 2 (1 method, 1 answer)
Q9. 12 hours
Working: 50% of 24 = 0.5 × 24 = 12.
Marks: 2 (1 for %, 1 answer)
Q10. 8 hours
Working: 33 1/3% = 1/3, 24 ÷ 3 = 8.
Marks: 2 (1 for fraction, 1 answer)
Section B
Q11. 13.33 (or 13 1/3)
Working: (10+14+16)=40, 40÷3 ≈ 13.33.
Marks: 2 (1 method, 1 answer)
Q12. 80
Working: 20+35+25 = 80.
Marks: 2 (1 add, 1 answer)
Q13. 15
Working: Highest 35, lowest 20, 35−20=15.
Marks: 2 (1 values, 1 answer)
Q14. 35 ℓ
Working: (50+40+30+20)=140, 140÷4=35.
Marks: 2 (1 method, 1 unit)
Q15. 30 ℓ
Working: 50−20=30.
Marks: 2 (1 values, 1 answer)
Q16. 0
Working: 12+8+10=30, 30−30=0.
Marks: 2 (1 sum, 1 answer)
Section C
Q17. 80
Working: (60+70+80+90+100)=400, 400÷5=80.
Marks: 2 (1 method, 1 answer)
Q18. 90
Working: Walk 25% + Bus 50% = 75%, rest 25%. 25% of 360 = 0.25×360 = 90.
Marks: 2 (1 for %, 1 answer)
Q19. 3
Working: Girls Yes 15, Boys Yes 12, 15−12=3.
Marks: 2 (1 values, 1 answer)
Q20. 13
Working: Boys No 8 + Girls No 5 = 13.
Marks: 2 (1 values, 1 answer)
</stage3_quiz_answers_md>
<stage3_quiz_md>
Primary 5 Mathematics Quiz - Data Analysis
Name: ___________________________
Class: ___________
Date: ___________
Score: ___________ / 40
Duration: 60 minutes
Total Marks: 40
Instructions:
- This quiz has 20 questions on Data Analysis.
- Section A: 10 short questions (2 marks each). Section B: 6 questions (2 marks each). Section C: 4 questions (2 marks each).
- Show your working clearly where needed.
- Use the tables and charts provided to answer the questions.
Section A (Questions 1–10, 2 marks each)
1. The table below shows the number of books read by 5 students in a month.
| Student | Books |
|---|
| Ali | 4 |
| Bala | 6 |
| Chen | 5 |
| Dan | 3 |
| Esha | 7 |
What is the total number of books read?
__________ books
2. Using the table in Q1, what is the average number of books read per student? (Give your answer in decimal.)
3. The bar chart shows the number of pupils in four clubs.
Generated bar_chart for Q3.
How many more pupils are in Sports Club than in Science Club?
__________ pupils
4. From the bar chart in Q3, which club has the smallest number of pupils?
5. A class tally chart for favourite fruit is shown.
| Fruit | Tally |
|---|
| Apple | |
| Orange | |
| Pear | |
How many pupils chose Orange?
6. The line graph shows the temperature at 8am, 10am, 12pm, 2pm.
Generated line_graph for Q6.
What was the temperature at 12pm?
__________ °C
7. Using the line graph in Q6, what is the difference in temperature between 12pm and 2pm?
__________ °C
8. A table shows the mass of 4 packets: 2kg, 3kg, 5kg, 4kg. What is the average mass?
__________ kg
9. The pie chart shows how a student spent 24 hours.
Generated pie_chart for Q9.
How many hours were spent on Sleep?
__________ hours
10. From the pie chart in Q9, how many hours were spent on School?
__________ hours
Section B (Questions 11–16, 2 marks each)
11. The table shows the number of stickers collected by 3 children.
| Name | Stickers |
|---|
| Ravi | 10 |
| Siti | 14 |
| Tom | 16 |
What is the average number of stickers collected?
12. A bar chart shows the sales of ice-cream flavours: Vanilla 20, Chocolate 35, Strawberry 25. What is the total sales?
13. Using the ice-cream data in Q12, find the difference between the highest and lowest sales.
14. The line graph shows the water level in a tank at 1h, 2h, 3h, 4h: 50ℓ, 40ℓ, 30ℓ, 20ℓ. What is the average water level?
__________ ℓ
15. From the line graph in Q14, by how much did the water level drop from 1h to 4h?
__________ ℓ
16. A class of 30 pupils voted for their favourite sport. The results: Football 12, Swimming 8, Badminton 10. How many did not choose these three?
Section C (Questions 17–20, 2 marks each)
17. The table shows the marks of 5 tests: 60, 70, 80, 90, 100. Find the average mark.
18. A pie chart shows 360 pupils. 25% walk to school, 50% take bus, rest cycle. How many cycle?
19. The bar chart compares boys and girls who like reading.
Generated bar_chart for Q19.
How many more girls than boys said "Yes"?
20. From the chart in Q19, what is the total number of pupils who said "No"?