From Real Exams Quiz
Primary 5 English Comprehension Visual Quiz Set 2
Free P5 English Comprehension Visual quiz Set 2, Exam version, with questions, answers, and syllabus-aligned practice for Singapore students.
These static practice materials are generated from the site's syllabus and paper-generation workflow, with source and model context shown so students and parents can evaluate the material before use.
Questions
P5 English Quiz: Comprehension - Visual Text
Questions: 20
Time: 35 minutes
Total Marks: 40
Name: _____________________ ( )
Class: _____________________
Date: _____________________
Instructions
- Answer ALL questions.
- Study the visual texts carefully before answering.
- Write your answers clearly in the spaces provided.
- Answer in complete sentences where appropriate.
Section A: Poster Analysis (20 marks)
Study the poster below and answer questions 1 to 10.
[Poster Description: A vibrant educational poster titled "READ FOR SINGAPORE 2026" featuring the Singapore skyline in the background. The main image shows diverse students of different ethnicities reading books together under a large tree. Key text includes: "Join the National Reading Movement," "Reading builds strong minds and communities," "Free workshops every Saturday at all public libraries," "Special events: Author meet-and-greets, Storytelling competitions, Book swaps." Bottom section shows logos of partner organizations: National Library Board, Ministry of Education, and Singapore Book Council. A QR code appears in the corner with "Register now!" text.]
1. What is the main message of this poster?
_________________________________________________________________ (2 marks)
2. Who is organizing this reading campaign?
_________________________________________________________________ (1 mark)
3. When do the free workshops take place?
_________________________________________________________________ (1 mark)
4. Name three special events mentioned in the poster.
(a) ____________________________________________________________
(b) ____________________________________________________________
(c) ____________________________________________________________ (3 marks)
5. Why do you think the poster shows students of different ethnicities reading together?
_________________________________________________________________ (2 marks)
6. What is the purpose of including a QR code on the poster?
_________________________________________________________________ (2 marks)
7. How does the image of students reading under a tree relate to the campaign's message?
_________________________________________________________________ (2 marks)
8. What does the phrase "Reading builds strong minds and communities" suggest about the benefits of reading?
_________________________________________________________________ (3 marks)
9. Who do you think is the target audience for this poster? Give reasons.
_________________________________________________________________ (2 marks)
10. Suggest two ways this poster could be improved to make it more effective.
(a) ____________________________________________________________
(b) ____________________________________________________________ (2 marks)
Section B: Chart Interpretation (20 marks)
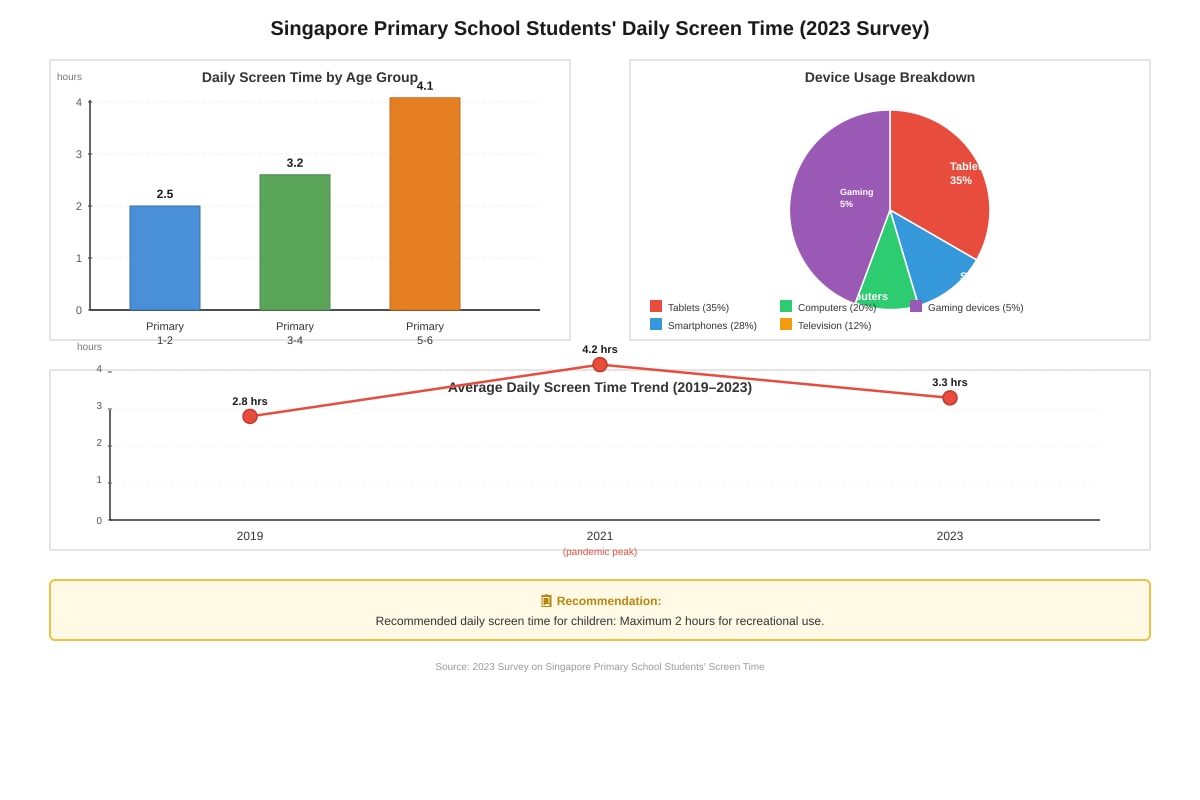
Study the chart below and answer questions 11 to 20.
**
Generated chart for this question.
**
11. Which age group spends the most time on screens daily?
_________________________________________________________________ (1 mark)
12. What is the average daily screen time for Primary 3-4 students?
_________________________________________________________________ (1 mark)
13. Which device is used most by students according to the pie chart?
_________________________________________________________________ (1 mark)
14. What percentage of screen time is spent on smartphones and computers combined?
Show your working:
_________________________________________________________________ (2 marks)
15. What was the average screen time during the pandemic peak in 2021?
_________________________________________________________________ (1 mark)
16. By how much has average screen time decreased from 2021 to 2023?
Show your working:
_________________________________________________________________ (2 marks)
17. How does the current average screen time compare to the recommended maximum?
_________________________________________________________________ (2 marks)
18. What trend can you observe in screen time usage from Primary 1-2 to Primary 5-6?
_________________________________________________________________ (2 marks)
19. Why do you think screen time peaked in 2021? Explain your reasoning.
_________________________________________________________________ (3 marks)
20. Based on this data, suggest three practical ways parents and schools can help students reduce excessive screen time.
(a) ____________________________________________________________
(b) ____________________________________________________________
(c) ____________________________________________________________ (5 marks)
End of Paper
Do not write in this space
Answers
P5 English Quiz: Comprehension - Visual Text (Answer Key)
Questions: 20
Time: 35 minutes
Total Marks: 40
Section A: Advertisement Analysis (20 marks)
1. What is the main purpose of this advertisement?
Answer: To promote/advertise the Singapore Zoo's Night Safari Experience / To attract visitors to the Night Safari
2. What time does the Night Safari open and close?
Answer: Open: 7:30 PM / 19:30 Close: 12:00 AM / Midnight
3. How much would it cost for a family of two adults and two children to visit the Night Safari?
Answer: Adult: S25×2=S50
Child: S15×2=S30
Total: S50+S30 = S$80
4. Name three features mentioned in the advertisement that visitors can experience.
Answer:
(a) Over 100 nocturnal species / Guided tram rides
(b) Walking trails / Cultural performances
(c) Any third feature from the list
(Accept any 3 from: nocturnal species, guided tram rides, walking trails, cultural performances)
5. What does the phrase "DISCOVER THE WILD SIDE OF THE NIGHT" suggest about the experience being advertised?
Answer: It suggests an exciting, adventurous experience where visitors can explore and learn about nocturnal wildlife / It promises a unique nighttime adventure with wild animals.
6. Why do you think the advertisement uses a moonlit setting in its design?
Answer: Because the Night Safari operates at night, so the moonlit setting reflects the nighttime experience / To create atmosphere and show that this is a nocturnal experience.
7. What does the logo "Conservation in Action" tell us about the Singapore Zoo's mission?
Answer: It shows that the zoo is actively involved in protecting and preserving wildlife / The zoo is committed to conservation efforts, not just entertainment.
8. Who do you think is the target audience for this advertisement? Give reasons for your answer.
Answer: Families with children, tourists, and wildlife enthusiasts because it mentions child pricing, uses exciting language that appeals to families, and focuses on educational experiences that tourists would enjoy.
9. What persuasive techniques does this advertisement use to attract visitors?
Answer: Exciting headline with action words, attractive visuals of animals, bullet points highlighting key features, clear pricing information, time urgency.
10. Do you think this advertisement is effective? Explain your answer.
Answer: Yes, it's effective because it provides clear information (times, prices, features), uses attractive visuals, creates excitement with the headline, and makes it easy for people to understand what they'll experience. (Accept well-reasoned answers for yes or no)
Section B: Infographic Interpretation (20 marks)
11. What was Singapore's recycling rate in 2020?
Answer: 52%
12. By how much did the recycling rate improve from 2020 to 2023?
Answer: 57% - 52% = 5% / 5 percentage points
13. What is Singapore's target recycling rate for 2025?
Answer: 70%
14. According to the pie chart, which type of waste makes up the largest percentage?
Answer: Paper (32%)
15. What percentage of waste is made up of plastic and glass combined?
Answer: Plastic: 19% + Glass: 3% = 22%
16. Which location has the highest usage of recycling bins according to the bar graph?
Answer: HDB estates (85%)
17. What is the difference in recycling bin usage between HDB estates and shopping malls?
Answer: 85% - 67% = 18% / 18 percentage points
18. What is the main message conveyed by the slogan "Every small action counts!"?
Answer: Individual actions, no matter how small, can make a significant difference to recycling efforts / Everyone's contribution is important and valuable.
19. Based on the infographic, what can you infer about Singapore's progress towards its recycling goals?
Answer: Singapore is making steady progress (improved from 52% to 57%) but still needs significant improvement to reach the 70% target by 2025. The trend is positive but more effort is needed.
20. Suggest two practical ways that students can help Singapore achieve its 2025 recycling target.
Answer:
(a) Properly separate waste at school and home into different recycling bins
(b) Educate family and friends about recycling importance and correct methods
(Accept other reasonable suggestions like: reducing plastic use, participating in recycling programmes, reusing materials before recycling, organizing school recycling drives)
Mark Allocation
| Section | Questions | Marks per Question | Total Marks |
|---|---|---|---|
| A: Advertisement Analysis | 1-10 | 1-3 marks | 20 marks |
| B: Infographic Interpretation | 11-20 | 1-5 marks | 20 marks |
| TOTAL | 20 | 40 marks |
Teaching Points
Visual Literacy Skills:
Advertisement Analysis:
- Understanding persuasive techniques
- Identifying target audiences
- Extracting factual information from visual elements
- Analyzing design choices and their purposes
- Evaluating effectiveness of marketing materials
Infographic Interpretation:
- Reading and interpreting data from charts and graphs
- Making calculations based on statistical information
- Drawing inferences from visual data
- Understanding trends and patterns
- Connecting data to real-world applications
Critical Thinking Development:
Analytical Skills:
- Distinguishing between fact and opinion
- Identifying persuasive techniques and their effects
- Making logical connections between visual elements and meanings
- Evaluating effectiveness of communication materials
Inferential Reasoning:
- Drawing conclusions from incomplete information
- Making predictions based on data trends
- Understanding implied meanings in visual texts
- Connecting visual information to broader contexts
Singapore Context Integration:
Local Awareness:
- Understanding Singapore's environmental initiatives
- Knowledge of local attractions and cultural sites
- Awareness of government policies and campaigns
- Recognition of community challenges and solutions
Civic Responsibility:
- Understanding individual roles in national initiatives
- Awareness of environmental conservation importance
- Recognition of collective action benefits
- Development of responsible citizenship attitudes
Assessment Skills:
Visual Text Comprehension:
- Systematic approach to reading visual materials
- Accurate extraction of specific information
- Logical interpretation of design elements
- Clear articulation of analytical observations
Mathematical Application:
- Basic calculations using real-world data
- Percentage understanding and manipulation
- Comparison of statistical information
- Practical application of mathematical concepts
Common Challenges:
Student Difficulties:
- Distinguishing between explicitly stated and inferred information
- Making accurate calculations from visual data
- Understanding the relationship between design choices and purposes
- Providing specific evidence to support analytical observations
Teaching Strategies:
- Practice with various types of visual texts
- Step-by-step instruction in data interpretation
- Modeling of analytical thinking processes
- Regular discussion of current events and local issues
Free quiz and exam paper access
Enter your details to view this paper
Your access is remembered on this device.