AI Generated Quiz
Primary 4 Mathematics Data Analysis Quiz
Free P4 Maths Data Analysis quiz, Qwen3.7 AI version, with questions, answers, and syllabus-aligned practice for Singapore students.
These static practice materials are generated from the site's syllabus and paper-generation workflow, with source and model context shown so students and parents can evaluate the material before use.
Questions
Primary 4 Mathematics Quiz - Data Analysis
Name: __________________________
Class: __________________________
Date: __________________________
Score: _________ / 30
Duration: 45 minutes
Total Marks: 30
Instructions:
- Answer all questions.
- Write your answers in the spaces provided.
- For questions requiring working, show your steps clearly.
- This quiz covers reading and interpreting tables, bar graphs, and line graphs. It does not cover calculating averages (mean).
Section A: Tables (Questions 1–5)
Each question carries 1 mark.
Use the table below to answer Questions 1 to 3.
The table shows the number of books borrowed by four students from the school library in one week.
| Student | Mon | Tue | Wed | Thu | Fri |
|---|---|---|---|---|---|
| Ali | 2 | 3 | 1 | 4 | 2 |
| Bala | 1 | 1 | 2 | 1 | 3 |
| Chandra | 3 | 2 | 4 | 2 | 1 |
| Devi | 0 | 2 | 3 | 3 | 2 |
-
How many books did Ali borrow on Thursday?
Answer: __________
-
Which student borrowed the most books on Wednesday?
Answer: __________
-
How many books did Devi borrow in total from Monday to Friday?
Answer: __________
Use the table below to answer Questions 4 and 5.
The table shows the sales of ice cream flavours at a shop on Saturday.
| Flavour | Number of Scoops Sold |
|---|---|
| Chocolate | 45 |
| Vanilla | 30 |
| Strawberry | 25 |
| Mint | 15 |
-
How many more scoops of Chocolate were sold than Strawberry?
Answer: __________
-
What is the total number of scoops sold for Vanilla and Mint combined?
Answer: __________
Section B: Bar Graphs (Questions 6–12)
Questions 6–9 carry 1 mark each. Questions 10–12 carry 2 marks each.
Use the bar graph below to answer Questions 6 to 9.
The bar graph shows the number of visitors to a museum from January to April.
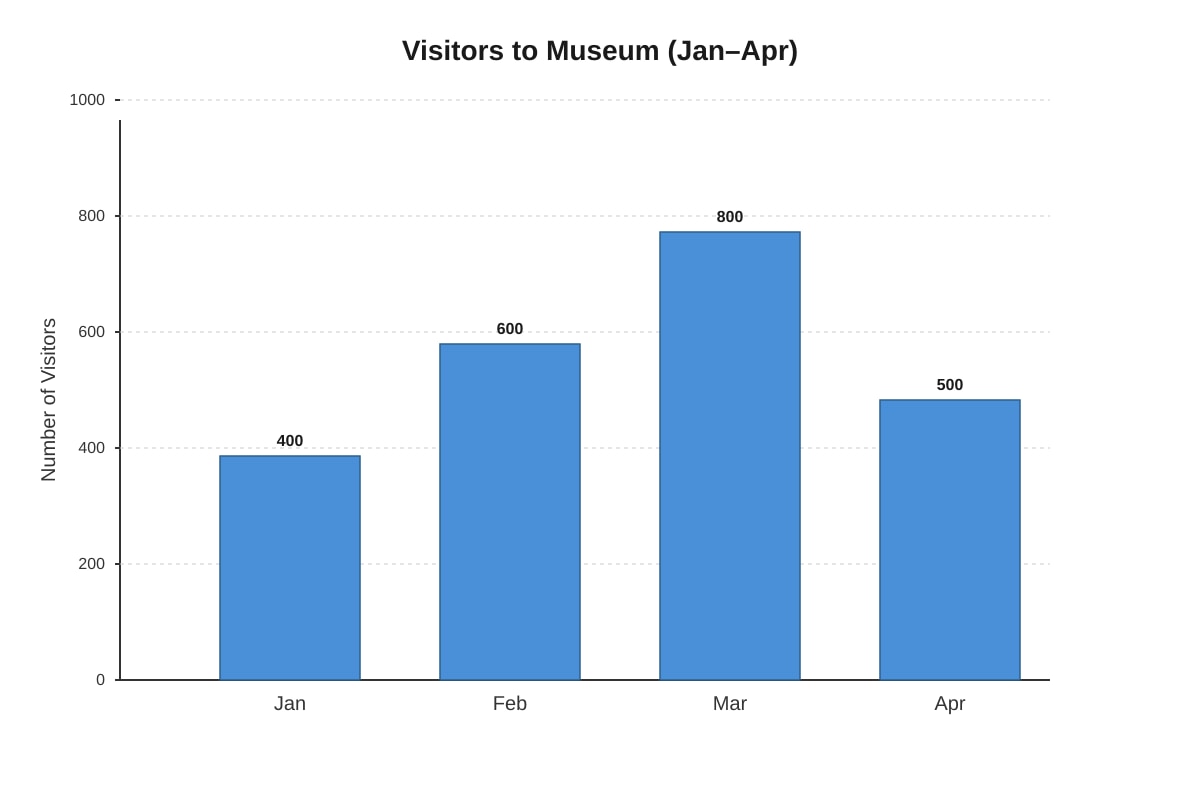
Generated bar_graph for Q6.
-
How many visitors were there in January?
Answer: __________
-
In which month were there the most visitors?
Answer: __________
-
How many more visitors were there in March than in January?
Answer: __________
-
True or False: The number of visitors in April was less than in February.
Answer: __________
Use the bar graph below to answer Questions 10 to 12.
The bar graph shows the points scored by four teams in a quiz competition.
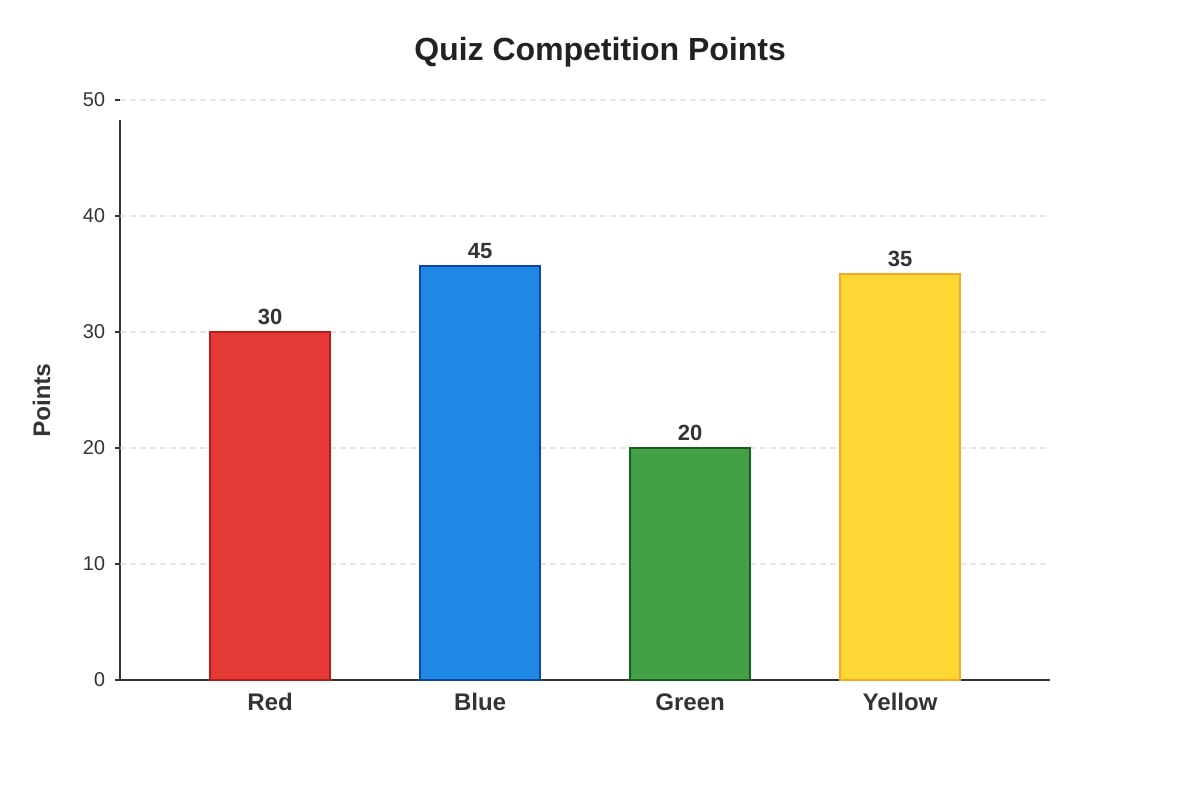
Generated bar_graph for Q10.
-
Which two teams scored a total of 50 points?
Answer: __________ and __________
-
How many points did the Blue team score more than the Green team?
Answer: __________
-
If the winning team receives a prize of $10 for every 5 points scored, how much money does the winning team receive?
Answer: $__________
Section C: Line Graphs (Questions 13–17)
Questions 13–15 carry 1 mark each. Questions 16–17 carry 2 marks each.
Use the line graph below to answer Questions 13 to 15.
The line graph shows the temperature of a cup of hot tea over 10 minutes.
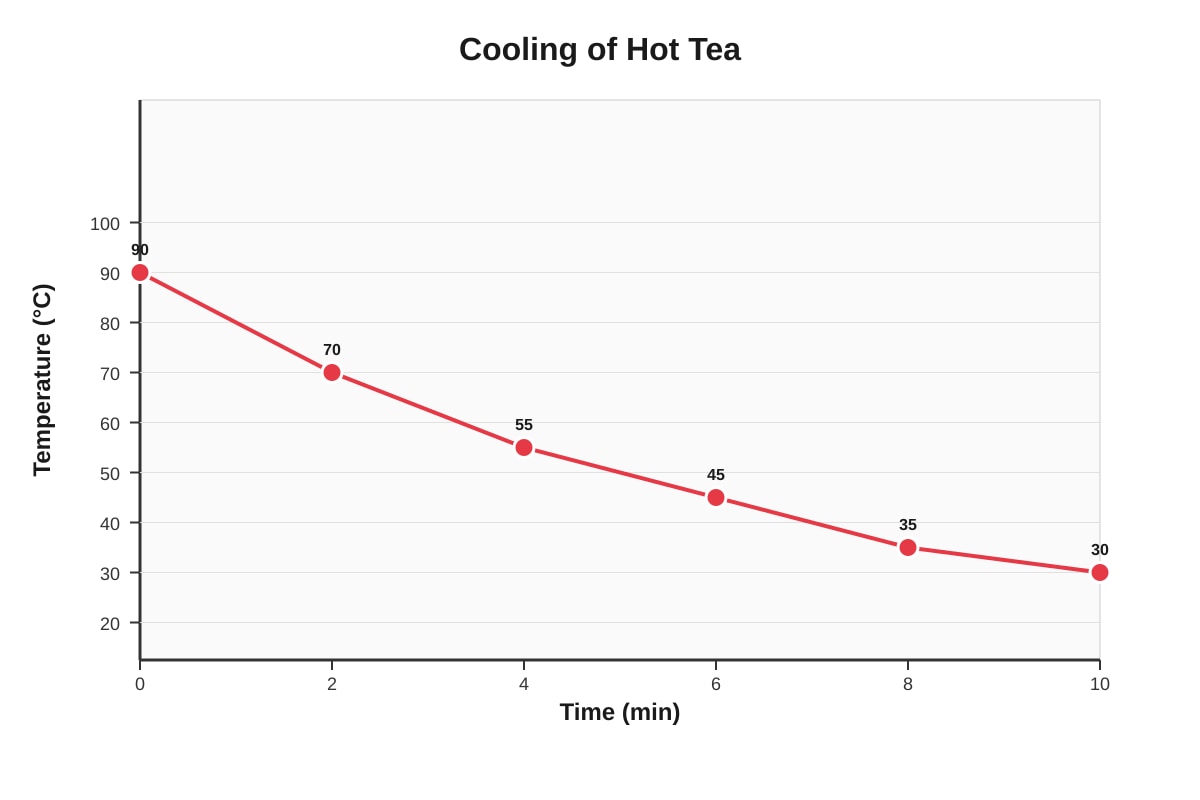
Generated line_graph for Q13.
-
What was the temperature of the tea at the start (0 minutes)?
Answer: __________ °C
-
What was the temperature of the tea after 6 minutes?
Answer: __________ °C
-
During which 2-minute interval did the temperature drop the most? (Circle one) A) 0 to 2 min B) 2 to 4 min C) 4 to 6 min D) 6 to 8 min
Answer: __________
Use the line graph below to answer Questions 16 and 17.
The line graph shows the number of customers at a bakery from 9 a.m. to 1 p.m.
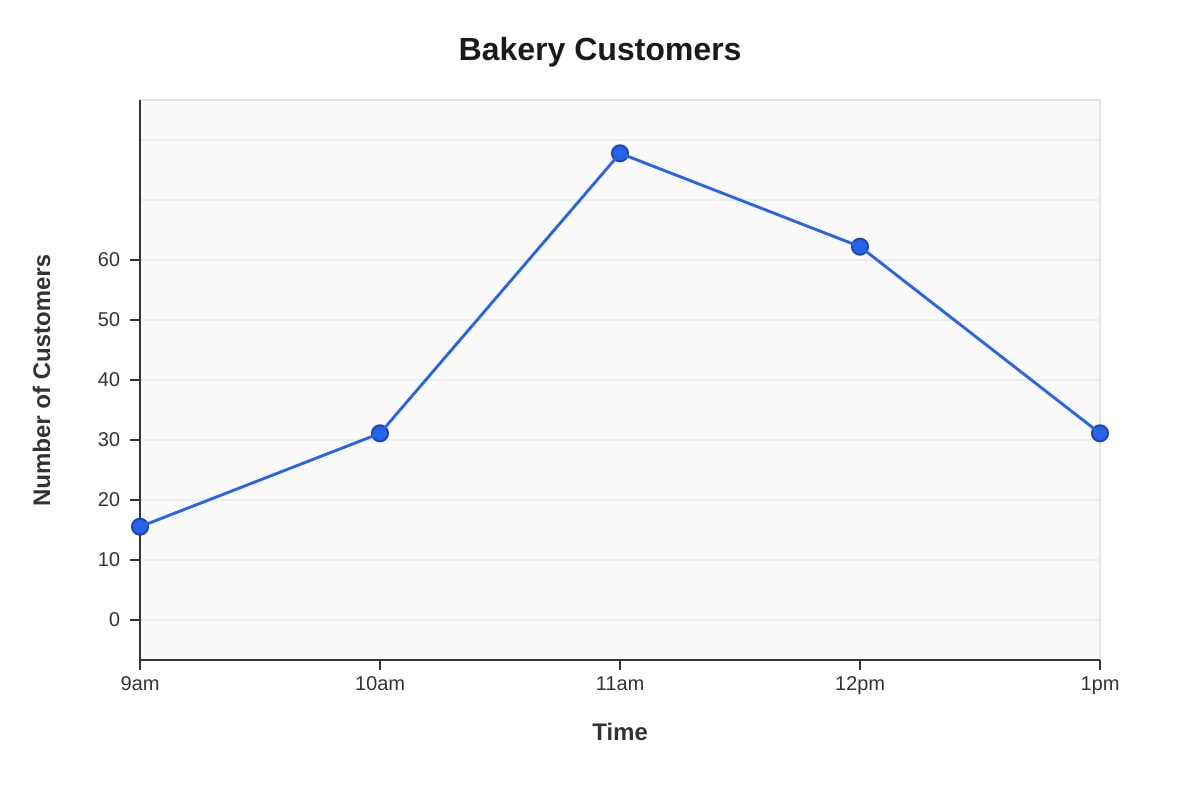
Generated line_graph for Q16.
-
At what time was the number of customers the highest?
Answer: __________
-
How many more customers were there at 11 a.m. than at 9 a.m.?
Answer: __________
Section D: Problem Solving with Data (Questions 18–20)
Each question carries 2 marks.
-
The table below shows the number of stickers collected by three friends.
Friend Stickers John 120 Mary 150 Siti ? Siti collected 30 fewer stickers than Mary. How many stickers did they collect altogether?
<br><br><br> Answer: __________
-
The bar graph shows the number of trees planted by four classes.
- Class 4A: 15 trees
- Class 4B: 20 trees
- Class 4C: 10 trees
- Class 4D: 25 trees
If each tree costs $5 to plant, how much did Class 4B and Class 4D spend together?
<br><br><br> Answer: $__________
-
The line graph shows the distance run by Tom over 5 days.
- Day 1: 2 km
- Day 2: 3 km
- Day 3: 2 km
- Day 4: 4 km
- Day 5: 5 km
Tom wants to run a total of 20 km over 6 days. How far must he run on Day 6 to reach his goal?
<br><br><br> Answer: __________ km
[End of Quiz]
Answers
Primary 4 Mathematics Quiz - Data Analysis (Answer Key)
Total Marks: 30
Section A: Tables
1. How many books did Ali borrow on Thursday?
- Answer: 4
- Explanation: Look at the row for "Ali" and the column for "Thu". The value is 4.
- Marks: 1
2. Which student borrowed the most books on Wednesday?
- Answer: Chandra
- Explanation: Look at the "Wed" column. Ali: 1, Bala: 2, Chandra: 4, Devi: 3. The highest number is 4, which belongs to Chandra.
- Marks: 1
3. How many books did Devi borrow in total from Monday to Friday?
- Answer: 10
- Explanation: Add the values in Devi's row: 0+2+3+3+2=10.
- Marks: 1
4. How many more scoops of Chocolate were sold than Strawberry?
- Answer: 20
- Explanation: Chocolate = 45, Strawberry = 25. Difference: 45−25=20.
- Marks: 1
5. What is the total number of scoops sold for Vanilla and Mint combined?
- Answer: 45
- Explanation: Vanilla = 30, Mint = 15. Total: 30+15=45.
- Marks: 1
Section B: Bar Graphs
6. How many visitors were there in January?
- Answer: 400
- Explanation: Look at the bar for "Jan". The top of the bar aligns with the 400 mark on the vertical axis.
- Marks: 1
7. In which month were there the most visitors?
- Answer: March
- Explanation: The tallest bar represents the most visitors. The bar for "Mar" is the tallest, reaching 800.
- Marks: 1
8. How many more visitors were there in March than in January?
- Answer: 400
- Explanation: March visitors = 800. January visitors = 400. Difference: 800−400=400.
- Marks: 1
9. True or False: The number of visitors in April was less than in February.
- Answer: True
- Explanation: April visitors = 500. February visitors = 600. Since 500<600, the statement is true.
- Marks: 1
10. Which two teams scored a total of 50 points?
- Answer: Red and Green
- Explanation: Red scored 30. Green scored 20. 30+20=50. (Blue is 45, Yellow is 35; no other pair adds to 50).
- Marks: 2 (1 for each correct team name)
11. How many points did the Blue team score more than the Green team?
- Answer: 25
- Explanation: Blue scored 45. Green scored 20. Difference: 45−20=25.
- Marks: 2
12. If the winning team receives a prize of $10 for every 5 points scored, how much money does the winning team receive?
- Answer: $90
- Explanation:
- Identify the winning team: Blue scored the highest (45 points).
- Calculate how many sets of 5 points are in 45: 45÷5=9 sets.
- Calculate prize money: 9 \times \10 = $90$.
- Marks: 2 (1 for identifying correct points/team, 1 for final calculation)
Section C: Line Graphs
13. What was the temperature of the tea at the start (0 minutes)?
- Answer: 90
- Explanation: At Time = 0, the point on the graph aligns with 90 on the Temperature axis.
- Marks: 1
14. What was the temperature of the tea after 6 minutes?
- Answer: 45
- Explanation: At Time = 6, the point on the graph aligns with 45 on the Temperature axis (halfway between 40 and 50).
- Marks: 1
15. During which 2-minute interval did the temperature drop the most?
- Answer: A) 0 to 2 min
- Explanation:
- 0 to 2 min: 90−70=20°C drop.
- 2 to 4 min: 70−55=15°C drop.
- 4 to 6 min: 55−45=10°C drop.
- 6 to 8 min: 45−35=10°C drop.
- The largest drop is 20°C.
- Marks: 1
16. At what time was the number of customers the highest?
- Answer: 11 a.m.
- Explanation: The highest point on the line graph is at 11 a.m., corresponding to 50 customers.
- Marks: 2
17. How many more customers were there at 11 a.m. than at 9 a.m.?
- Answer: 40
- Explanation:
- Customers at 11 a.m. = 50.
- Customers at 9 a.m. = 10.
- Difference: 50−10=40.
- Marks: 2
Section D: Problem Solving with Data
18. Siti collected 30 fewer stickers than Mary. How many stickers did they collect altogether?
- Answer: 390
- Explanation:
- Find Siti's stickers: Mary has 150. Siti has 150−30=120.
- Find total: John (120) + Mary (150) + Siti (120).
- 120+150+120=390.
- Marks: 2 (1 for finding Siti's amount, 1 for correct total)
19. If each tree costs $5 to plant, how much did Class 4B and Class 4D spend together?
- Answer: $225
- Explanation:
- Find total trees for 4B and 4D: 20+25=45 trees.
- Calculate cost: 45 \times \5$.
- 45×5=225.
- Marks: 2 (1 for correct tree count, 1 for correct cost)
20. Tom wants to run a total of 20 km over 6 days. How far must he run on Day 6 to reach his goal?
- Answer: 4 km
- Explanation:
- Calculate total distance run in first 5 days: 2+3+2+4+5=16 km.
- Subtract from goal: 20−16=4 km.
- Marks: 2 (1 for sum of first 5 days, 1 for final subtraction)
Free quiz and exam paper access
Enter your details to view this paper
Your access is remembered on this device.