AI Generated Quiz
Primary 4 Mathematics Data Analysis Quiz
Free P4 Maths Data Analysis quiz, Kimi2.6 AI version, with questions, answers, and syllabus-aligned practice for Singapore students.
These static practice materials are generated from the site's syllabus and paper-generation workflow, with source and model context shown so students and parents can evaluate the material before use.
Questions
Primary 4 Mathematics Quiz - Data Analysis
Name: _________________________ Class: ___________ Date: ___________
Duration: 40 minutes
Total Marks: 40 marks
Instructions: Answer all questions. Show your working clearly.
Section A: Tables and Lists (Questions 1-7, 14 marks)
Answer all questions. Each question carries 2 marks unless stated otherwise.
1. The table below shows the number of books borrowed from a school library in a week.
| Day | Monday | Tuesday | Wednesday | Thursday | Friday |
|---|---|---|---|---|---|
| Books borrowed | 145 | 203 | 178 | 256 | 198 |
(a) On which day were the most books borrowed? (1 mark)
(b) How many more books were borrowed on Thursday than on Monday? (1 mark)
2. The table shows the favourite sports of 80 Primary 4 students.
| Sport | Swimming | Badminton | Basketball | Soccer | Running |
|---|---|---|---|---|---|
| Number of students | 18 | 24 | 16 | 15 | ? |
(a) How many students chose Running? (1 mark)
(b) Which two sports were chosen by exactly 40 students altogether? (1 mark)
3. A shop sells four types of fruits. The table shows their prices per kilogram.
| Fruit | Apple | Orange | Pear | Grapes |
|---|---|---|---|---|
| Price per kg | $4.50 | $3.80 | $5.20 | $7.90 |
Ming has $20. He wants to buy 2 kg of oranges and 1 kg of apples.
(a) How much does Ming need to pay? (1 mark)
(b) Does Ming have enough money? If not, how much more does he need? (1 mark)
4. The table shows the temperature in four cities on a certain day.
| City | Tokyo | Seoul | Bangkok | Singapore |
|---|---|---|---|---|
| Temperature (°C) | 12 | 5 | 34 | 31 |
(a) What is the difference in temperature between the hottest and coldest city? (1 mark)
(b) The temperature in London was 8°C lower than in Tokyo. What was the temperature in London? (1 mark)
5. The table shows the number of stamps in three collections.
| Collector | Local stamps | Foreign stamps | Total |
|---|---|---|---|
| Ali | 45 | 38 | ? |
| Ben | 62 | 29 | ? |
| Charlie | 51 | ? | 97 |
(a) Complete the table by filling in the three missing numbers. (1 mark)
(b) Who has the most stamps altogether? (1 mark)
6. A survey was done to find how students travel to school. The results are shown below.
| Mode of transport | Walk | Bus | MRT | Car | Bicycle |
|---|---|---|---|---|---|
| Number of students | 35 | 48 | 22 | 18 | 7 |
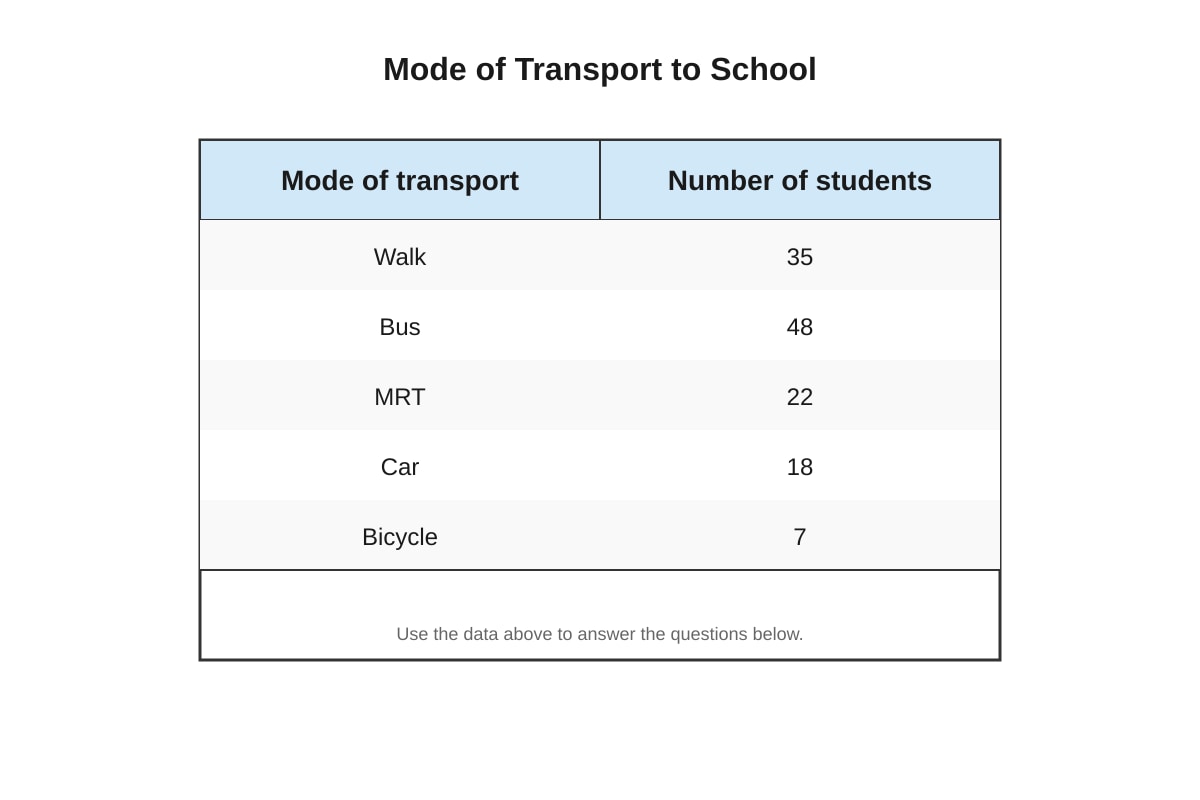
Generated table for Q6.
(a) How many students were surveyed altogether? (1 mark)
(b) How many more students travel by bus than by MRT and bicycle combined? (1 mark)
7. The table shows the scores of four players in a game.
| Player | Round 1 | Round 2 | Round 3 | Total |
|---|---|---|---|---|
| Devi | 85 | 92 | ? | 260 |
| Esther | 78 | ? | 88 | 250 |
| Farhan | 90 | 85 | 87 | ? |
| Gina | ? | 76 | 84 | 245 |
(a) What was Devi's score in Round 3? (1 mark)
(b) Which player had the highest total score? (1 mark)
Section B: Line Graphs (Questions 8-14, 14 marks)
8. The line graph below shows the height of a plant over 5 weeks.
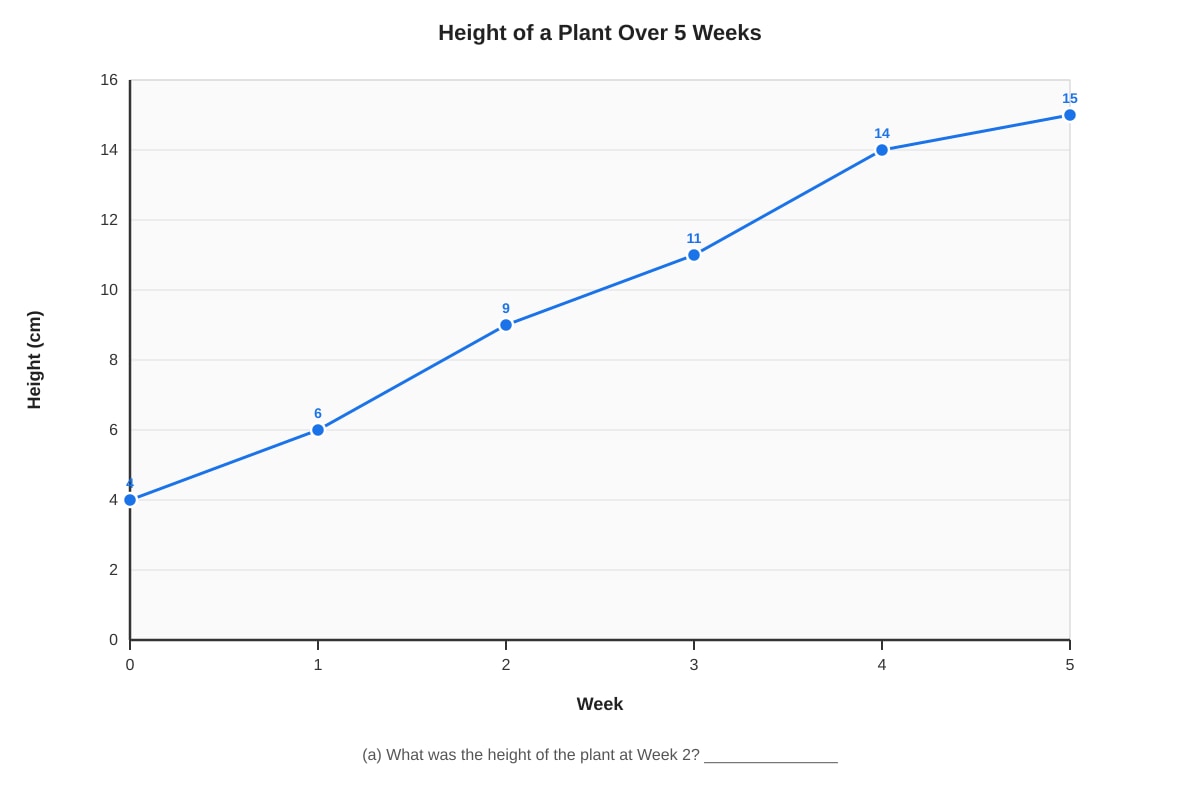
Generated graph for Q8.
(a) What was the height of the plant at Week 2? (1 mark)
(b) Between which two weeks did the plant grow the most? (1 mark)
9. The line graph shows the amount of water in a tank over 6 hours.
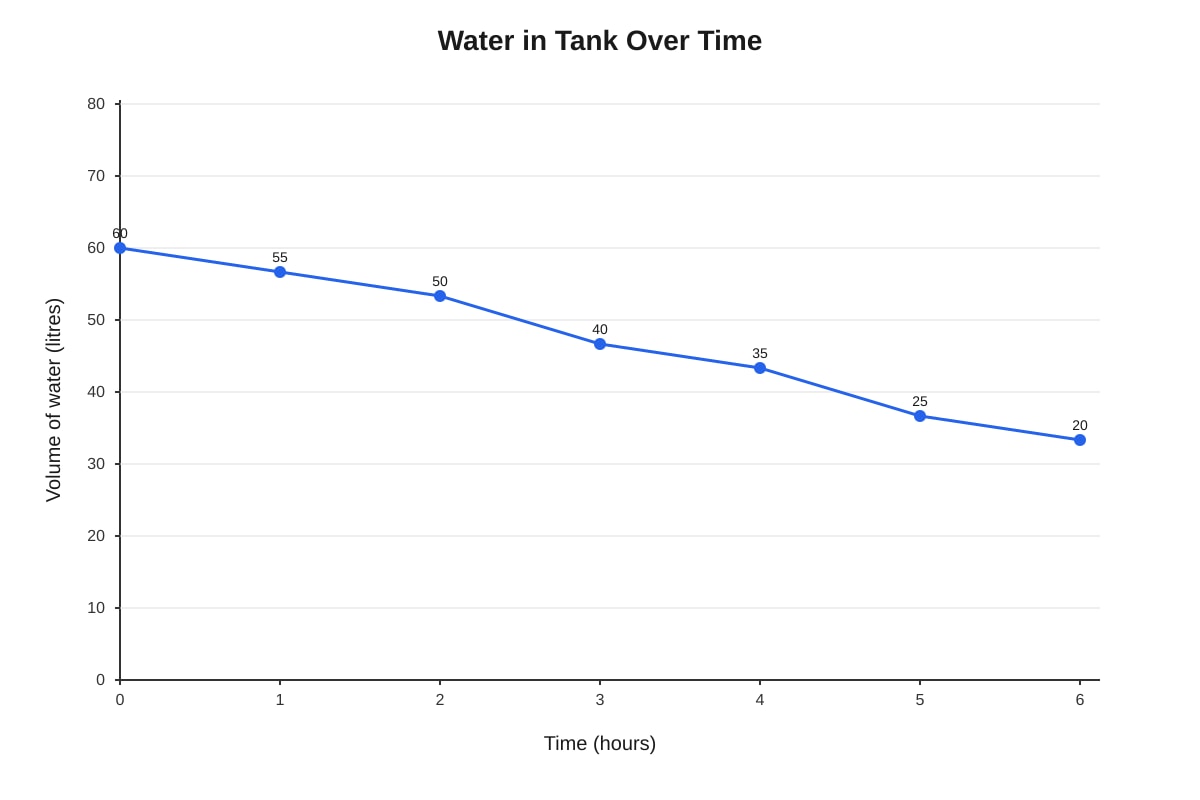
Generated graph for Q9.
(a) How much water was in the tank at the start? (1 mark)
(b) How much water was lost between Hour 2 and Hour 5? (1 mark)
10. The line graph shows the maximum daily temperature for the first week of July.
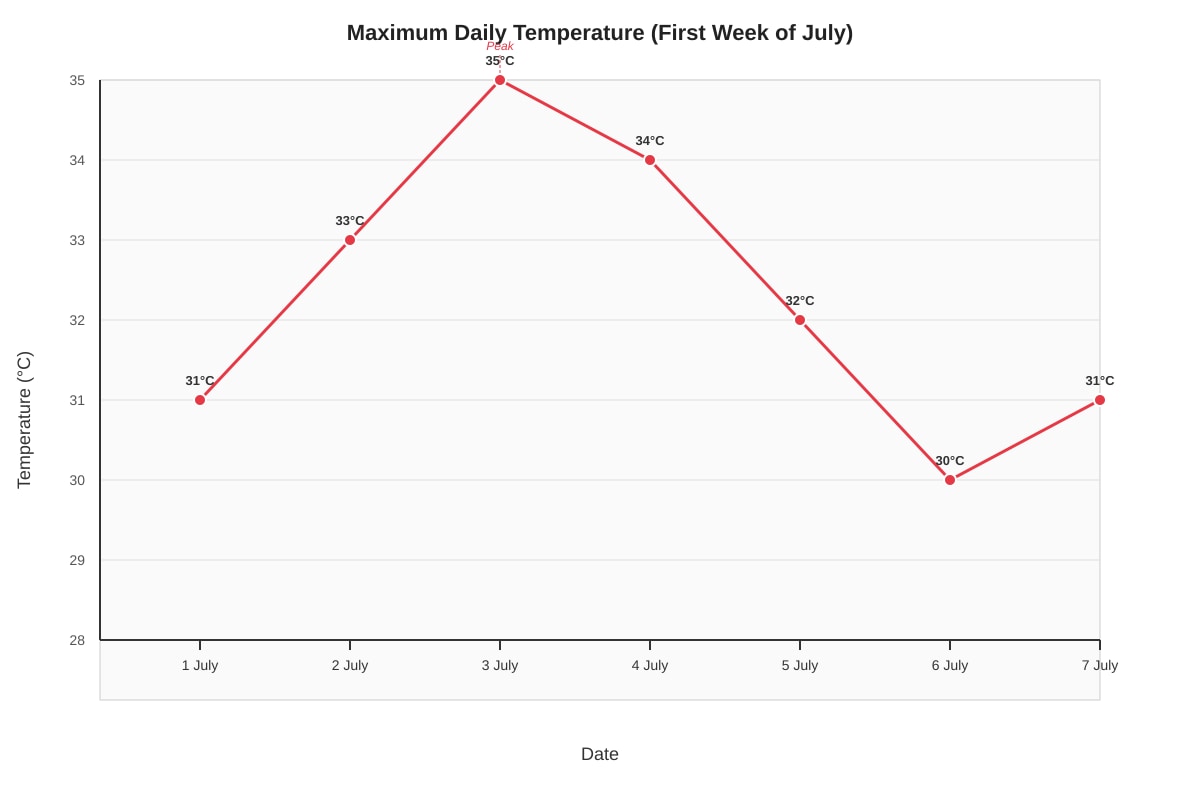
Generated graph for Q10.
(a) On which date was the temperature the highest? (1 mark)
(b) What was the increase in temperature from 1 July to 3 July? (1 mark)
11. The line graph shows the distance travelled by a cyclist during a race.
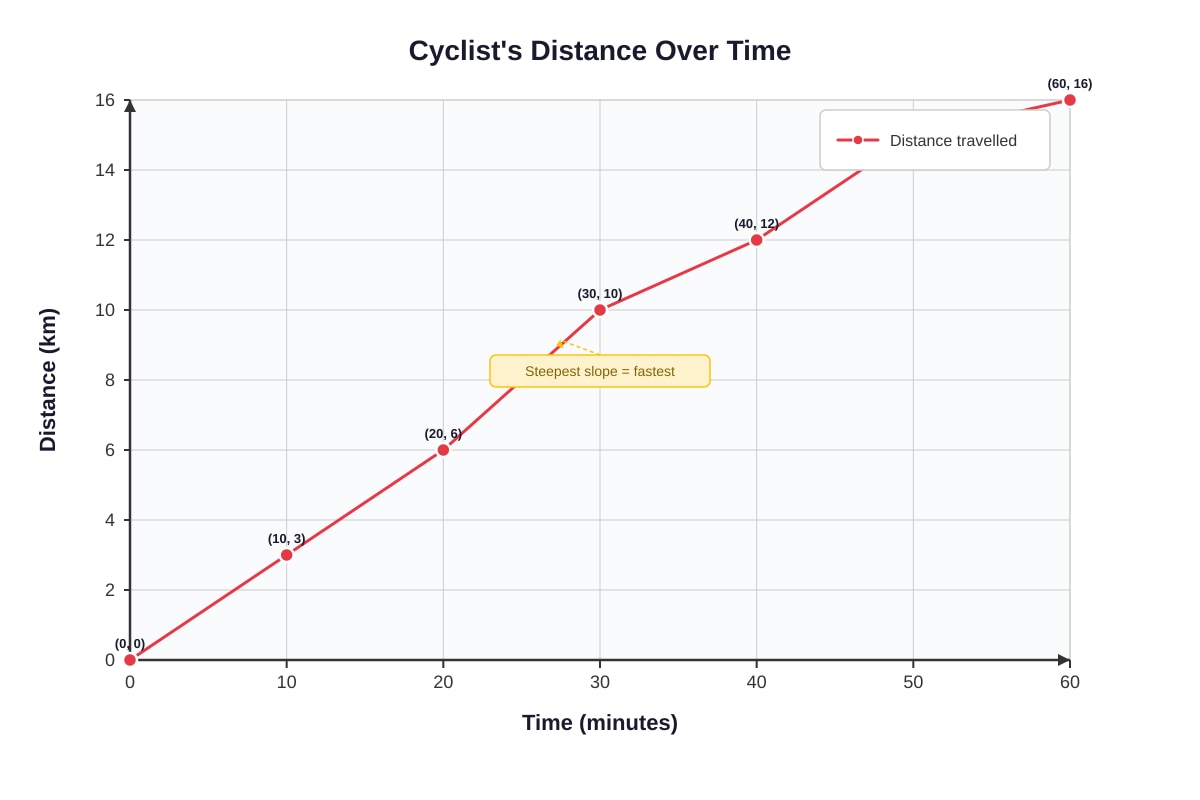
Generated graph for Q11.
(a) How far did the cyclist travel in the first 30 minutes? (1 mark)
(b) During which 10-minute interval was the cyclist fastest? Explain how you can tell from the graph. (2 marks)
12. The line graph shows the number of visitors to a museum over a 6-month period.
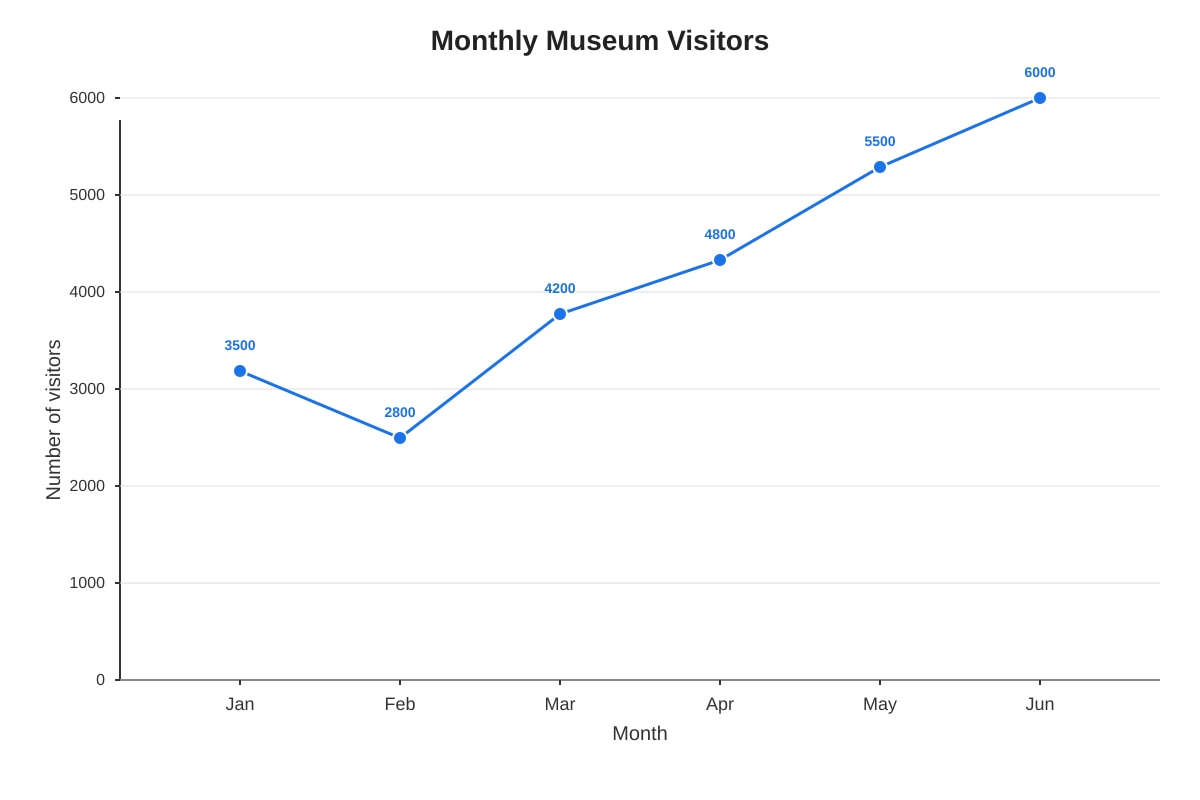
Generated graph for Q12.
(a) In which month were there 4200 visitors? (1 mark)
(b) What was the total number of visitors from March to June? (2 marks)
Working: _______________________________________________
13. The line graph shows the mass of a baby from birth to 6 months old.
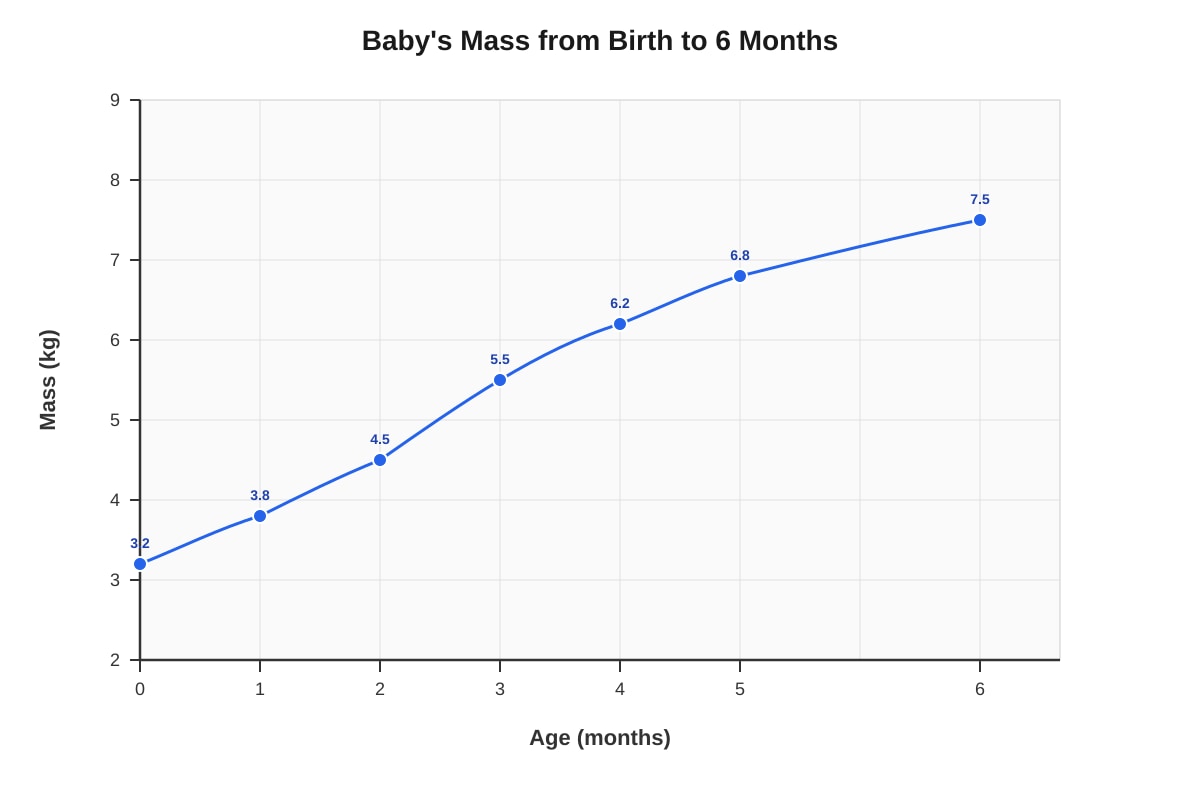
Generated graph for Q13.
(a) What was the baby's mass at 2 months old? (1 mark)
(b) How much mass did the baby gain from birth to 6 months? (1 mark)
(c) During which month did the baby gain the most mass? (1 mark)
14. Two lines are drawn on the same graph to show the sales of ice cream and hot drinks at a café.
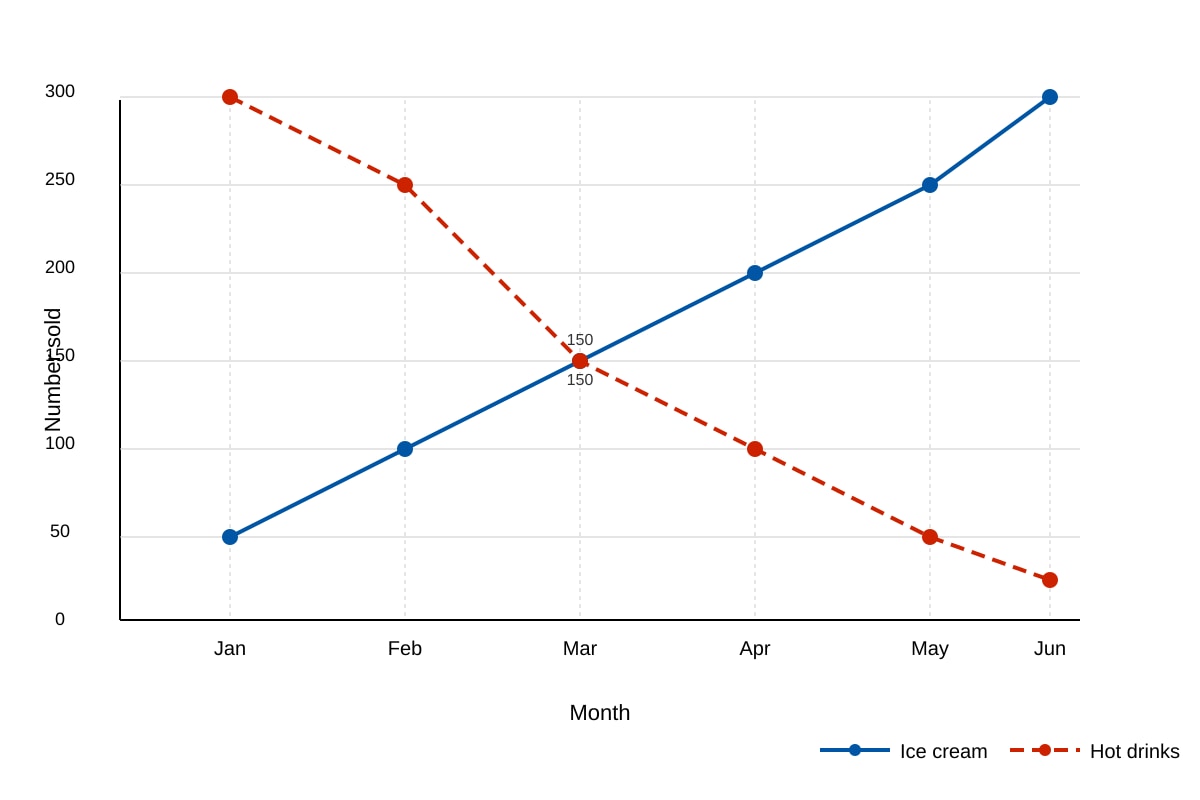
Generated graph for Q14.
(a) In which month were the sales of ice cream and hot drinks the same? (1 mark)
(b) Describe the trend for ice cream sales from January to June. (1 mark)
(c) Why do you think the two lines show opposite patterns? Give a reason. (1 mark)
Section C: Pie Charts (Questions 15-20, 12 marks)
15. The pie chart below shows how 120 students get to school.
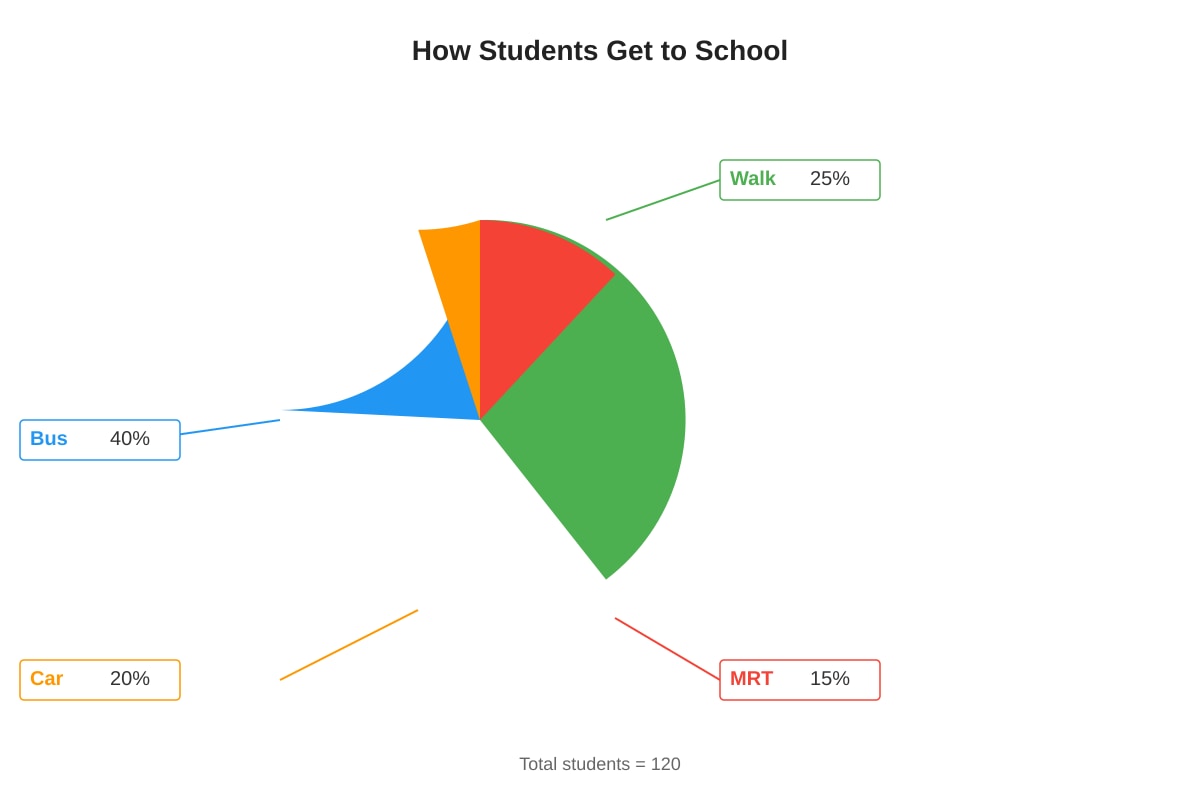
Generated chart for Q15.
(a) How many students walk to school? (2 marks)
Working: _______________________________________________
16. The pie chart shows how Mrs. Tan spent $800 on a family dinner.
Image pending generation: chart for Q16.
(a) What fraction of the total cost was spent on food? Give your answer in simplest form. (2 marks)
Working: _______________________________________________
(b) How much was spent on drinks? (2 marks)
Working: _______________________________________________
17. The pie chart shows the favourite colours of 200 students.
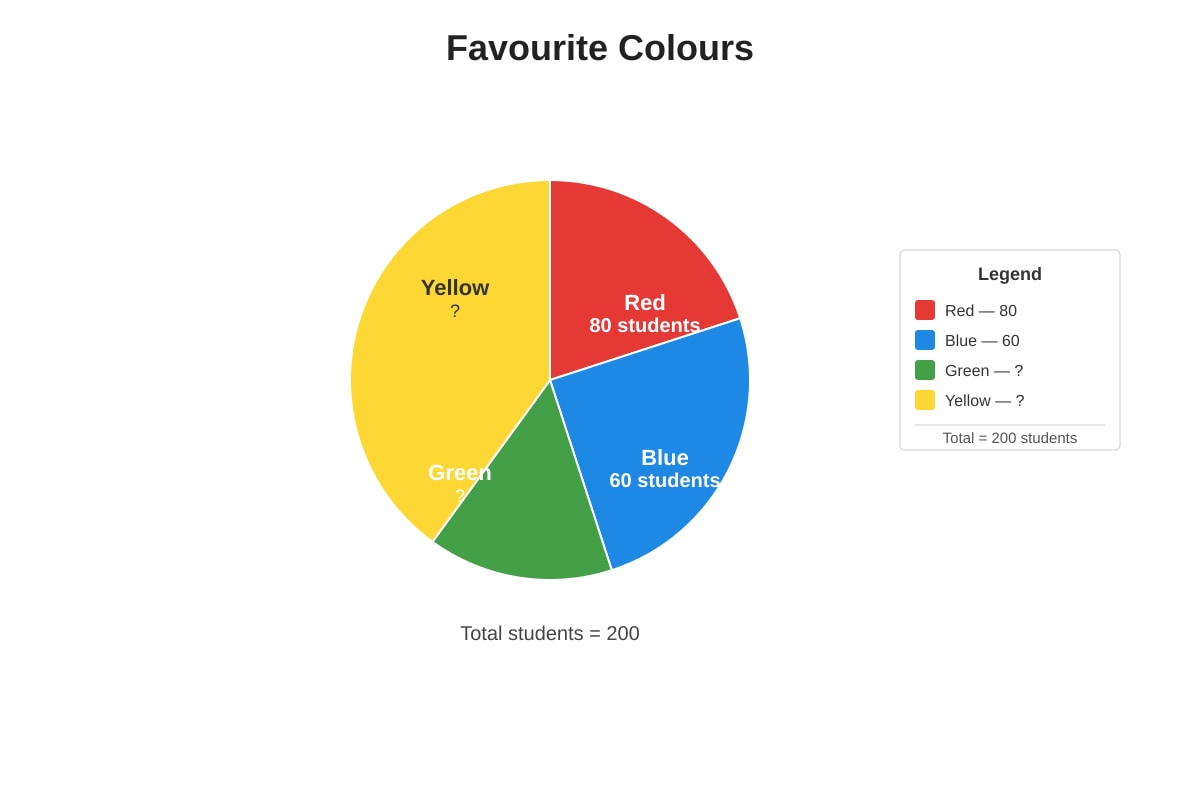
Generated chart for Q17.
(a) How many students chose Green or Yellow altogether? (1 mark)
(b) If Green and Yellow were chosen by equal numbers of students, how many chose Yellow? (2 marks)
Working: _______________________________________________
18. The pie chart shows the types of books in a library of 3600 books.
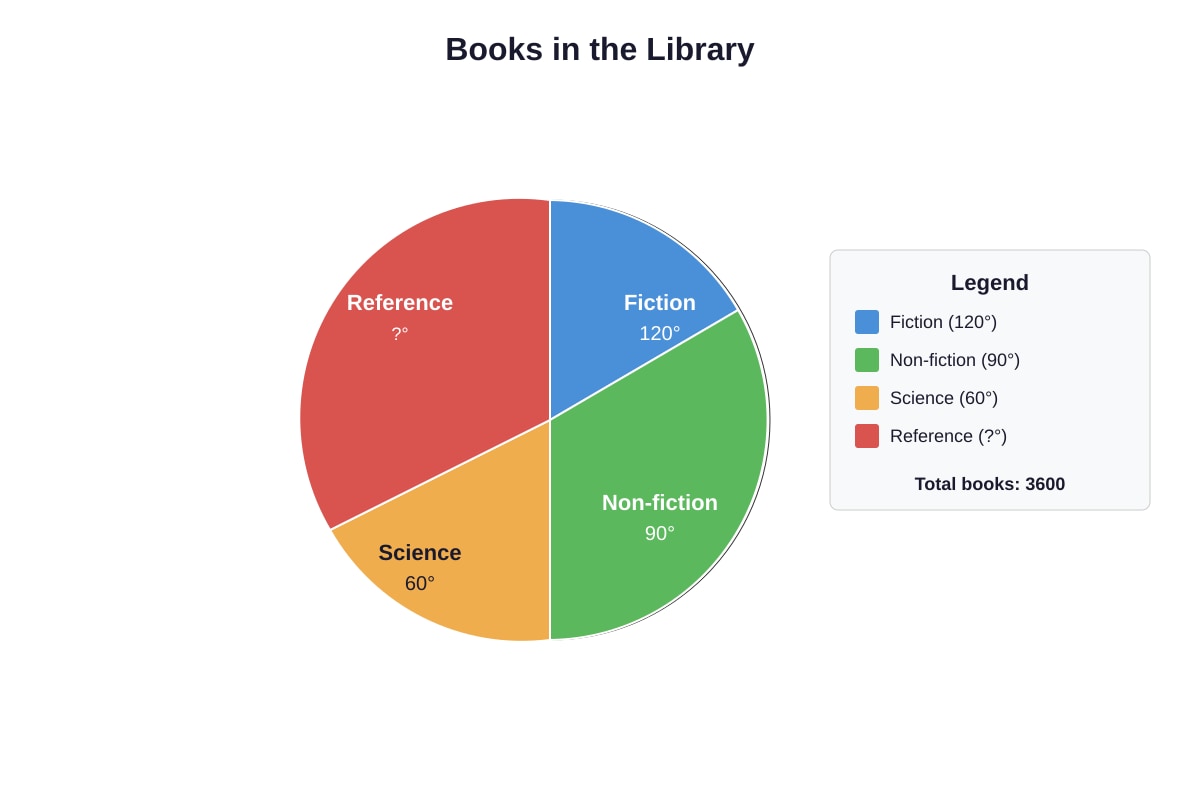
Generated chart for Q18.
(a) What is the angle for the Reference sector? (1 mark)
(b) How many Science books are there? (2 marks)
Working: _______________________________________________
19. The pie chart shows how 60 pupils spent their Saturday morning.
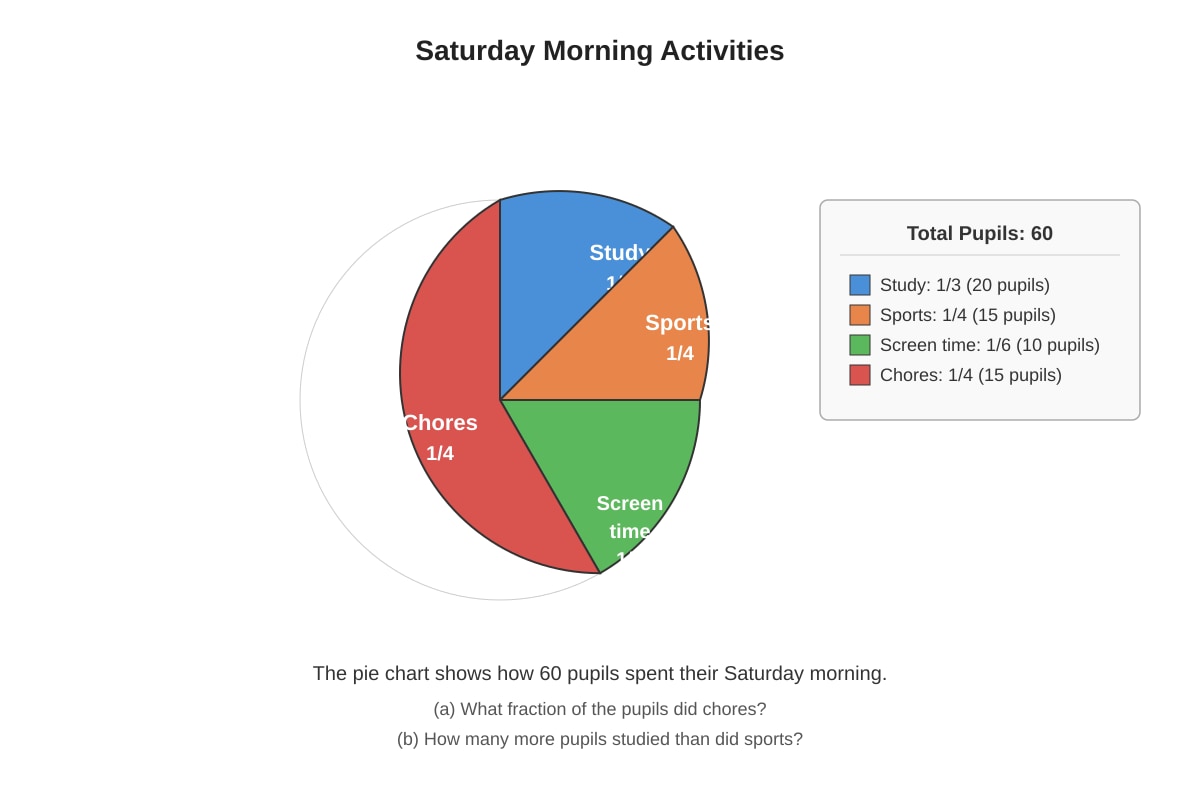
Generated chart for Q19.
(a) What fraction of the pupils did chores? (2 marks)
Working: _______________________________________________
(b) How many more pupils studied than did sports? (2 marks)
Working: _______________________________________________
20. The pie chart shows the results of a survey about favourite pets. Some information is missing.
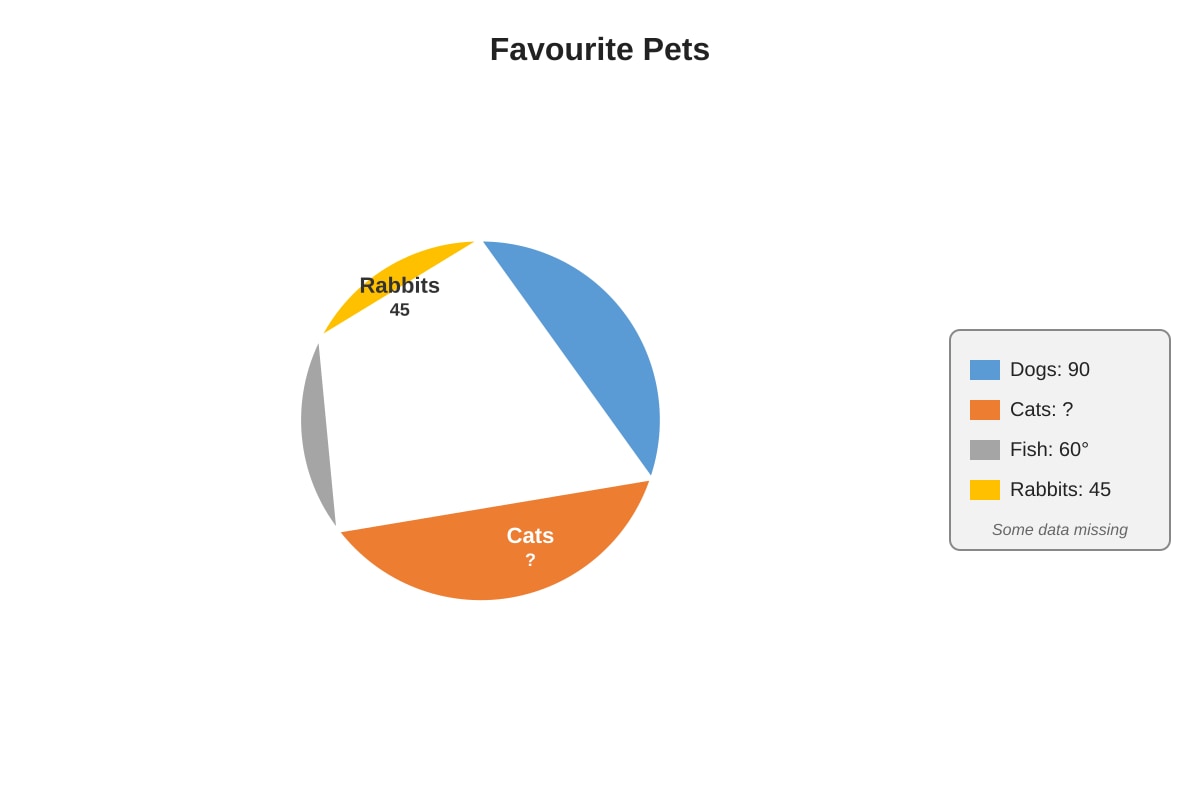
Generated chart for Q20.
Given that Dogs was chosen by 90 people and represents a right angle (90°):
(a) How many people were surveyed altogether? (2 marks)
Working: _______________________________________________
(b) How many people chose Fish? (2 marks)
Working: _______________________________________________
End of Quiz
Answers
Primary 4 Mathematics Quiz - Data Analysis: Answer Key
Total Marks: 40 marks
Duration: 40 minutes
Section A: Tables and Lists (14 marks)
Question 1 (2 marks)
(a) Thursday (1 mark)
Explanation: Compare all values: Monday 145, Tuesday 203, Wednesday 178, Thursday 256, Friday 198. Thursday has the largest number (256).
(b) 111 more books (1 mark)
Working: 256−145=111
Explanation: To find "how many more," subtract the smaller number from the larger number. Thursday (256) minus Monday (145) equals 111.
Question 2 (2 marks)
(a) 7 students (1 mark)
Working: 18+24+16+15=73, then 80−73=7
Explanation: The total must be 80 students. Add up the known values: 18+24+16+15=73. Then subtract from 80 to find the missing number: 80−73=7.
(b) Badminton and Basketball (1 mark)
Explanation: Check pairs: Swimming + Badminton = 18+24=42; Swimming + Basketball = 18+16=34; Badminton + Basketball = 24+16=40 ✓
Question 3 (2 marks)
(a) $12.10 (1 mark)
Working: 2 kg of oranges: 2 \times \3.80 = $7.60;1kgofapples:1 \times $4.50 = $4.50;Total:$7.60 + $4.50 = $12.10$
(b) No, he needs $2.10 more (1 mark)
Working: \12.10 - $20.00 = hedoesn′thaveenough.Actuallyheisshortby$12.10 - $20.00$ — wait, he has MORE than enough.
Correction: Yes, he has enough money. He has \20.00andneeds$12.10.Hehas$20.00 - $12.10 = $7.90$ left over.
Common mistake: Careful with "enough" questions — check which number is larger.
Revised answer: Yes, he has enough money. He will have \7.90$ left.
Question 4 (2 marks)
(a) 29°C (1 mark)
Working: Hottest: Bangkok 34°C; Coldest: Seoul 5°C; Difference: 34−5=29
Explanation: "Difference" means subtraction. Always subtract the smaller from the larger number.
(b) 4°C (1 mark)
Working: 12−8=4
Explanation: "Lower than" means subtract. Tokyo is 12°C, London is 8 degrees lower: 12−8=4.
Question 5 (2 marks)
(a) Ali total: 83; Ben total: 91; Charlie foreign: 46 (1 mark)
Working:
- Ali: 45+38=83
- Ben: 62+29=91
- Charlie: 97−51=46
(b) Ben (1 mark)
Explanation: Compare totals: Ali 83, Ben 91, Charlie 97... wait, Charlie has 97? Let me recheck: Charlie total is given as 97. So Charlie has the most!
Correction: Charlie has the most stamps with 97.
Question 6 (2 marks)
(a) 130 students (1 mark)
Working: 35+48+22+18+7=130
Explanation: "Altogether" means add all categories.
(b) 19 more students (1 mark)
Working: MRT + Bicycle = 22+7=29; Bus - 29 = 48−29=19
Explanation: First combine MRT and Bicycle, then find the difference from Bus.
Question 7 (2 marks)
(a) 83 (1 mark)
Working: 260−85−92=260−177=83
Explanation: Total minus Round 1 minus Round 2 equals Round 3.
(b) Farhan (1 mark)
Working:
- Devi: 260 (given)
- Esther: 250 (given)
- Farhan: 90+85+87=262
- Gina: 245 (given)
Explanation: Farhan has 262, which is the highest total.
Section B: Line Graphs (14 marks)
Question 8 (2 marks)
(a) 9 cm (1 mark)
Explanation: Find Week 2 on the x-axis, move up to the line, then across to the y-axis. The value is 9 cm.
(b) Week 1 to Week 2 (1 mark)
Explanation: Calculate growth each period:
- Week 0 to 1: 6−4=2 cm
- Week 1 to 2: 9−6=3 cm ✓ (most)
- Week 2 to 3: 11−9=2 cm
- Week 3 to 4: 14−11=3 cm
- Week 4 to 5: 15−14=1 cm
Note: Week 1 to 2 and Week 3 to 4 both show 3 cm. Either answer accepted, or state both.
Question 9 (2 marks)
(a) 60 litres (1 mark)
Explanation: "At the start" means time = 0. Read the value at Hour 0, which is 60 litres.
(b) 25 litres (1 mark)
Working: At Hour 2: 50 L; At Hour 5: 25 L; Water lost: 50−25=25 L
Explanation: The graph shows the tank is being emptied (downward trend). Find the values at the two times and subtract.
Question 10 (2 marks)
(a) 3 July (1 mark)
Explanation: The highest point on the line is at 35°C, which corresponds to 3 July.
(b) 4°C (1 mark)
Working: 35−31=4
Explanation: Temperature on 3 July (35°C) minus temperature on 1 July (31°C) = 4°C increase.
Question 11 (3 marks)
(a) 10 km (1 mark)
Explanation: Find 30 minutes on x-axis, read across to line, down to y-axis: 10 km.
(b) From 20 to 30 minutes (1 mark for correct interval); Because the line is steepest / the slope is greatest (1 mark)
Working: Calculate distance per interval:
- 0-10 min: 3 km
- 10-20 min: 6−3=3 km
- 20-30 min: 10−6=4 km ✓ (steepest)
- 30-40 min: 12−10=2 km
- 40-50 min: 15−12=3 km
- 50-60 min: 16−15=1 km
Explanation: On a distance-time graph, the steeper the line, the faster the speed. The steepest segment is 20-30 minutes.
Question 12 (3 marks)
(a) March (1 mark)
Explanation: Read from the graph where value is 4200.
(b) 20,500 visitors (2 marks)
Working: March: 4200; April: 4800; May: 5500; June: 6000
Total: 4200+4800+5500+6000=20,500
Mark breakdown: Correct method (adding four values): 1 mark; Correct answer: 1 mark
Question 13 (3 marks)
(a) 4.5 kg (1 mark)
Explanation: Read value at 2 months from graph.
(b) 4.3 kg (1 mark)
Working: 7.5−3.2=4.3 kg
Explanation: Mass at 6 months minus mass at birth (0 months).
(c) From 2 months to 3 months (1 mark)
Working: Calculate monthly gains:
- 0-1 month: 3.8−3.2=0.6 kg
- 1-2 months: 4.5−3.8=0.7 kg
- 2-3 months: 5.5−4.5=1.0 kg ✓
- 3-4 months: 6.2−5.5=0.7 kg
- 4-5 months: 6.8−6.2=0.6 kg
- 5-6 months: 7.5−6.8=0.7 kg
Question 14 (3 marks)
(a) March (1 mark)
Explanation: The two lines cross at March, where both equal 150.
(b) Ice cream sales increased / went up / rose from January to June (1 mark)
Explanation: Accept any description of increasing trend. The line goes upward from 50 to 300.
(c) Example answer: Because as weather gets warmer, people buy more ice cream and fewer hot drinks (1 mark)
Explanation: Accept any reasonable seasonal explanation. The opposite trends suggest temperature or season affects both products differently.
Section C: Pie Charts (12 marks)
Question 15 (2 marks)
30 students (2 marks)
Working: 25% of 120=10025×120=41×120=30
Alternative: 120÷4=30
Explanation: 25% means one-quarter. Divide 120 by 4 to get 30.
Mark breakdown: Correct percentage conversion or method: 1 mark; Correct answer: 1 mark
Question 16 (4 marks)
(a) 21 (2 marks)
Working: Food angle = 180°. Full circle = 360°. Fraction = 360180=21
Explanation: A half-turn (180°) is half of a full turn (360°).
(b) $200* (2 marks)
Working: Drinks angle = 90°. Fraction = 36090=41
Amount: \frac{1}{4} \times \800 = $200$
Mark breakdown: Correct fraction: 1 mark; Correct calculation: 1 mark
Question 17 (3 marks)
(a) 60 students (1 mark)
Working: 200−80−60=60
Explanation: Total minus Red minus Blue equals Green + Yellow together.
(b) 30 students (2 marks)
Working: 60÷2=30
Explanation: If Green and Yellow are equal, split 60 equally: half each.
Mark breakdown: Correct method (division by 2): 1 mark; Correct answer: 1 mark
Question 18 (3 marks)
(a) 90° (1 mark)
Working: 360−120−90−60=90
Explanation: Angles in a pie chart add to 360°. Subtract known angles from 360°.
(b) 600 books (2 marks)
Working: Science fraction = 36060=61
Number of Science books = 61×3600=600
Mark breakdown: Correct fraction or angle method: 1 mark; Correct answer: 1 mark
Question 19 (4 marks)
(a) 41 (2 marks)
Working: Common denominator for 3, 4, 6 is 12.
31=124; 41=123; 61=122
Sum: 124+3+2=129=43
Chores: 1−43=41
Mark breakdown: Correct common denominator or method: 1 mark; Correct answer: 1 mark
(b) 5 more pupils (2 marks)
Working: Study: 31×60=20 pupils
Sports: 41×60=15 pupils
Difference: 20−15=5
Mark breakdown: Correct values for both: 1 mark; Correct difference: 1 mark
Question 20 (4 marks)
(a) 360 people (2 marks)
Working: 90° represents 90 people.
So 1° represents 1 person.
Full circle 360° represents 360×1=360 people.
Alternative: 90°90=1 person per degree. Total = 360×1=360
Mark breakdown: Correct scaling method: 1 mark; Correct total: 1 mark
(b) 60 people (2 marks)
Working: Fish angle = 60°
Since 1° = 1 person, Fish = 60 people.
Alternative: Fraction = 36060=61; People = 61×360=60
Mark breakdown: Correct method using angle: 1 mark; Correct answer: 1 mark
END OF ANSWER KEY
Total: 40 marks
| Section | Marks |
|---|---|
| A: Tables and Lists | 14 |
| B: Line Graphs | 14 |
| C: Pie Charts | 12 |
| Total | 40 |
Free quiz and exam paper access
Enter your details to view this paper
Your access is remembered on this device.