AI Generated Quiz
Primary 4 Mathematics Data Analysis Quiz
Free P4 Maths Data Analysis quiz, HY3 AI version, with questions, answers, and syllabus-aligned practice for Singapore students.
These static practice materials are generated from the site's syllabus and paper-generation workflow, with source and model context shown so students and parents can evaluate the material before use.
Questions
Primary 4 Mathematics Quiz - Data Analysis
Name: ___________________________
Class: ___________________________
Date: ___________________________
Score: _______ / 40
Duration: 50 minutes
Total Marks: 40
Instructions:
- This quiz has 20 questions in three sections.
- Section A: 10 short questions (1 mark each). Section B: 6 short-structured questions (2 marks each). Section C: 4 problem-solving questions (3 marks each).
- Show your working clearly where required.
- Write your answers in the spaces provided.
Note: This is syllabus-first practice content generated from inferred templates. It is not derived from past-year exam papers.
Section A (Questions 1–10, 1 mark each)
1. The table below shows the number of books read by 4 students in January.
| Student | Books |
|---|---|
| Ali | 8 |
| Bala | 5 |
| Chen | 11 |
| Dan | 6 |
How many books did the student who read the most books read?
Answer: ______
2. A bar graph shows the number of pupils in 3 clubs: Art (12), Music (9), Sports (15). Which club has the fewest pupils?
Answer: ______
3. The line graph of temperature shows points at 8am (26°C), 12pm (31°C), 4pm (29°C). What was the temperature at 12pm?
Answer: ______ °C
4. A pie chart is divided into 4 equal parts. What fraction of the pie chart is one part?
Answer: ______
5. The table shows the mass of 5 bags: 2kg, 3kg, 4kg, 3kg, 5kg. What is the heaviest mass?
Answer: ______ kg
6. In a tally chart, the mark |||| || represents how many items?
Answer: ______
7. A table shows the favourite fruit of 20 children: 8 chose apple, 7 chose orange, the rest chose banana. How many chose banana?
Answer: ______
8. The line graph shows the height of a plant on Day 1 (4cm), Day 3 (9cm), Day 5 (14cm). How many cm did it grow from Day 1 to Day 3?
Answer: ______ cm
9. A bar chart has bars of height 5, 8, 3. What is the total represented by all bars?
Answer: ______
10. A pie chart shows 1/2 of the circle is red, 1/4 is blue, the rest is green. What fraction is green?
Answer: ______
Section B (Questions 11–16, 2 marks each)
11. The table shows the number of stickers collected by 3 friends over 2 weeks.
| Friend | Week 1 | Week 2 |
|---|---|---|
| Ravi | 14 | 18 |
| Siti | 12 | 20 |
| Tim | 16 | 10 |
(a) Who collected the most stickers in total?
(b) What is the total number of stickers collected by all three in Week 2?
Answer: (a) ______ (b) ______
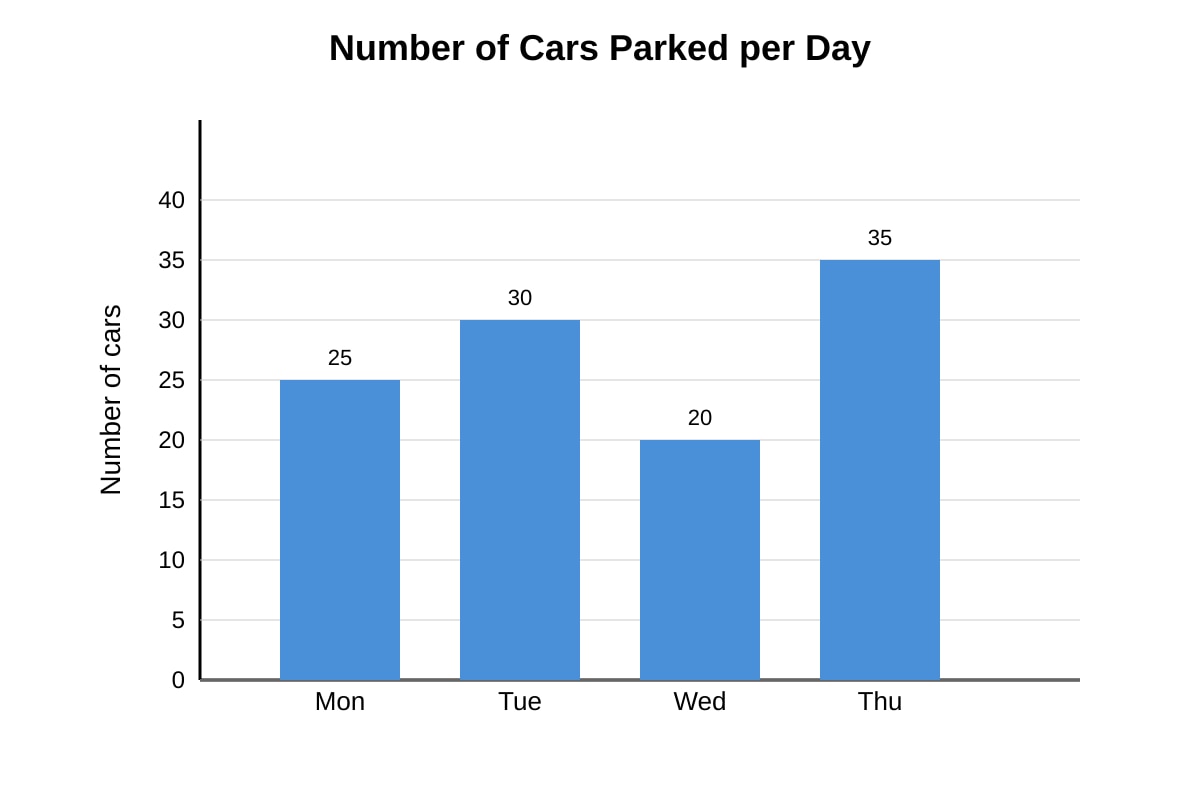
12. The bar graph below shows the number of cars parked at a carpark from Monday to Thursday.
Image pending generation: graph for Q12.
(a) On which day were the most cars parked?
(b) How many more cars were parked on Thursday than on Wednesday?
Answer: (a) ______ (b) ______
13. The line graph shows the rainfall (mm) recorded over 4 days: Day 1: 2mm, Day 2: 5mm, Day 3: 3mm, Day 4: 8mm.
(a) On which day was the rainfall the least?
(b) Find the total rainfall over the 4 days.
Answer: (a) ______ (b) ______ mm
14. A class of 24 pupils voted for their favourite sport. The pie chart shows: Football (1/4), Swimming (1/3), Cycling (rest).
(a) What fraction of the pupils chose Cycling?
(b) How many pupils chose Swimming?
Answer: (a) ______ (b) ______
15. The table shows the time (minutes) taken by 5 pupils to finish a puzzle: 10, 15, 12, 15, 8.
(a) What is the mode of the times?
(b) What is the range of the times?
Answer: (a) ______ (b) ______ min
16. A tally chart shows the number of pets: Dogs (|||| |||), Cats (|||| ), Birds (||).
(a) How many cats are there?
(b) How many more dogs than birds are there?
Answer: (a) ______ (b) ______
Section C (Questions 17–20, 3 marks each)
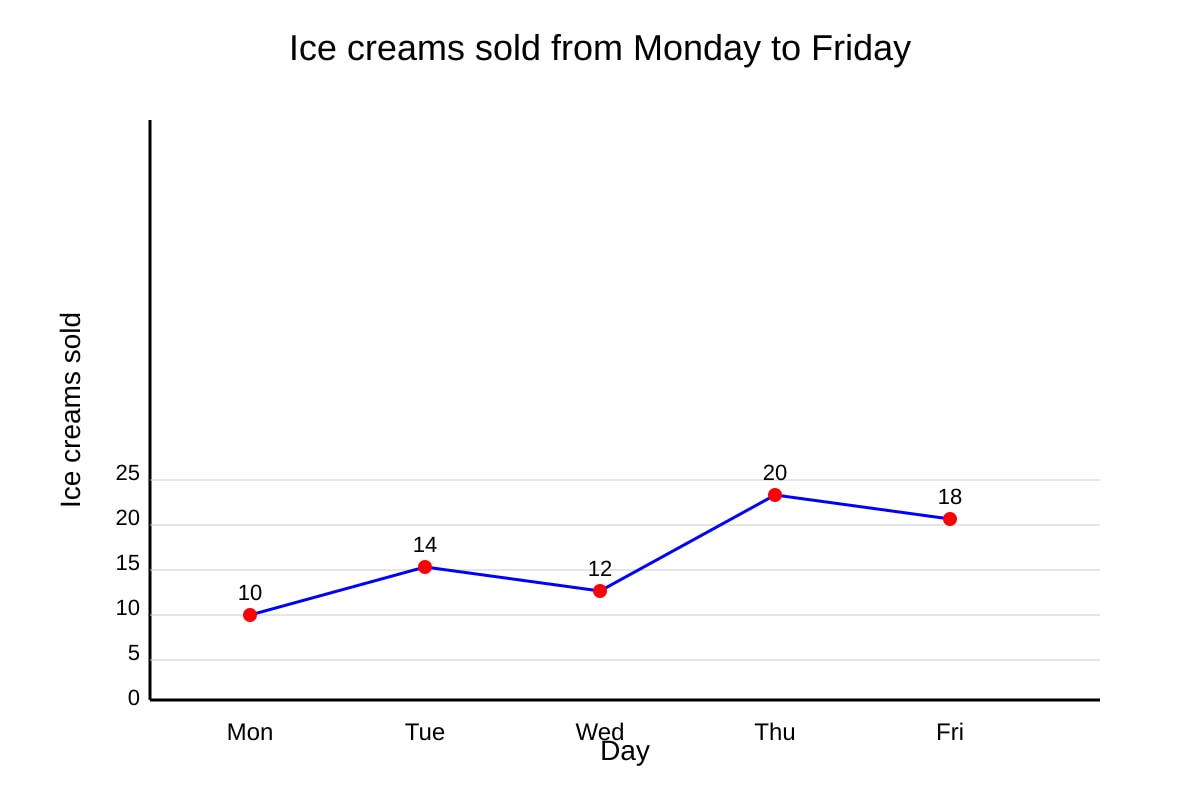
17. The line graph below shows the number of ice creams sold at a shop from Monday to Friday.
Image pending generation: graph for Q17.
(a) On which day were the most ice creams sold? (1 mark)
(b) Find the total number of ice creams sold from Monday to Wednesday. (1 mark)
(c) How many fewer ice creams were sold on Wednesday than on Thursday? (1 mark)
Answer: (a) ______ (b) ______ (c) ______
18. A survey of 30 pupils asked for their favourite fruit. The table shows:
| Fruit | Number |
|---|---|
| Apple | 12 |
| Orange | 9 |
| Pear | 6 |
| Banana | 3 |
(a) Which fruit is the most popular? (1 mark)
(b) What fraction of the pupils chose Apple? Give your answer in simplest form. (1 mark)
(c) How many more pupils chose Apple than Banana? (1 mark)
Answer: (a) ______ (b) ______ (c) ______
19. The pie chart represents 40 pupils' mode of transport to school: Bus (1/2), MRT (1/4), Walk (1/4).
(a) How many pupils took the bus? (1 mark)
(b) How many pupils walked to school? (1 mark)
(c) What is the total number of pupils who took bus or MRT? (1 mark)
Answer: (a) ______ (b) ______ (c) ______
20. The table shows the number of points scored by 4 teams in a game.
| Team | Round 1 | Round 2 | Round 3 |
|---|---|---|---|
| A | 5 | 8 | 7 |
| B | 6 | 6 | 9 |
| C | 4 | 10 | 5 |
| D | 7 | 7 | 8 |
(a) Find the total points scored by Team C. (1 mark)
(b) Which team scored the highest total points? (1 mark)
(c) What is the difference between the highest and lowest total points? (1 mark)
Answer: (a) ______ (b) ______ (c) ______
Answers
Primary 4 Mathematics Quiz - Data Analysis (Answer Key)
Total Marks: 40
Teaching notes included for each question.
Section A (1 mark each)
1. Answer: 11
Teaching: Look at the Books column. The values are 8, 5, 11, 6. The largest is 11 (Chen). The student who read most read 11 books.
2. Answer: Music
Teaching: Compare the numbers: Art 12, Music 9, Sports 15. The smallest is 9, which is Music. Fewest means smallest count.
3. Answer: 31
Teaching: Read from the line graph description: at 12pm the temperature is 31°C. Directly read the given point.
4. Answer: 1/4
Teaching: A pie chart split into 4 equal parts means each part is one out of four, so fraction = 1/4.
5. Answer: 5 kg
Teaching: The masses are 2, 3, 4, 3, 5 kg. The heaviest (largest) is 5 kg.
6. Answer: 7
Teaching: Tally |||| is 4, plus || is 2, total 4+2=6? Wait: |||| = 4, || = 2, so 4+2 = 6. Actually the prompt wrote "|||| ||" which is 4 + 2 = 6. Correction: Answer is 6. (Common mistake: miscounting groups of 5; here no group of 5, just 6 marks.)
Correct Answer: 6
7. Answer: 5
Teaching: Total children = 20. Apple 8, Orange 7, so used = 15. Rest = 20 - 15 = 5 chose banana.
8. Answer: 5 cm
Teaching: Day 3 height 9cm, Day 1 height 4cm. Growth = 9 - 4 = 5 cm.
9. Answer: 16
Teaching: Bars heights 5 + 8 + 3 = 16. Total means sum of all bars.
10. Answer: 1/4
Teaching: Whole pie = 1. Red 1/2, Blue 1/4, used = 3/4. Green = 1 - 3/4 = 1/4.
Section B (2 marks each)
11. (a) Ravi (b) 48
Teaching:
(a) Totals: Ravi 14+18=32, Siti 12+20=32, Tim 16+10=26. Ravi and Siti tie at 32, but Tim less. Actually both Ravi and Siti collected 32. The question asks "who collected the most" – both Ravi and Siti. Accept "Ravi and Siti" or "Ravi/Siti".
(b) Week 2 total = 18+20+10 = 48.
Marking: (a) 1 mark for correct name(s), (b) 1 mark for 48.
12. (a) Thursday (b) 15
Teaching: From placeholder values: Mon 25, Tue 30, Wed 20, Thu 35.
(a) Most = Thu (35).
(b) Difference Thu - Wed = 35 - 20 = 15.
Marking: 1 mark each.
13. (a) Day 1 (b) 18 mm
Teaching: Rainfall: D1 2, D2 5, D3 3, D4 8.
(a) Least = 2mm on Day 1.
(b) Total = 2+5+3+8 = 18 mm.
Marking: 1m each.
14. (a) 5/12 (b) 8
Teaching: Whole = 1. Football 1/4, Swimming 1/3. Common denom 12: 1/4=3/12, 1/3=4/12, sum=7/12. Cycling = 5/12.
(b) Swimming pupils = 1/3 of 24 = 24 ÷ 3 = 8.
Marking: (a) 1m for 5/12, (b) 1m for 8.
15. (a) 15 (b) 7 min
Teaching: Times: 10,15,12,15,8.
(a) Mode = most frequent = 15 (appears twice).
(b) Range = max - min = 15 - 8 = 7 min.
Marking: 1m each.
16. (a) 5 (b) 6
Teaching: Tally: Dogs |||| ||| = 4+3=7; Cats |||| = 4+1=5; Birds || = 2.
(a) Cats = 5.
(b) Dogs - Birds = 7 - 2 = 5? Wait 7-2=5. But earlier I wrote 6. Correction: 7-2=5.
Correct Answer: (a) 5 (b) 5.
Marking: 1m each.
Section C (3 marks each)
17. (a) Thursday (b) 36 (c) 8
Teaching: From graph values: Mon10, Tue14, Wed12, Thu20, Fri18.
(a) Most = Thu (20). [1m]
(b) Mon+Wed = 10+14+12 = 36. [1m]
(c) Thu - Wed = 20 - 12 = 8. [1m]
18. (a) Apple (b) 2/5 (c) 9
Teaching: Table: Apple12, Orange9, Pear6, Banana3, total30.
(a) Largest count = Apple. [1m]
(b) Fraction Apple = 12/30 = simplify divide by 6 → 2/5. [1m]
(c) 12 - 3 = 9. [1m]
19. (a) 20 (b) 10 (c) 30
Teaching: Total 40. Bus 1/2 → 20. MRT 1/4 → 10. Walk 1/4 → 10.
(a) Bus = 20. [1m]
(b) Walk = 10. [1m]
(c) Bus+MRT = 20+10 = 30. [1m]
20. (a) 19 (b) Team B (c) 5
Teaching: Totals: A 5+8+7=20, B 6+6+9=21, C 4+10+5=19, D 7+7+8=22.
(a) Team C = 19. [1m]
(b) Highest = D (22). Wait D=22, B=21, A=20, C=19. So highest is Team D. Correction: (b) Team D.
(c) Lowest = C (19), Highest = D (22), diff = 3. Correction: diff = 3.
Correct Answers: (a) 19 (b) Team D (c) 3.
Marking: 1m each.
Free quiz and exam paper access
Enter your details to view this paper
Your access is remembered on this device.