Primary 4 Mathematics Quiz - Data Analysis
Name: ______________________ Class: ____________ Date: ______________
Subject: Mathematics | Level: Primary 4 | Topic: Data Analysis | Version: Practice Quiz 1 of 5
Duration: 60 minutes | Total Marks: 50
Instructions:
- Answer all 20 questions in the spaces provided.
- Show your working clearly for Questions worth 2 marks or more.
- Include units in your answers where needed (pupils, books, mm, °C, $).
- Check that your answers are reasonable before moving on.
- These are original practice questions written for the P4 syllabus. They are not taken from any past-year paper.
Section A: Reading Tables and Graphs (Questions 1-5, 8 marks)
Question 1. (1 mark)
The table shows the favourite pets of the 36 pupils in Class 4B.
| Pet | Number of Pupils |
|---|
| Dog | 12 |
| Cat | 9 |
| Rabbit | 7 |
| Fish | 5 |
| Hamster | 3 |
How many pupils chose the rabbit as their favourite pet?
Answer: ______________________
Question 2. (1 mark)
Using the same table in Question 1, which pet was the most popular?
Answer: ______________________
Question 3. (2 marks)
The table shows the number of books borrowed from the school library each day last week.
| Day | Number of Books |
|---|
| Monday | 45 |
| Tuesday | 32 |
| Wednesday | 58 |
| Thursday | 41 |
| Friday | 63 |
(a) On which day were the fewest books borrowed? (1 mark)
Answer: ______________________
(b) How many more books were borrowed on Friday than on Monday? (1 mark)
Answer: ______________________
Question 4. (2 marks)
The bar graph shows the favourite sports of the 40 pupils in Class 4D.
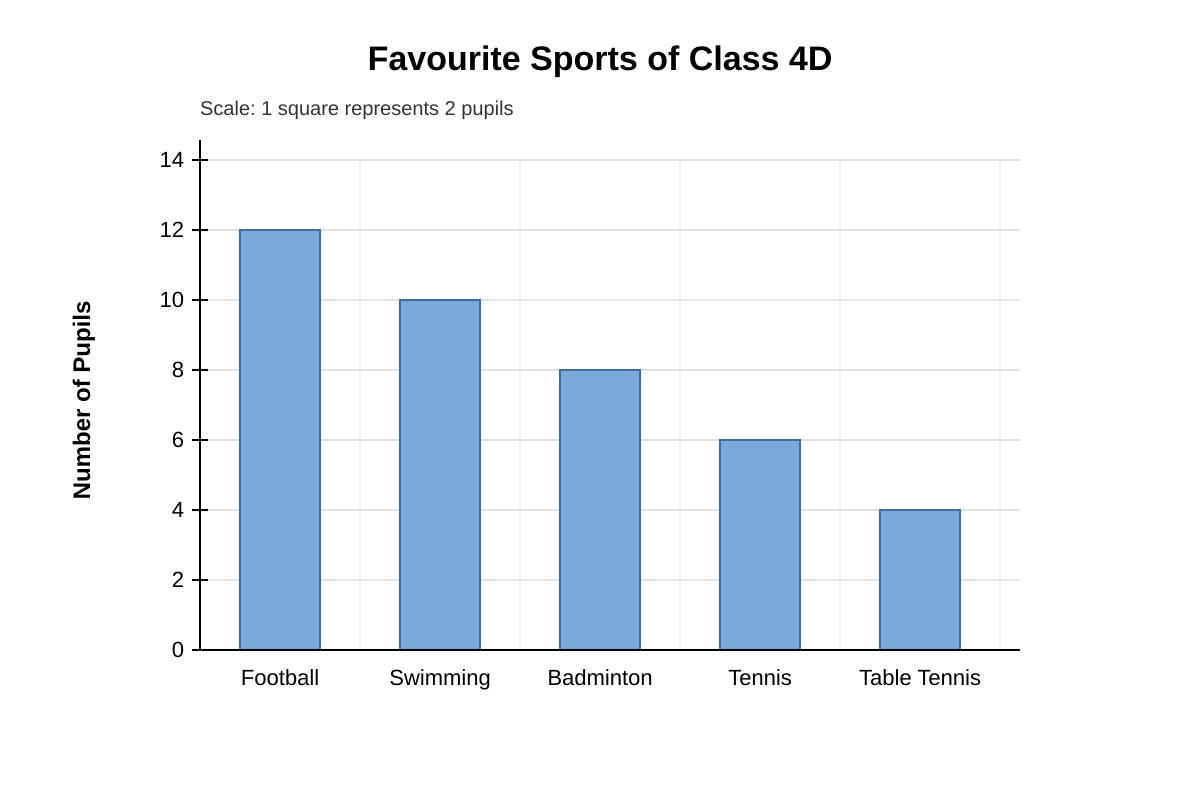
Generated graph for Q4.
(a) How many pupils chose badminton? (1 mark)
Answer: ______________________
(b) How many more pupils chose swimming than tennis? (1 mark)
Answer: ______________________
Question 5. (2 marks)
An ice-cream stall recorded the number of cones of each flavour sold at a fun fair. Some information is missing.
| Flavour | Number of Cones Sold |
|---|
| Vanilla | 26 |
| Chocolate | 34 |
| Strawberry | ? |
| Mint | 18 |
The stall sold 100 cones altogether. How many strawberry cones were sold?
Working space:
Answer: ______________________
Section B: Tables, Bar Graphs and Pie Charts (Questions 6-10, 12 marks)
Question 6. (2 marks)
In a bar graph showing the number of books read by pupils, 1 square represents 6 books.
(a) Ravi's bar is 7 squares tall. How many books did Ravi read? (1 mark)
Answer: ______________________
(b) Mei's bar is 4 squares tall. How many more books did Ravi read than Mei? (1 mark)
Answer: ______________________
Question 7. (3 marks)
The line graph shows the temperature in the school garden one morning.
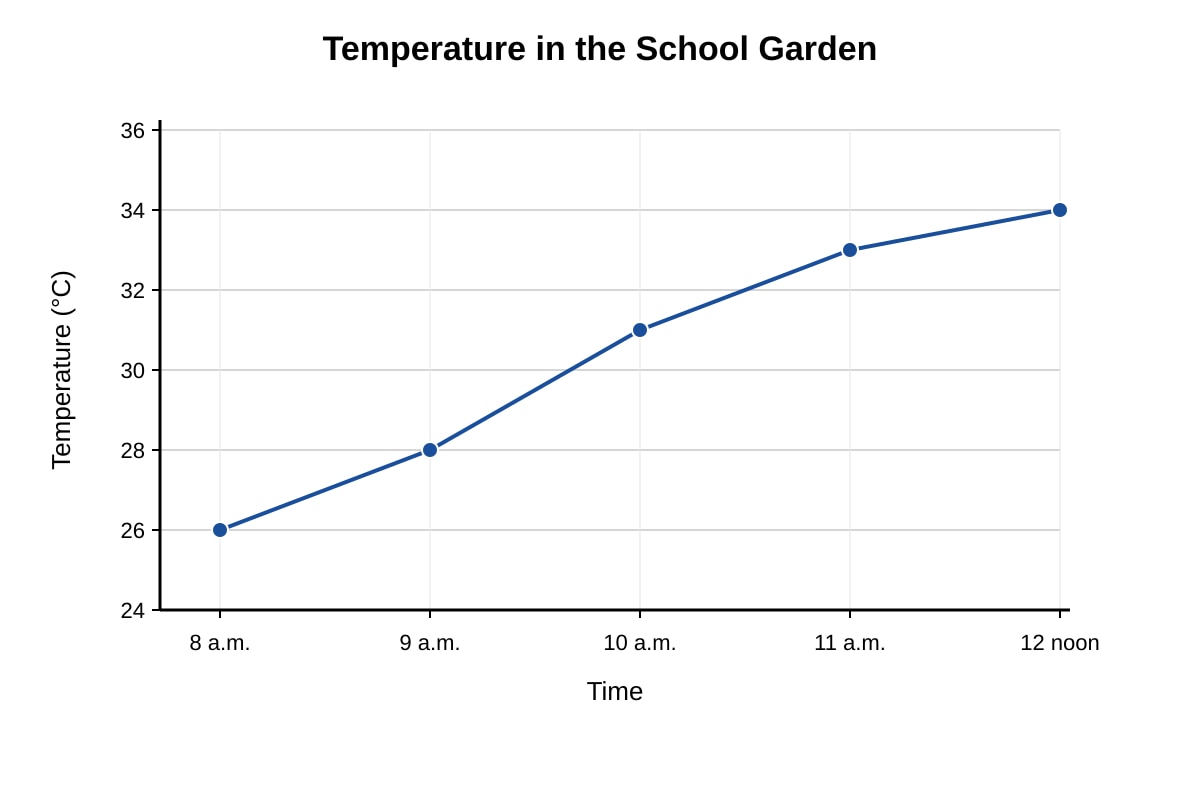
Generated graph for Q7.
(a) What was the temperature at 9 a.m.? (1 mark)
Answer: ______________________
(b) What was the highest temperature, and at what time was it recorded? (1 mark)
Answer: ______________________
(c) By how many degrees did the temperature rise from 8 a.m. to 12 noon? (1 mark)
Answer: ______________________
Question 8. (3 marks)
The table shows the money raised by a bake sale stall.
| Item | Money Raised |
|---|
| Cupcakes | $48 |
| Brownies | $35 |
| Cookies | $52 |
| Muffins | $27 |
(a) Find the total money raised by the stall. (2 marks)
Working space:
Answer: ______________________
(b) Which item raised the most money? (1 mark)
Answer: ______________________
Question 9. (2 marks)
The pie chart shows the favourite drinks of 20 pupils.
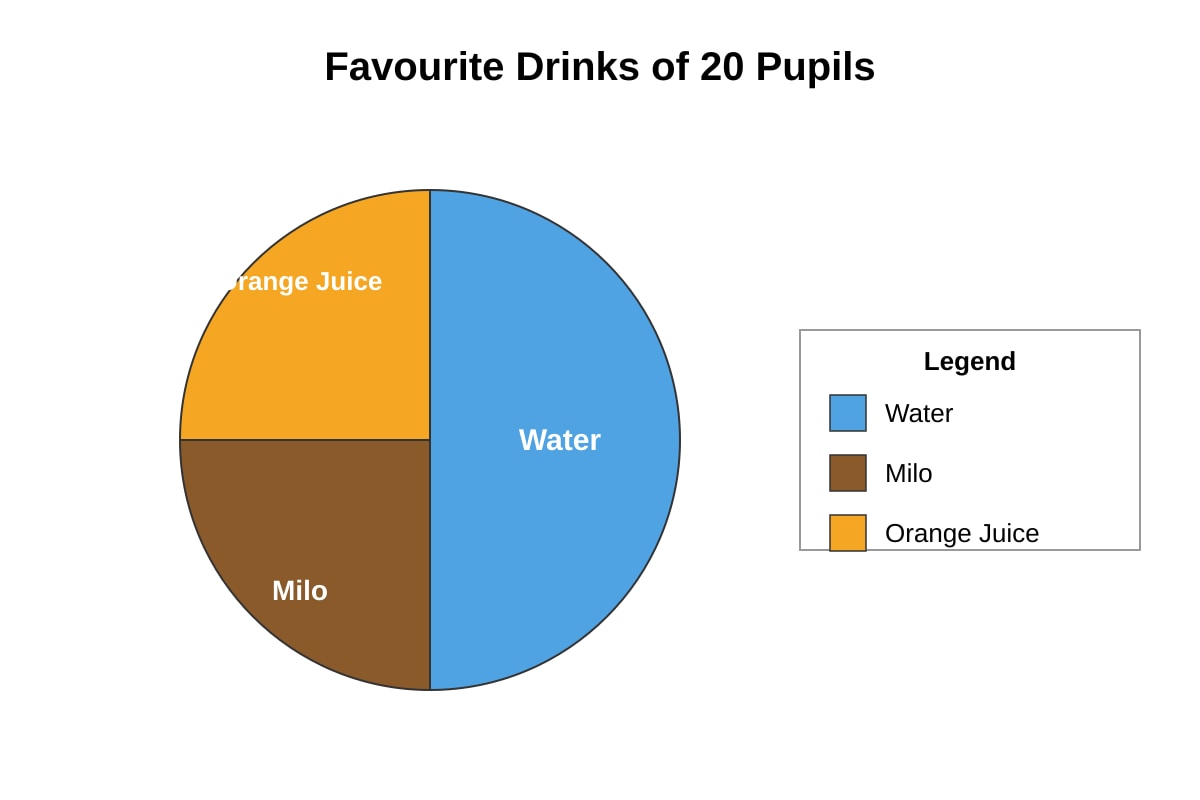
Generated chart for Q9.
(a) What fraction of the pupils chose water? (1 mark)
Answer: ______________________
(b) How many pupils chose Milo? (1 mark)
Answer: ______________________
Question 10. (2 marks)
The table shows the points scored by two teams in a quiz.
| Round | Red Team | Blue Team |
|---|
| Round 1 | 25 | 30 |
| Round 2 | 28 | 22 |
| Round 3 | 30 | 27 |
(a) Find each team's total score. (1 mark)
Answer: Red Team = ____________ Blue Team = ____________
(b) Which team won, and by how many points? (1 mark)
Answer: ______________________
Section C: Interpreting and Completing Data (Questions 11-15, 14 marks)
Question 11. (3 marks)
The line graph shows the daily rainfall recorded at a school weather station for one week.
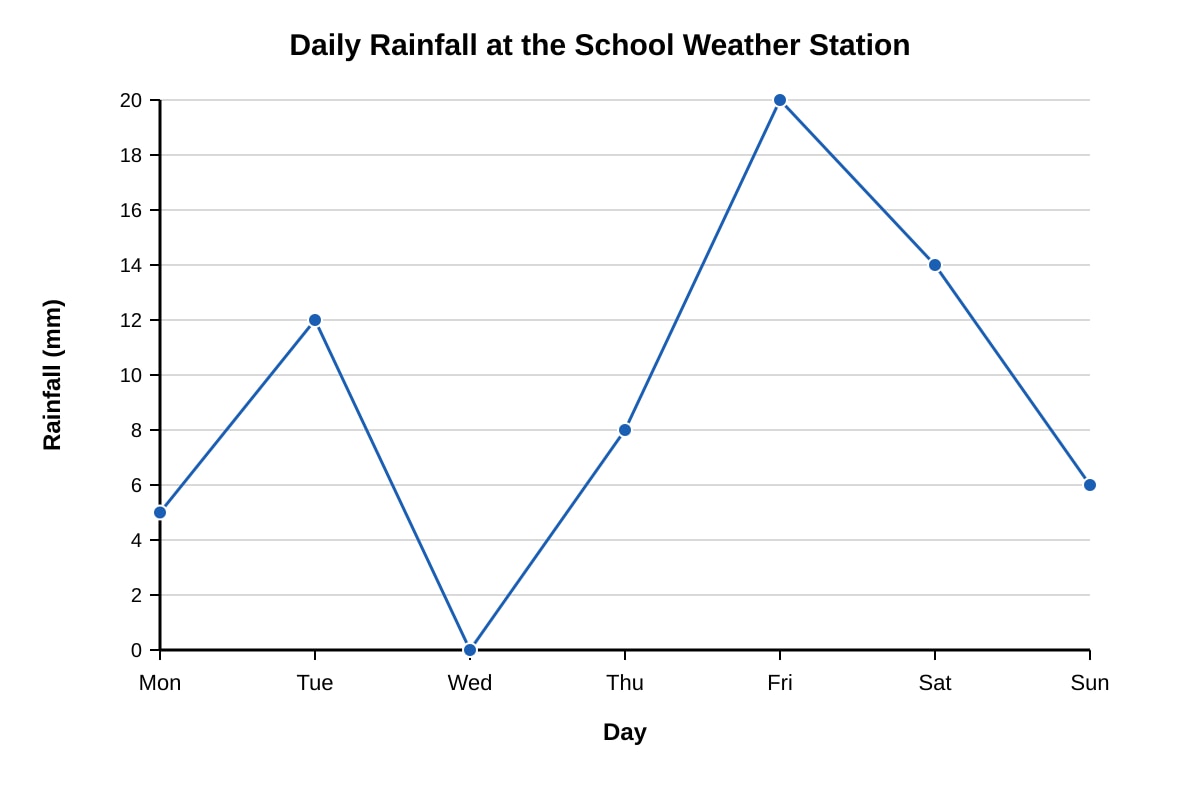
Generated graph for Q11.
(a) On which day was the rainfall the heaviest, and how much rain fell? (1 mark)
Answer: ______________________
(b) Find the total rainfall for Tuesday and Thursday. (1 mark)
Answer: ______________________
(c) On which day was there no rain at all? (1 mark)
Answer: ______________________
Question 12. (3 marks)
Four friends compared their marbles. Complete the table, then answer the questions.
| Pupil | Number of Marbles |
|---|
| Amir | 18 |
| Ben | ? |
| Cara | ? |
| Dinesh | ? |
- Ben has 5 fewer marbles than Amir.
- Cara has twice as many marbles as Ben.
- Dinesh has 4 more marbles than Ben.
Complete the table above with the missing numbers, then answer:
(a) How many marbles does Ben have? (1 mark)
Answer: ______________________
(b) How many marbles does Cara have? (1 mark)
Answer: ______________________
(c) How many marbles do the four friends have altogether? (1 mark)
Answer: ______________________
Question 13. (2 marks)
The tally chart shows the favourite fruits of some pupils.
| Fruit | Tally | Number |
|---|
| Apple | IIII IIII I | 9 |
| Banana | IIII II | ? |
| Grape | IIII III | 7 |
| Mango | IIII | 4 |
(a) How many pupils chose banana? (1 mark)
Answer: ______________________
(b) How many pupils were asked altogether? (1 mark)
Answer: ______________________
Question 14. (3 marks)
The sticker club recorded the number of stickers traded each month.
| Month | Stickers Traded |
|---|
| January | 45 |
| February | ? |
| March | 60 |
| April | 38 |
- In February, 12 fewer stickers were traded than in March.
(a) How many stickers were traded in February? (1 mark)
Answer: ______________________
(b) Find the total number of stickers traded in the four months. (2 marks)
Working space:
Answer: ______________________
Question 15. (3 marks)
The pie chart shows how 24 pupils travel home from school.
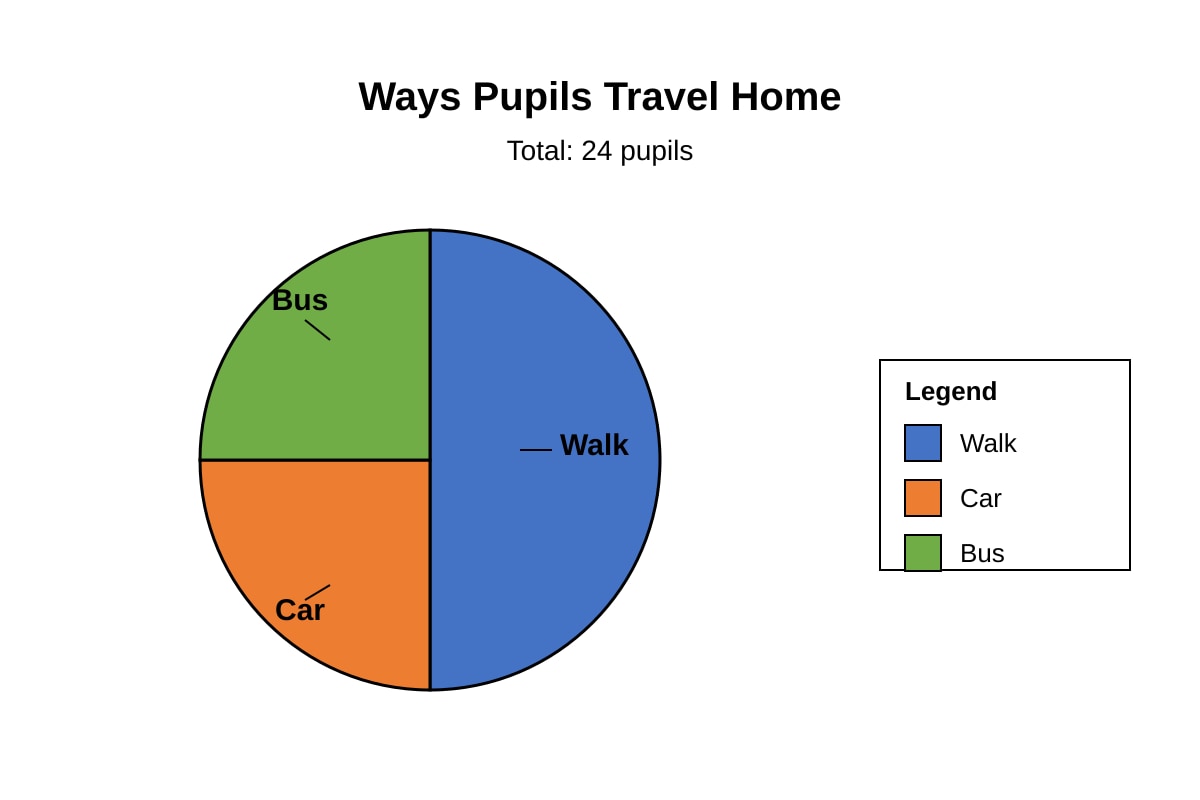
Generated chart for Q15.
(a) What fraction of the pupils walk home? (1 mark)
Answer: ______________________
(b) How many pupils travel home by car? (1 mark)
Answer: ______________________
(c) How many more pupils walk than travel by car? (1 mark)
Answer: ______________________
Section D: Graphs, Charts and Problem Solving (Questions 16-20, 16 marks)
Question 16. (3 marks)
The line graph shows the height of a sunflower measured at the end of each week.
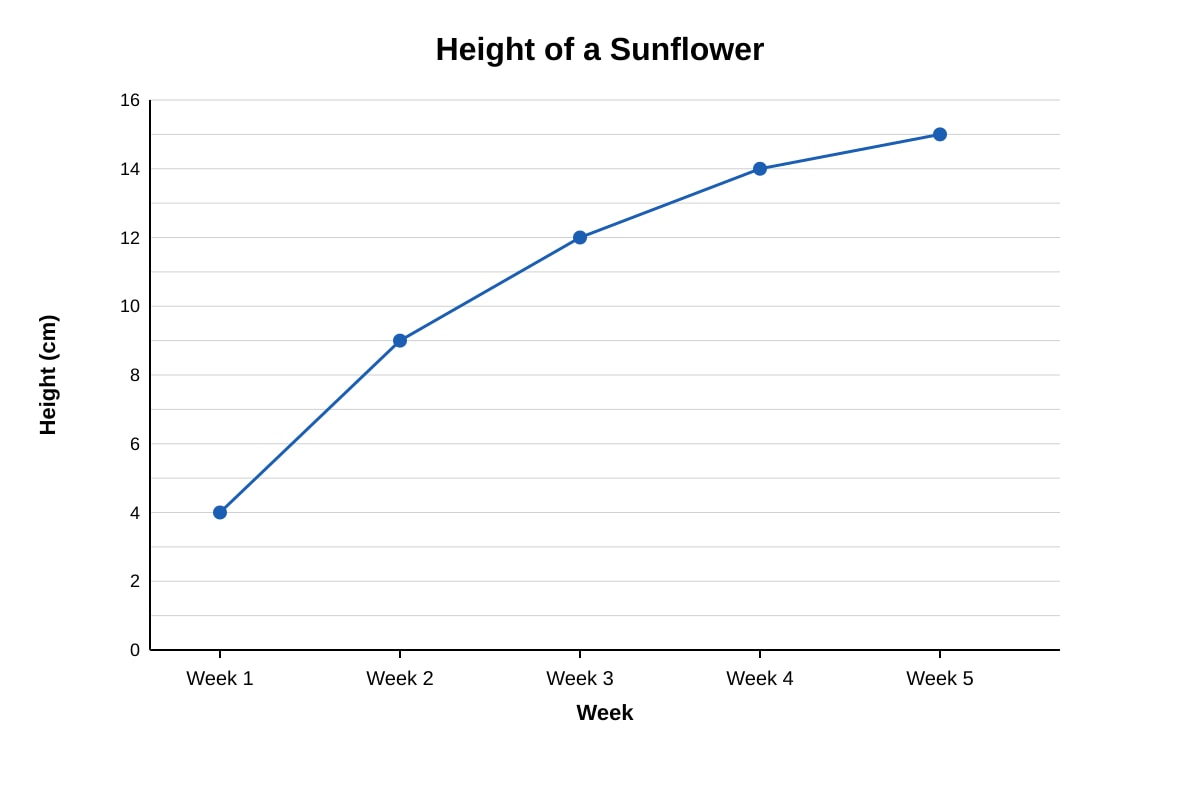
Generated graph for Q16.
(a) What was the height of the sunflower at the end of Week 3? (1 mark)
Answer: ______________________
(b) By how many centimetres did the sunflower grow from Week 3 to Week 5? (1 mark)
Answer: ______________________
(c) What is the difference between the sunflower's height in Week 1 and in Week 5? (1 mark)
Answer: ______________________
Question 17. (3 marks)
The table shows the number of minutes three classes spent reading in one week.
| Class | Minutes Read |
|---|
| Class 4A | 320 |
| Class 4B | 285 |
| Class 4C | 350 |
(a) Which class spent the longest time reading? (1 mark)
Answer: ______________________
(b) How many more minutes did Class 4C read than Class 4B? (1 mark)
Answer: ______________________
(c) Find the total minutes spent reading by all three classes. (1 mark)
Answer: ______________________
Question 18. (4 marks)
The bar graph shows the favourite fruits of the 36 pupils in Class 4E. One bar is missing.
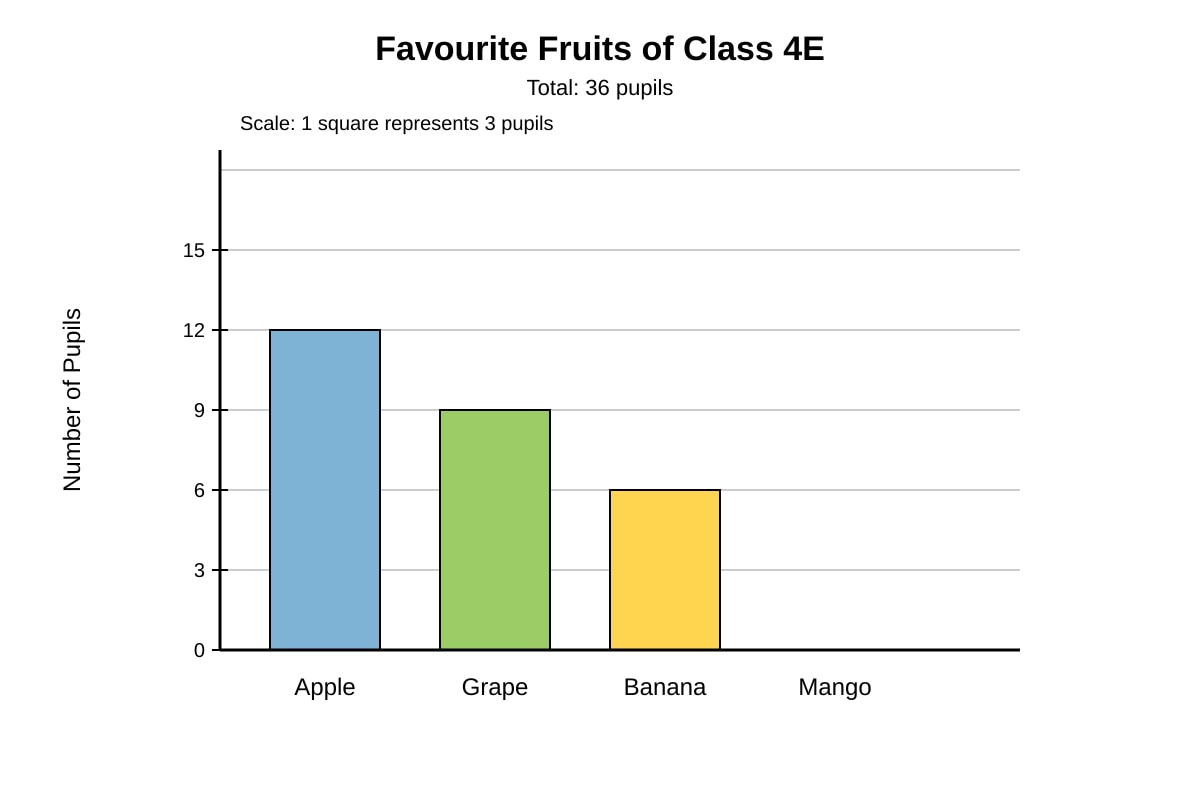
Generated graph for Q18.
(a) How many pupils chose apple? (1 mark)
Answer: ______________________
(b) The rest of the class chose mango. How many pupils chose mango? (2 marks)
Working space:
Answer: ______________________
(c) On the graph, how many squares tall should the mango bar be drawn? (1 mark)
Answer: ______________________
Question 19. (2 marks)
The table shows the favourite weekend activities of the 40 pupils in Class 4F.
| Activity | Number of Pupils |
|---|
| Reading | 14 |
| Cycling | 6 |
| Swimming | 11 |
| Board Games | 9 |
(a) What fraction of the pupils chose reading? Give your answer in its simplest form. (1 mark)
Answer: ______________________
(b) How many more pupils chose reading than cycling? (1 mark)
Answer: ______________________
Question 20. (4 marks)
A canteen stall recorded the number of sandwiches sold from Monday to Friday last week. One value is missing.
| Day | Sandwiches Sold |
|---|
| Monday | 55 |
| Tuesday | 40 |
| Wednesday | 65 |
| Thursday | ? |
| Friday | 50 |
The stall sold 280 sandwiches altogether during the five days.
(a) How many sandwiches were sold on Thursday? (2 marks)
Working space:
Answer: ______________________
(b) On which day were the most sandwiches sold? (1 mark)
Answer: ______________________
(c) How many more sandwiches were sold on Thursday than on Tuesday? (1 mark)
Answer: ______________________