From Real Exams Quiz
Primary 4 Mathematics Data Analysis Quiz
Free P4 Maths Data Analysis quiz, HY3 Exam version, with questions, answers, and syllabus-aligned practice for Singapore students.
These static practice materials are generated from the site's syllabus and paper-generation workflow, with source and model context shown so students and parents can evaluate the material before use.
Questions
Primary 4 Mathematics Quiz - Data Analysis
Name: ___________________________
Class: ___________
Date: ___________
Score: ___________ / 40
Duration: 50 minutes
Total Marks: 40
Instructions:
- Answer all 20 questions.
- Show your working clearly where required.
- Section A: 10 short-answer questions (1 mark each). Section B: 6 short-structured questions (2 marks each). Section C: 4 problem-solving questions (3 marks each).
- Use the tables, graphs, and charts provided to read and interpret data.
Section A (Questions 1–10, 1 mark each)
1. The table below shows the number of books read by 5 students in January.
| Student | Books |
|---|---|
| Ali | 4 |
| Bala | 7 |
| Chen | 5 |
| Devi | 7 |
| Esha | 2 |
What is the total number of books read by all 5 students?
2. Using the table in Question 1, who read the most books?
3. A bar graph shows the favourite fruits of Primary 4 students. The bar for "Apple" reaches 8, "Orange" reaches 5, "Pear" reaches 3. Which fruit is the least favourite?
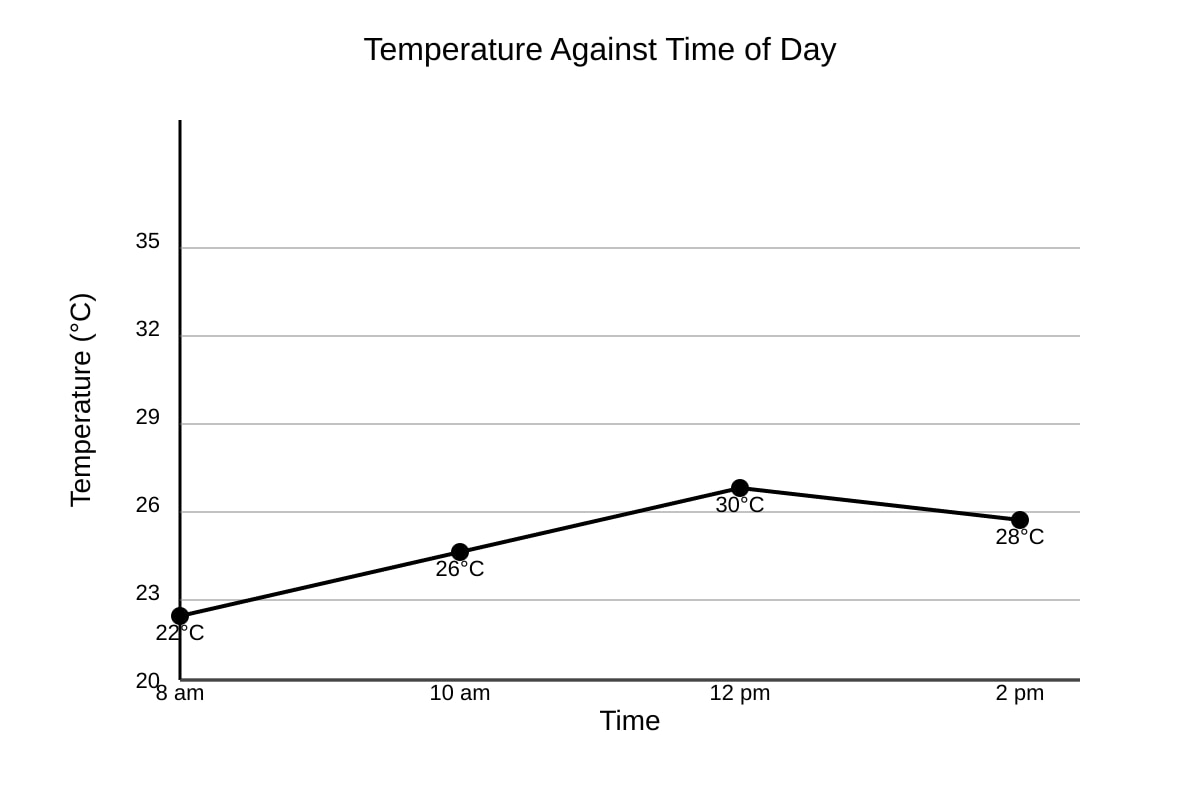
4. The line graph below shows the temperature (°C) at 8 am, 10 am, 12 pm, 2 pm.

Generated graph for Q4.
What was the temperature at 12 pm?
5. A class tally chart for transport to school is shown:
| Transport | Tally |
|---|---|
| Bus | |
| MRT | |
| Walk |
How many students walked to school?
6. The pie chart shows the fraction of a class that likes each sport: Football = 1/2, Swimming = 1/4, Others = 1/4. If the class has 24 students, how many like Football?
7. From the table in Question 1, what is the difference between the highest and lowest number of books read?
8. A table shows the number of pets: Dogs = 6, Cats = 9, Rabbits = 3. Which pet is most common?
9. The bar graph shows weekly savings: Week 1 = 2,Week2=5, Week 3 = 3,Week4=6. What is the total savings over the 4 weeks?
10. A line graph of water level in a tank shows: Mon = 10 L, Tue = 14 L, Wed = 9 L. On which day was the water level lowest?
Section B (Questions 11–16, 2 marks each)
11. The table shows the number of stickers collected by 4 children.
| Name | Stickers |
|---|---|
| Ravi | 12 |
| Siti | 18 |
| Tom | 9 |
| Uma | 15 |
(a) Who collected the median number of stickers? (1 mark)
(b) What is the total number of stickers collected? (1 mark)
(a) ___________________
(b) ___________________
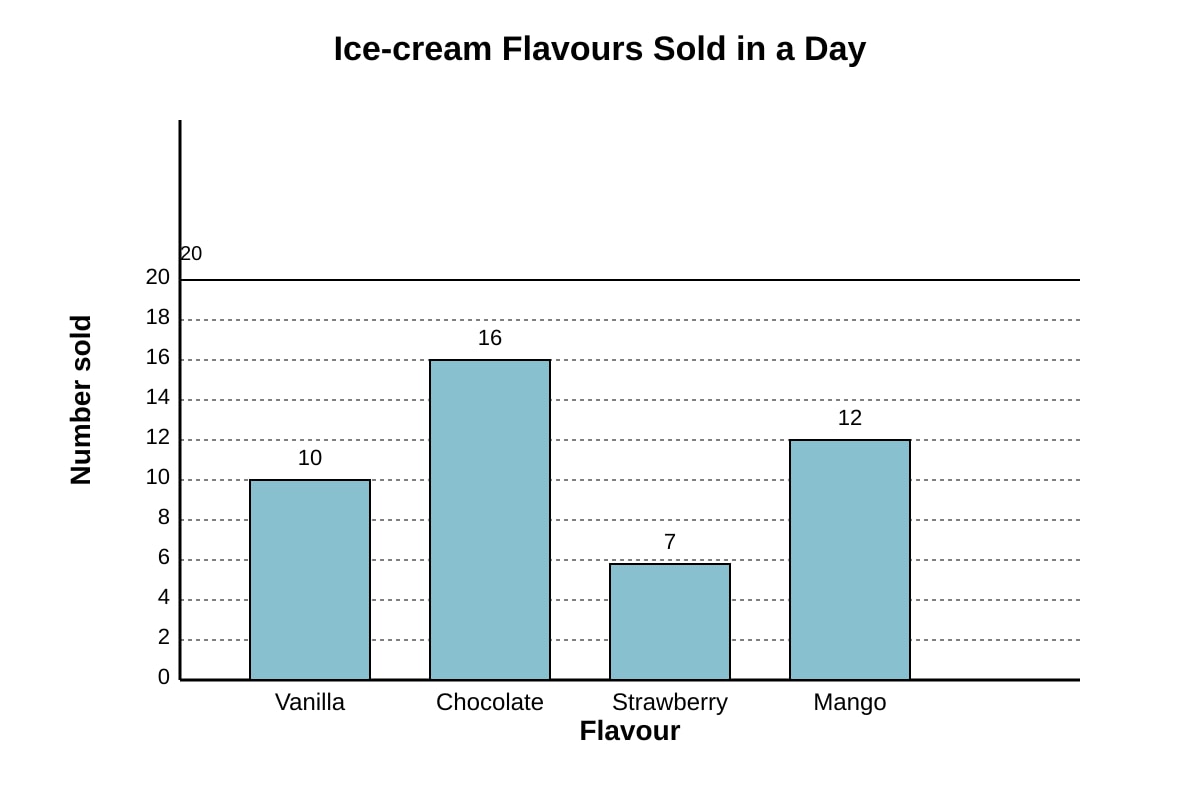
12. Read the bar graph from the placeholder below and answer.

Generated graph for Q12.
(a) Which flavour sold the most? (1 mark)
(b) How many more Chocolate than Strawberry were sold? (1 mark)
(a) ___________________
(b) ___________________
13. The pie chart represents 40 pupils' mode of transport. Bus = 1/2, Car = 1/4, Cycle = 1/4.
(a) How many pupils took the bus? (1 mark)
(b) How many pupils cycled? (1 mark)
(a) ___________________
(b) ___________________
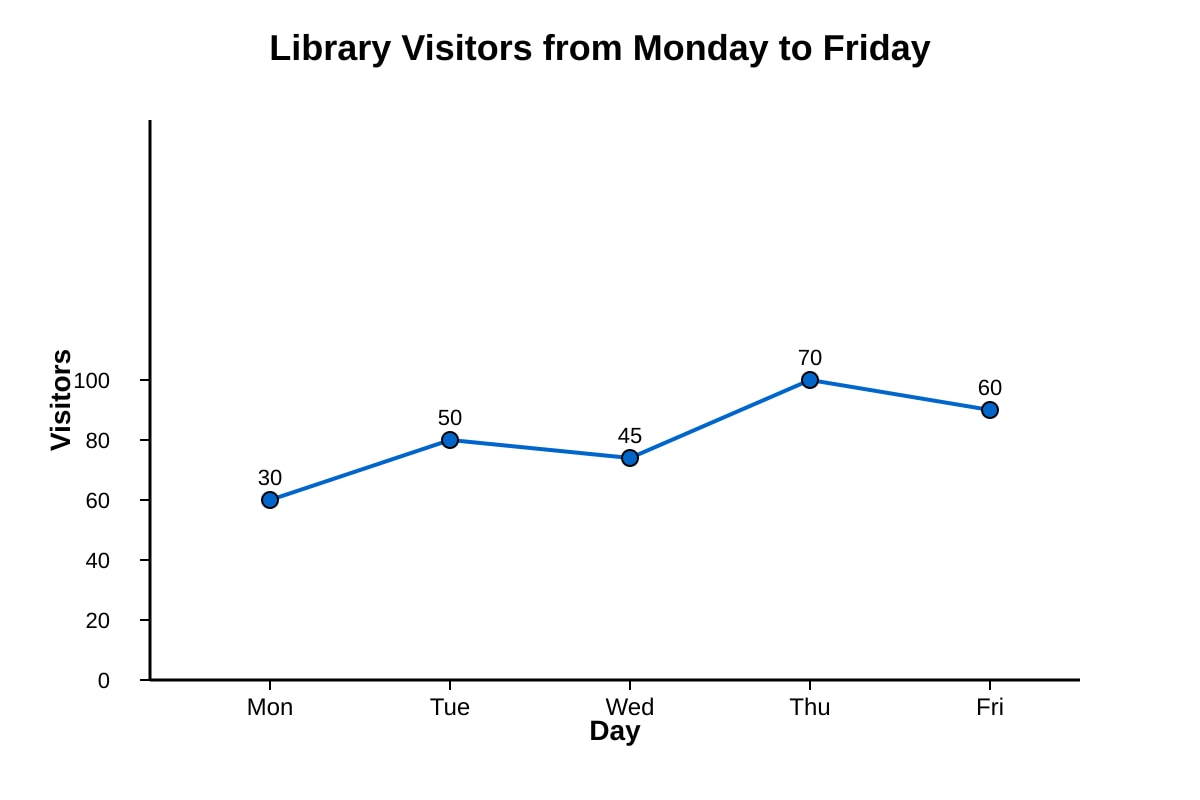
14. The line graph shows the number of visitors to a library from Monday to Friday.

Generated graph for Q14.
(a) On which day were there the most visitors? (1 mark)
(b) Find the total number of visitors from Monday to Wednesday. (1 mark)
(a) ___________________
(b) ___________________
15. A table shows test scores: Mary 85, John 72, Lim 90, Sara 68.
(a) Who scored the highest? (1 mark)
(b) What is the difference between the highest and lowest score? (1 mark)
(a) ___________________
(b) ___________________
16. The table shows the mass of 3 fruits in grams.
| Fruit | Mass (g) |
|---|---|
| Apple | 120 |
| Orange | 95 |
| Pear | 110 |
(a) Which fruit is the lightest? (1 mark)
(b) What is the total mass of all three fruits? (1 mark)
(a) ___________________
(b) ___________________
Section C (Questions 17–20, 3 marks each)
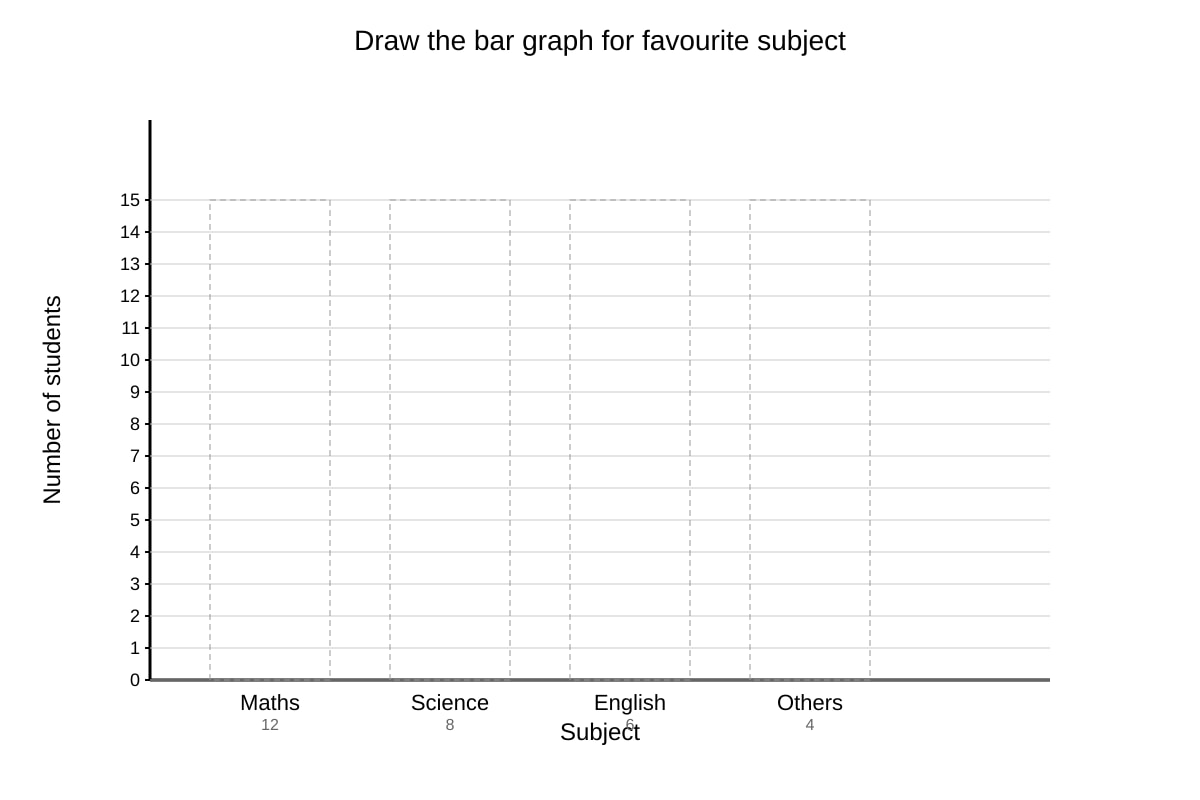
17. A class of 30 students was asked about their favourite subject. The results are: Maths 12, Science 8, English 6, Others 4.
(a) Draw a bar graph to show this data. (1 mark for correct axes/labels, 1 mark for correct bars)
(b) How many more students liked Maths than English? (1 mark)

Generated graph for Q17.
(b) ___________________
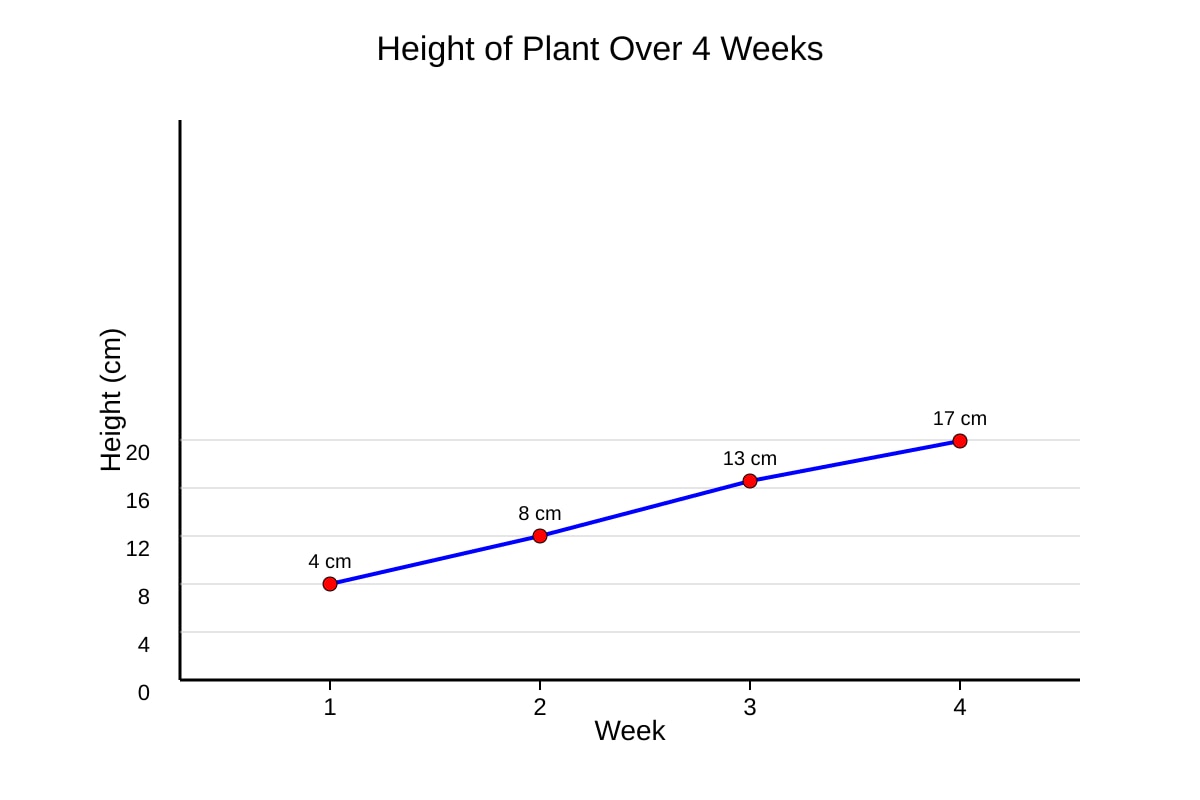
18. The line graph shows the height of a plant over 4 weeks.

Generated graph for Q18.
(a) How much did the plant grow from Week 1 to Week 4? (1 mark)
(b) In which week did it grow the most? (1 mark)
(c) What was the total growth in Week 2 and Week 3? (1 mark)
(a) ___________________
(b) ___________________
(c) ___________________
19. A pie chart shows the colours of 20 balls: Red 1/2, Blue 1/4, Green 1/4.
(a) How many red balls are there? (1 mark)
(b) How many more red than blue balls? (1 mark)
(c) If 4 green balls are removed, what fraction of the remaining balls are green? (1 mark)
(a) ___________________
(b) ___________________
(c) ___________________
20. The table shows the number of cans collected for recycling by 5 classes.
| Class | Cans |
|---|---|
| 4A | 25 |
| 4B | 32 |
| 4C | 18 |
| 4D | 27 |
| 4E | 23 |
(a) Which class collected the most cans? (1 mark)
(b) Find the total number of cans collected. (1 mark)
(c) What is the average number of cans collected per class? (1 mark)
(a) ___________________
(b) ___________________
(c) ___________________
Answers
Primary 4 Mathematics Quiz - Data Analysis (Answer Key)
Total Marks: 40
Topic: Data Analysis (tables, bar graphs, line graphs, pie charts)
Section A (Q1–10, 1 mark each)
Q1. 25 books
Working: 4 + 7 + 5 + 7 + 2 = 25.
Teaching note: To find total, add all values in the "Books" column. A common mistake is missing one row.
Q2. Bala and Devi
Working: Highest value in table = 7 (Bala and Devi).
Teaching note: "Most" means the largest number; here two students tie.
Q3. Pear
Working: Values: Apple 8, Orange 5, Pear 3. Smallest = 3 (Pear).
Teaching note: Least favourite = shortest bar = smallest number.
Q4. 30°C
Working: From graph, point at 12 pm is 30°C.
Teaching note: Read the y-value at the correct x-label.
Q5. 2 students
Working: Walk tally = || = 2.
Teaching note: Each | is 1 count.
Q6. 12 students
Working: 1/2 of 24 = 24 ÷ 2 = 12.
Teaching note: Pie chart fraction tells proportion; multiply fraction by total.
Q7. 5 books
Working: Highest 7, lowest 2, difference = 7 – 2 = 5.
Teaching note: Difference = highest minus lowest.
Q8. Cats
Working: Cats = 9 is largest among 6, 9, 3.
Teaching note: Most common = highest frequency.
Q9. $16
Working: 2 + 5 + 3 + 6 = 16.
Teaching note: Add all weekly amounts.
Q10. Wednesday
Working: Values: Mon 10, Tue 14, Wed 9. Lowest = 9 on Wed.
Teaching note: Lowest point on line graph.
Section B (Q11–16, 2 marks each)
Q11.
(a) Tom (1 mark)
Working: Order: 9 (Tom), 12 (Ravi), 15 (Uma), 18 (Siti). Median = middle value = 9 → Tom.
(b) 54 stickers (1 mark)
Working: 12 + 18 + 9 + 15 = 54.
Teaching note: Median is the middle number after sorting. Total is sum.
Q12.
(a) Chocolate (1 mark)
(b) 9 more (1 mark)
Working: Chocolate 16, Strawberry 7, 16 – 7 = 9.
Teaching note: Read bar heights from graph.
Q13.
(a) 20 pupils (1 mark)
Working: 1/2 of 40 = 20.
(b) 10 pupils (1 mark)
Working: 1/4 of 40 = 10.
Teaching note: Pie chart fractions of whole.
Q14.
(a) Thursday (1 mark)
(b) 125 visitors (1 mark)
Working: Mon 30 + Tue 50 + Wed 45 = 125.
Teaching note: Read values, then sum range.
Q15.
(a) Lim (1 mark)
(b) 22 (1 mark)
Working: Highest 90 (Lim), lowest 68 (Sara), 90 – 68 = 22.
Teaching note: Difference of extremes.
Q16.
(a) Orange (1 mark)
(b) 325 g (1 mark)
Working: 120 + 95 + 110 = 325.
Teaching note: Lightest = smallest mass.
Section C (Q17–20, 3 marks each)
Q17.
(a) Bar graph drawn with axes labelled Subject and Number of students, bars: Maths 12, Science 8, English 6, Others 4. (2 marks: 1 for labels/scale, 1 for correct bars)
(b) 6 more (1 mark)
Working: Maths 12 – English 6 = 6.
Teaching note: Scale should go to at least 12.
Q18.
(a) 13 cm (1 mark)
Working: Week4 17 – Week1 4 = 13.
(b) Week 3 (1 mark)
Working: W1→W2: 4, W2→W3: 5, W3→W4: 4. Most = 5 in Week3.
(c) 9 cm (1 mark)
Working: 8–4 = 4 (W2) + 13–8 = 5 (W3) = 9.
Teaching note: Growth = difference between weeks.
Q19.
(a) 10 red (1 mark)
Working: 1/2 of 20 = 10.
(b) 5 more (1 mark)
Working: Blue = 1/4×20 = 5; 10 – 5 = 5.
(c) 1/4 (1 mark)
Working: Green = 5; after remove 4, green left = 1; total left = 20–4 = 16; 1/16? Wait: green originally 5, remove 4 → 1 green left, total remaining = 16, fraction = 1/16.
Correction: fraction = 1/16.
Teaching note: Recalculate total after removal.
Q20.
(a) 4B (1 mark)
Working: Highest = 32 (4B).
(b) 125 cans (1 mark)
Working: 25+32+18+27+23 = 125.
(c) 25 cans (1 mark)
Working: 125 ÷ 5 = 25.
Teaching note: Average = total ÷ number of classes.
Marking notes: Deduct 0.5 for missing unit only if specified; for P4 data analysis, units often omitted in table. Accept clear working.
Free quiz and exam paper access
Enter your details to view this paper
Your access is remembered on this device.