From Real Exams Quiz
Primary 4 Mathematics Data Analysis Quiz
Free P4 Maths Data Analysis quiz, Exam version, with questions, answers, and syllabus-aligned practice for Singapore students.
These static practice materials are generated from the site's syllabus and paper-generation workflow, with source and model context shown so students and parents can evaluate the material before use.
Questions
Free quiz and exam paper access
Enter your details to view this paper
Your access is remembered on this device.
Answers
Answer Key: Primary 4 Mathematics Quiz - Data Analysis
Total Marks: 20
Section A: Reading Tables and Bar Graphs (Questions 1 to 5)
Each question carries 1 mark.
Question 1
- Answer: 52
- Marks: 1
- Explanation: The table shows that on Wednesday, the number of books borrowed is 52. This is a direct reading from the table. Look at the row for "Wednesday" and the column for "Number of Books Borrowed".
Question 2
- Answer: 60
- Marks: 1
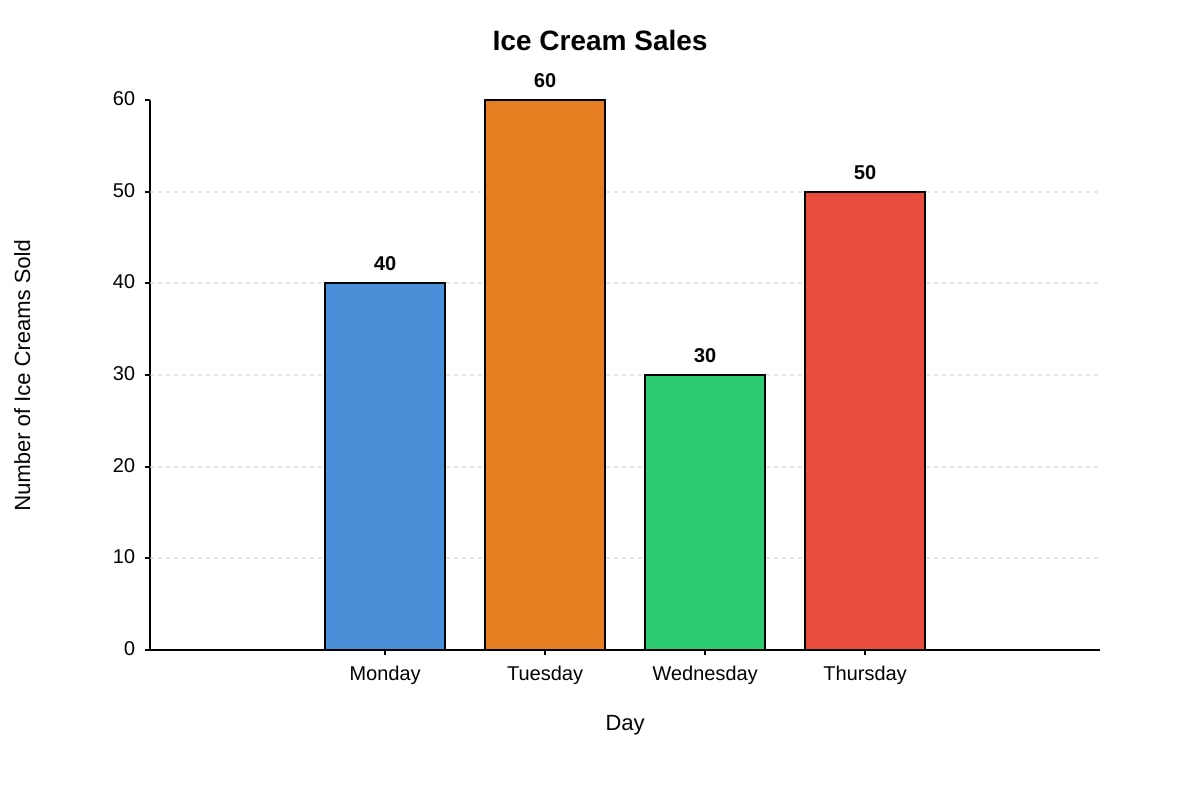
- Explanation: The bar for Tuesday is 6 units high. Each unit represents 10 ice creams. So, the number of ice creams sold on Tuesday is 6 × 10 = 60. This is a direct reading from the bar graph, but you must multiply by the scale.
Question 3
- Answer: 86
- Marks: 1
- Explanation: From the table in Question 1, Monday had 45 books and Thursday had 41 books. The total is 45 + 41 = 86. This requires adding two values from the table.
Question 4
- Answer: 25
- Marks: 1
- Explanation: The pictograph shows 5 apples for Wednesday. Each apple symbol represents 5 apples. So, the number of apples sold on Wednesday is 5 × 5 = 25. This is a direct reading from the pictograph, but you must multiply by the key.
Question 5
- Answer: 5
- Marks: 1
- Explanation: From the pictograph in Question 4, Monday has 4 apples (4 × 5 = 20 apples) and Tuesday has 3 apples (3 × 5 = 15 apples). The difference is 20 - 15 = 5. This requires comparing two values from the pictograph.
Section B: Interpreting Data and Line Graphs (Questions 6 to 10)
Each question carries 1 mark.
Question 6
- Answer: 28
- Marks: 1
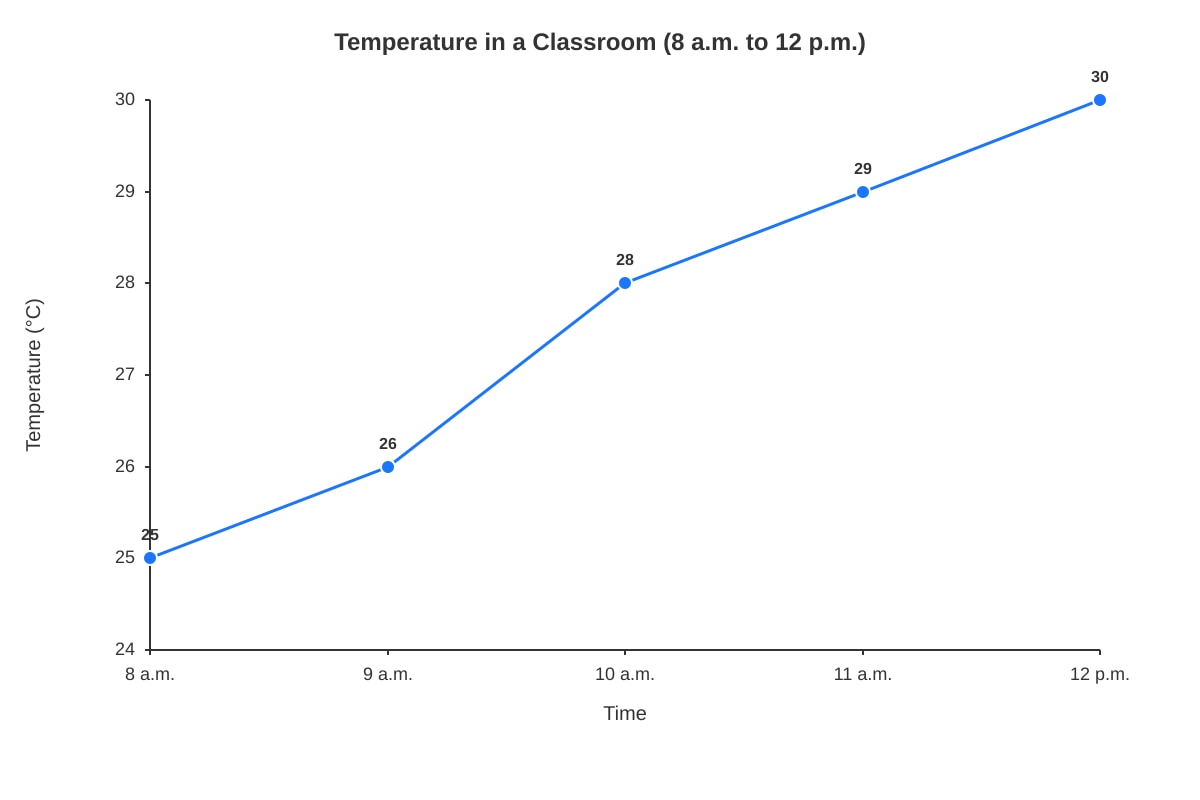
- Explanation: The line graph shows a point at 10 a.m. on the x-axis. The corresponding value on the y-axis (Temperature) is 28°C. This is a direct reading from the line graph.
Question 7
- Answer: Between 9 a.m. and 10 a.m.
- Marks: 1
- Explanation: Calculate the temperature increase between each pair of hours:
- 8 a.m. to 9 a.m.: 26 - 25 = 1°C
- 9 a.m. to 10 a.m.: 28 - 26 = 2°C
- 10 a.m. to 11 a.m.: 29 - 28 = 1°C
- 11 a.m. to 12 p.m.: 30 - 29 = 1°C The largest increase is 2°C, which occurred between 9 a.m. and 10 a.m.
Question 8
- Answer: 20
- Marks: 1
- Explanation: The number of students who chose Banana is 10. The number of students who chose Grape is 10. The total is 10 + 10 = 20. This requires adding two values from the table.
Question 9
- Answer: 3/10
- Marks: 1
- Explanation: The total number of students is 40. The number of students who chose Apple is 12. The fraction is 12/40. Simplify by dividing the numerator and denominator by 4: 12 ÷ 4 = 3, 40 ÷ 4 = 10. So, the fraction is 3/10.
Question 10
- Answer: Wednesday
- Marks: 1
- Explanation: Look down the "Number of Visitors" column in the table. The value 110 is in the row for Wednesday. This is a direct reading from the table.
Section C: Solving Problems with Data (Questions 11 to 15)
Each question carries 2 marks.
Question 11
- Answer: 90
- Marks: 2 (1 mark for correct method, 1 mark for correct answer)
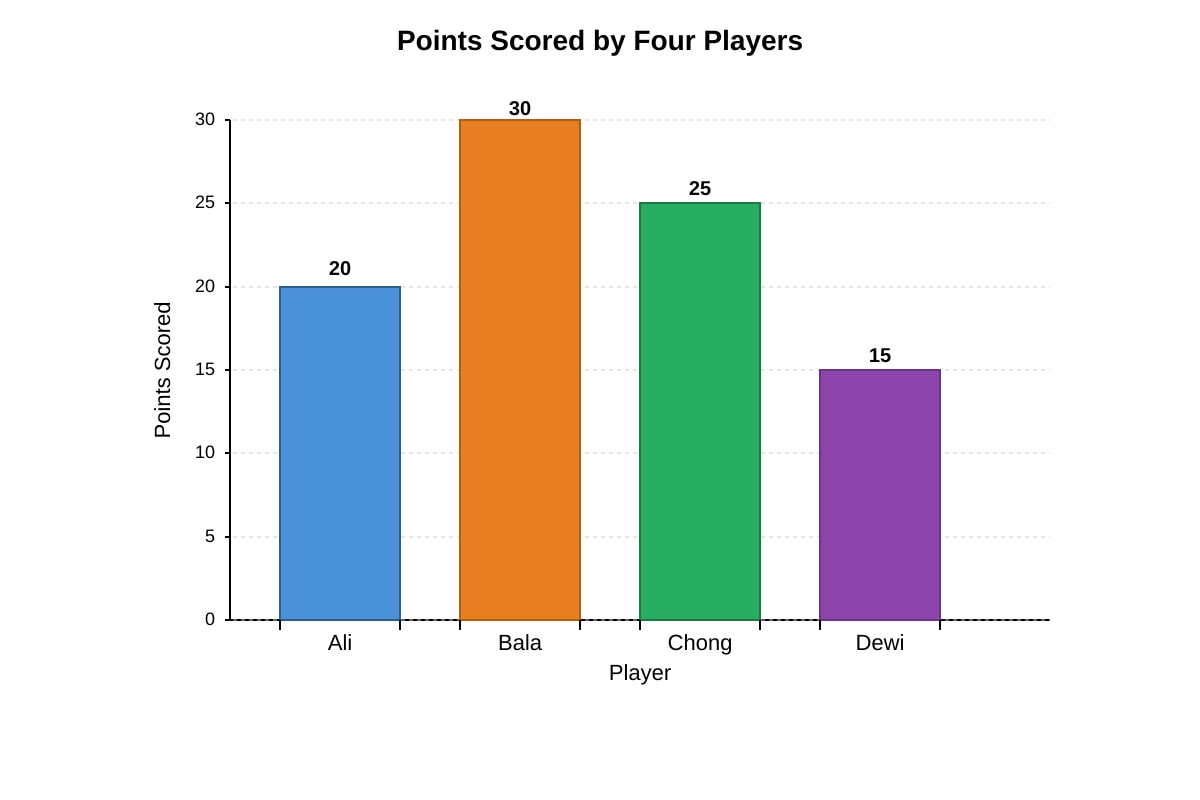
- Explanation: First, find the points for each player from the bar graph:
- Ali: 4 units × 5 points/unit = 20 points
- Bala: 6 units × 5 points/unit = 30 points
- Chong: 5 units × 5 points/unit = 25 points
- Dewi: 3 units × 5 points/unit = 15 points Total points = 20 + 30 + 25 + 15 = 90 points.
Question 12
- Answer: 15
- Marks: 2 (1 mark for correct method, 1 mark for correct answer)
- Explanation: "At least 1 pet" means 1 pet or more. So, we add the number of children who have 1, 2, or 3 pets. 8 + 4 + 3 = 15 children. Do not include the 5 children who have 0 pets.
Question 13
- Answer: 8
- Marks: 2 (1 mark for correct method, 1 mark for correct answer)
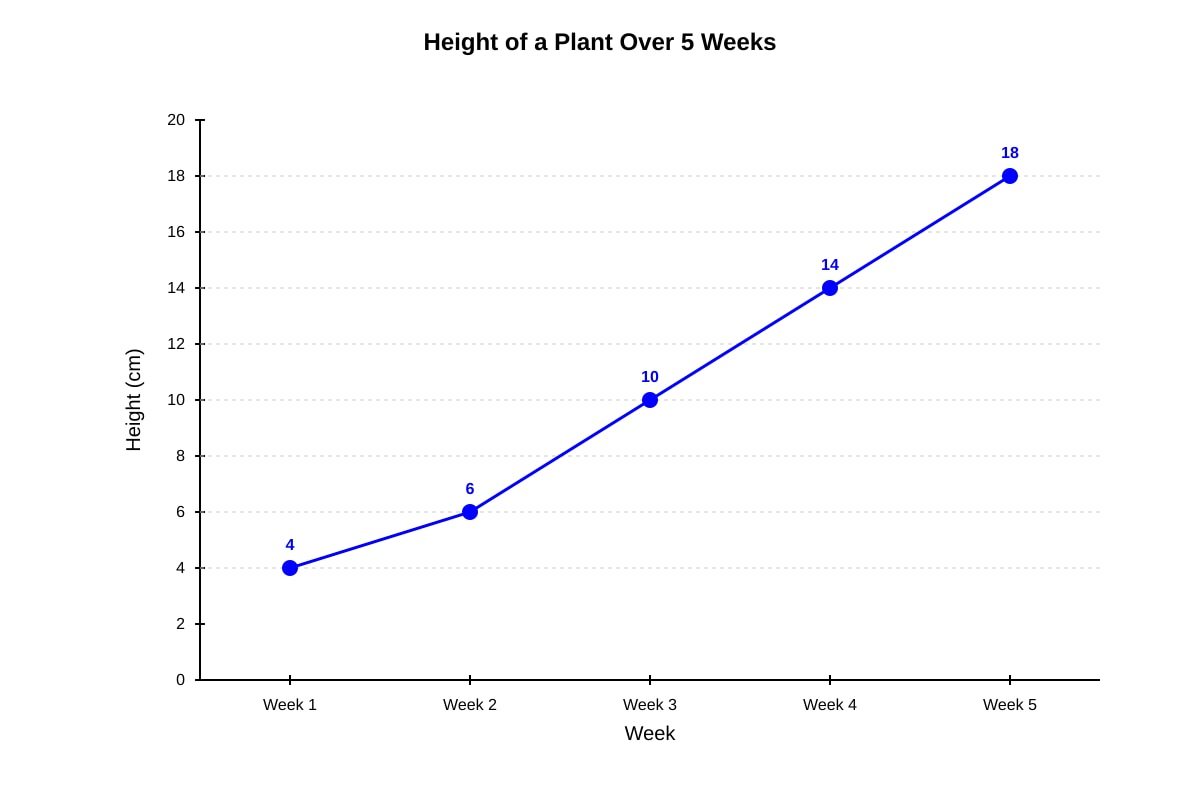
- Explanation: From the line graph, the height at Week 2 is 6 cm. The height at Week 4 is 14 cm. The growth is 14 - 6 = 8 cm.
Question 14
- Answer: 6
- Marks: 2 (1 mark for correct method, 1 mark for correct answer)
- Explanation: The number of people who chose Blue is 12. The number of people who chose Green is 6. The difference is 12 - 6 = 6.
Question 15
- Answer: 30
- Marks: 2 (1 mark for correct method, 1 mark for correct answer)
- Explanation: At 11 a.m., there were 50 cars. At 9 a.m., there were 20 cars. The difference is 50 - 20 = 30 cars.
Section D: More Problem Solving with Data (Questions 16 to 20)
Each question carries 2 marks.
Question 16
- Answer: 6
- Marks: 2 (1 mark for correct method, 1 mark for correct answer)
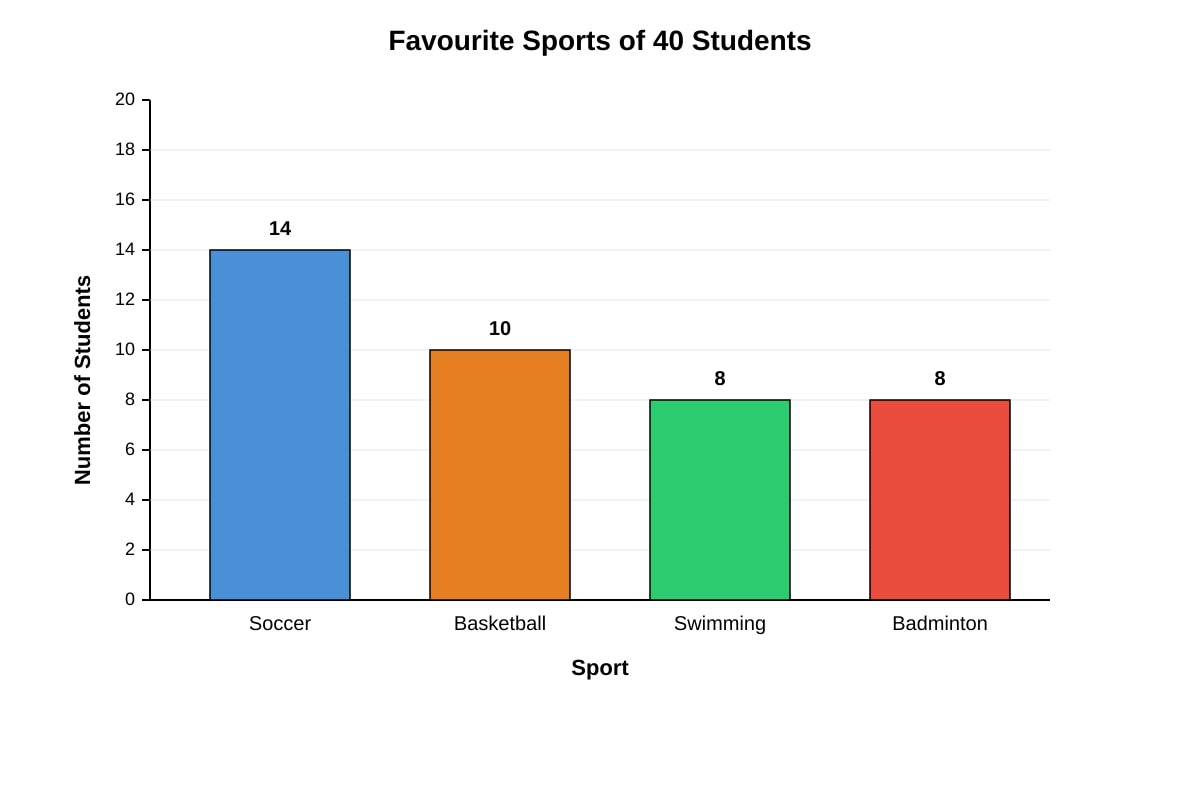
- Explanation: From the bar graph:
- Soccer: 7 units × 2 students/unit = 14 students
- Swimming: 4 units × 2 students/unit = 8 students Difference = 14 - 8 = 6 students.
Question 17
- Answer: 210
- Marks: 2 (1 mark for correct method, 1 mark for correct answer)
- Explanation: Total cans = 55 + 40 + 65 + 50 = 210 cans.
Question 18
- Answer: 80
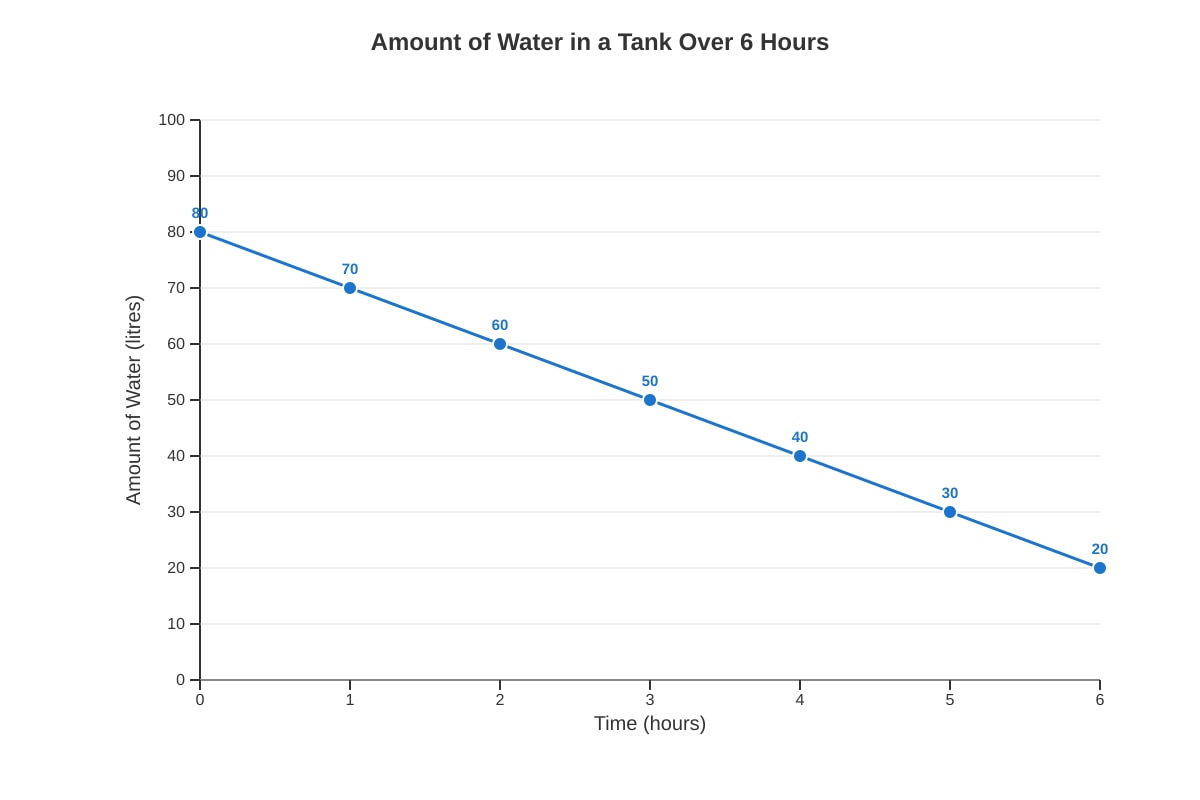
- Marks: 2 (1 mark for correct method, 1 mark for correct answer)
- Explanation: The line graph shows a point at 0 hours on the x-axis. The corresponding value on the y-axis (Amount of Water) is 80 litres.
Question 19
- Answer: 8
- Marks: 2 (1 mark for correct method, 1 mark for correct answer)
- Explanation: The number of students who travel by bus is 15. The number of students who travel by bicycle is 7. The difference is 15 - 7 = 8.
Question 20
- Answer: 12
- Marks: 2 (1 mark for correct method, 1 mark for correct answer)
- Explanation: The pictograph shows 6 books for Clara. Each book symbol represents 2 books. So, the number of books Clara read is 6 × 2 = 12.
End of Answer Key