From Real Exams Quiz
Primary 4 Mathematics Data Analysis Quiz
Free P4 Maths Data Analysis quiz, Exam version, with questions, answers, and syllabus-aligned practice for Singapore students.
These static practice materials are generated from the site's syllabus and paper-generation workflow, with source and model context shown so students and parents can evaluate the material before use.
Questions
Free quiz and exam paper access
Enter your details to view this paper
Your access is remembered on this device.
Answers
Primary 4 Mathematics Quiz - Data Analysis (Answer Key)
Total Marks: 30
Section A: Multiple-Choice Questions (10 marks)
Question 1 (2 marks)
- Answer: (3) Clara
- Explanation: The word problem requires reading data from a table. Clara read 12 books, which is the highest number in the "Number of Books" column. By comparing the values (8, 5, 12, 6, 9), we find 12 is the largest.
- Teaching Note: When reading a table, always look at the column headers first. Here, the column "Number of Books" tells us what the numbers mean. Then, find the largest number and look to the left (the "Student" column) to find who it belongs to.
- Common Mistake: Students might misread the table and pick a different student, or incorrectly compare the numbers without scanning all rows.
Question 2 (2 marks)
- Answer: (4) 16
- Explanation: The bar is 8 cm tall. Each cm represents 2 students. So, 8 cm × 2 students/cm = 16 students.
- Working: 8 × 2 = 16
- Teaching Note: A bar graph uses the height (or length) of a bar to represent data. The scale tells you how much each unit of height is worth. Multiply the height (in the unit used on the axis) by the scale factor.
- Common Mistake: Students might multiply 8 × 2 and get 16, but then pick option (2) 8 because they only look at the height of the bar in cm, forgetting to multiply by the scale.
Question 3 (2 marks)
- Answer: (2) 10
- Explanation: Each 🍦 represents 5 ice-creams. Wednesday: 5 ice-creams. Wednesday has 5 symbols. 5 × 5 = 25 ice-creams. Tuesday: 3 symbols. 3 × 5 = 15 ice-creams. Difference: 25 - 15 = 10.
- Working: Wednesday = 5 × 5 = 25. Tuesday = 3 × 5 = 15. Difference = 25 - 15 = 10.
- Teaching Note: In a pictograph, first check the key that tells you what each picture means. Then multiply the number of pictures by the value per picture. Finally, read the question carefully: "how many more" means you need to find the difference (subtraction).
- Common Mistake: Students might just count the symbols and subtract: 5 - 3 = 2. They forget to multiply by the value of each symbol.
Question 4 (2 marks)
- Answer: (2)
- Explanation: Total children = 12 + 8 + 6 + 4 = 30 Children who chose Red = 12 Fraction = 12/30 = 2/5 (simplified)
- Working: Total = 12 + 8 + 6 + 4 = 30. Fraction = 12/30. Simplify by dividing numerator and denominator by 6: 12÷6 / 30÷6 = 2/5.
- Teaching Note: A fraction compares a part to a whole. First find the total (the whole). Then the part is the number for that specific item. Write the fraction and simplify.
- Common Mistake: Students might forget to find the total and just use 12/4 (the number of colours) or misread the table.
Question 5 (2 marks)
- Answer: (3) 28°C
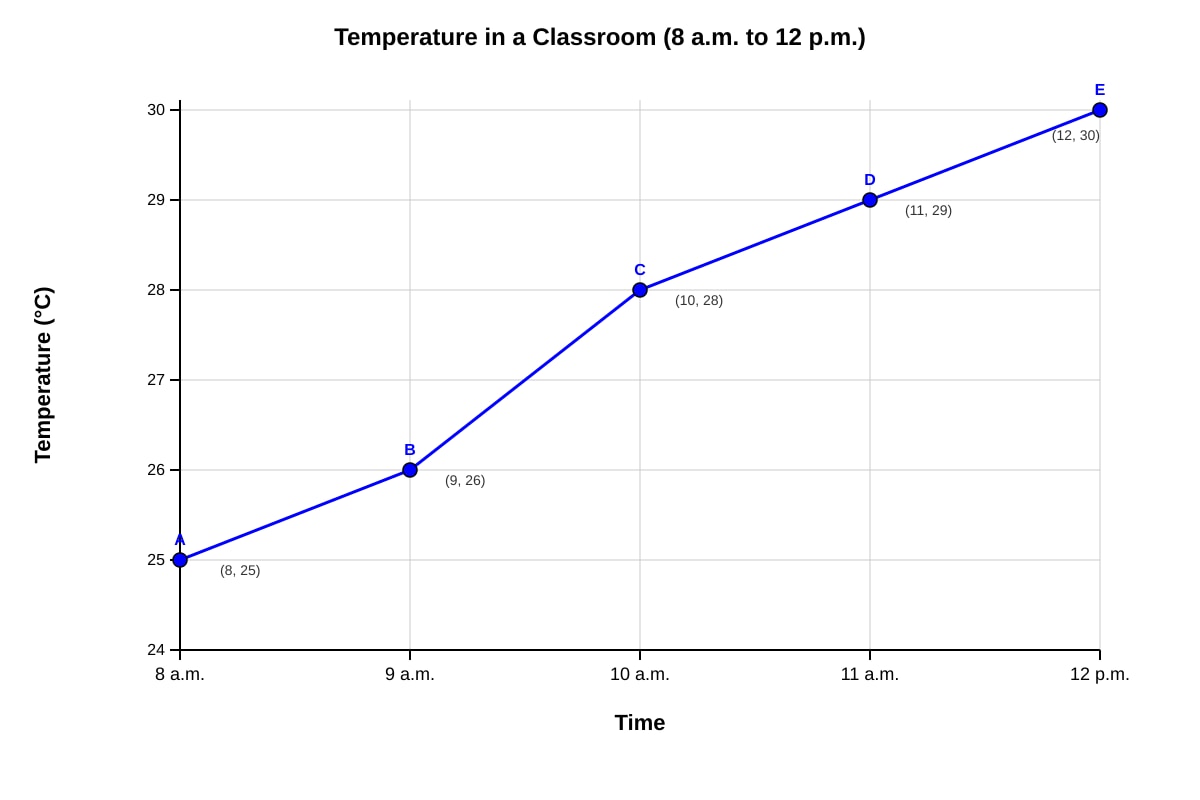
- Explanation: The line graph has "Time" on the horizontal axis and "Temperature (°C)" on the vertical axis. To find the temperature at 10 a.m., find "10 a.m." on the time axis, go straight up to the line graph, then read across to the temperature axis. The point at 10 a.m. is at 28°C.
- Teaching Note: This question tests the ability to read values from a line graph. Always check which axis has the information you know (the independent variable, time) and which axis has the information you want to find (the dependent variable, temperature). Trace up/down and left/right carefully.
- Common Mistake: Students might misread the axis, confusing 10 a.m. with 28°C or picking the temperature for a different hour.
Section B: Short-Answer Questions (10 marks)
Question 6 (1 mark)
- Answer: 22
- Explanation: Thursday: 50 visitors. Wednesday: 28 visitors. Difference: 50 - 28 = 22.
- Working: 50 - 28 = 22
- Common Mistake: Students might subtract in the wrong order (28 - 50) or add instead of subtract.
Question 7 (1 mark)
- Answer: 10
- Explanation: Bar height = 5 cm. Each cm = 2 balloons. Total = 5 × 2 = 10.
- Working: 5 × 2 = 10
- Common Mistake: Students might just write 5.
Question 8 (1 mark)
- Answer: 70
- Explanation: Monday: 4 symbols × 5 = 20 Tuesday: 3 symbols × 5 = 15 Wednesday: 5 symbols × 5 = 25 Thursday: 2 symbols × 5 = 10 Total = 20 + 15 + 25 + 10 = 70
- Working: (4+3+5+2) × 5 = 14 × 5 = 70
- Common Mistake: Students might forget to multiply by 5 for each day.
Question 9 (1 mark)
- Answer: 2
- Explanation: Total children = 20. Children who chose Cat, Dog, Rabbit = 8 + 6 + 4 = 18. Children who chose Hamster = 20 - 18 = 2.
- Working: 20 - (8+6+4) = 20 - 18 = 2
- Common Mistake: Students might forget to add all the other groups before subtracting from the total.
Question 10 (1 mark)
- Answer: 9 a.m. to 10 a.m.
- Explanation: 8 a.m. to 9 a.m.: 26 - 25 = 1°C increase 9 a.m. to 10 a.m.: 28 - 26 = 2°C increase 10 a.m. to 11 a.m.: 29 - 28 = 1°C increase 11 a.m. to 12 p.m.: 30 - 29 = 1°C increase The largest increase (2°C) was from 9 a.m. to 10 a.m.
- Working: Calculate the difference in temperature between each consecutive hour. The largest difference is 2°C.
- Common Mistake: Students might not calculate all intervals and just guess, or they might read the graph incorrectly and pick a wrong interval.
Question 11 (1 mark)
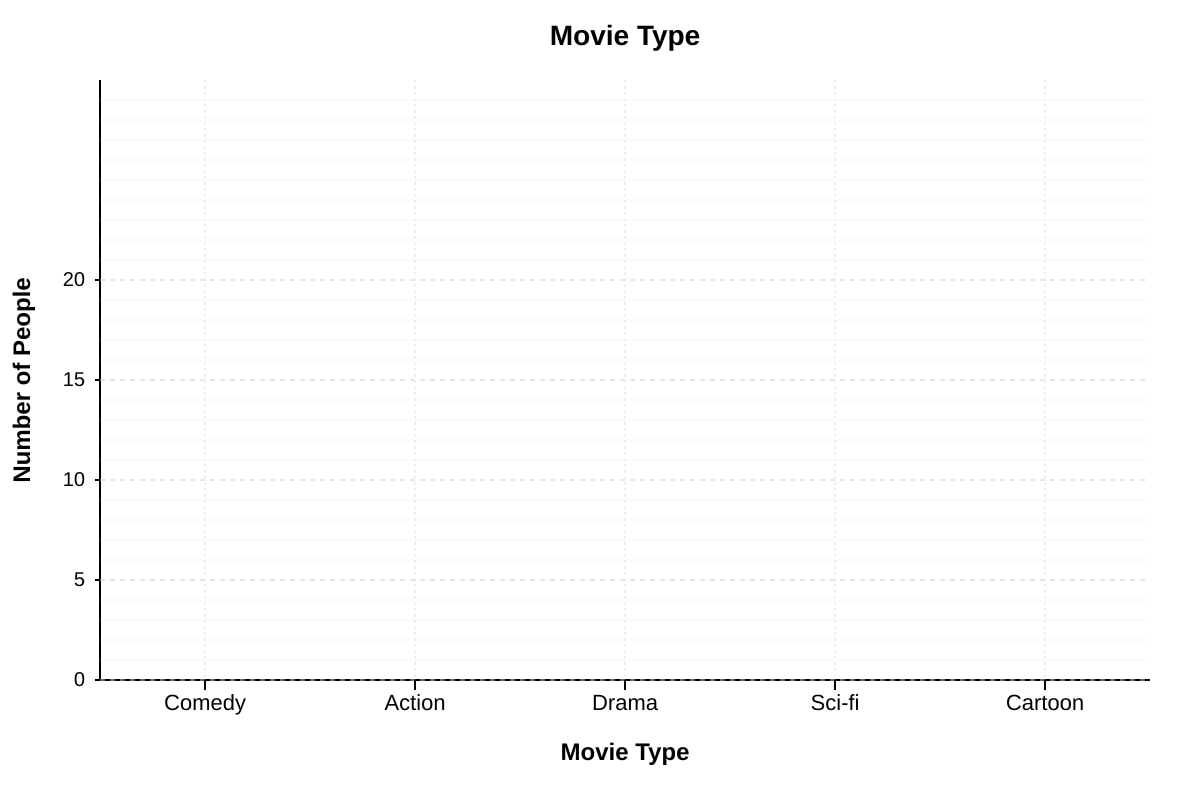
- Answer: (Student draws a correct bar chart. Bar heights: Comedy = 15, Action = 12, Drama = 10, Sci-fi = 8, Cartoon = 5. All bars should be drawn to the correct heights on the grid.)
- Explanation: The mark is for drawing the bars to the correct heights. The scale is given on the y-axis (0 to 20 in increments of 5). Students must draw five bars, one for each movie type, with heights matching the data in the table.
- Marking Note: Award 1 mark for all 5 bars drawn to the correct approximate heights. Partially correct answers may be awarded 0 marks.
Question 12 (1 mark)
- Answer: Mia
- Explanation: The data is: Sam=15, Lily=22, Tom=18, Mia=12. The smallest number is 12, which belongs to Mia.
- Common Mistake: Students might not compare all four numbers carefully.
Question 13 (1 mark)
- Answer: 8
- Explanation: The scores are: 8, 7, 10, 6, 9, 8, 7, 10, 5, 8. Count how many times each score appears: 8 appears 3 times. 7 appears 2 times. 10 appears 2 times. 6 appears 1 time. 9 appears 1 time. 5 appears 1 time. The score 8 appears most often.
- Common Mistake: Students might mistake "most common" for "highest value". Also, careful counting is needed.
Question 14 (1 mark)
- Answer: Soccer
- Explanation: The votes are: Soccer=10, Basketball=6, Badminton=4. The largest number of votes is 10, for Soccer.
- Common Mistake: Students might misread the game names or the vote counts.
Question 15 (1 mark)
- Answer: 27
- Explanation: Comedy = 15 people. Action = 12 people. People who chose Comedy or Action = 15 + 12 = 27.
- Working: 15 + 12 = 27
- Common Mistake: Students might only count one category, or add all categories together.
Section C: Problem-Solving Questions (10 marks)
Question 16 (2 marks)
- Answers: (a) 15, (b) 120
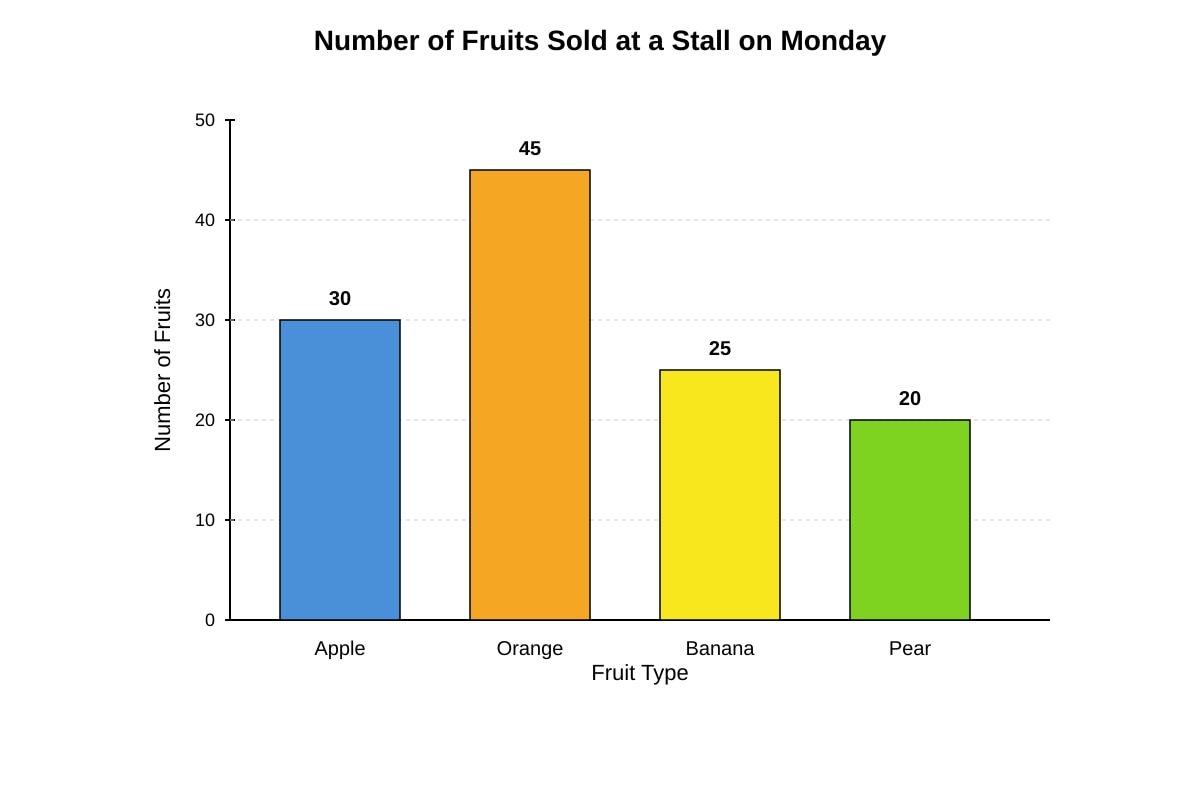
- Explanation: (a) Oranges = 45, Apples = 30. Difference = 45 - 30 = 15. (b) Total = Apples + Oranges + Bananas + Pears = 30 + 45 + 25 + 20 = 120.
- Working: (a) 45 - 30 = 15 (b) 30 + 45 + 25 + 20 = 120
- Marking: (a) 1 mark for correct answer. (b) 1 mark for correct answer.
- Common Mistake: Students might misread the bar heights from the graph.
Question 17 (2 marks)
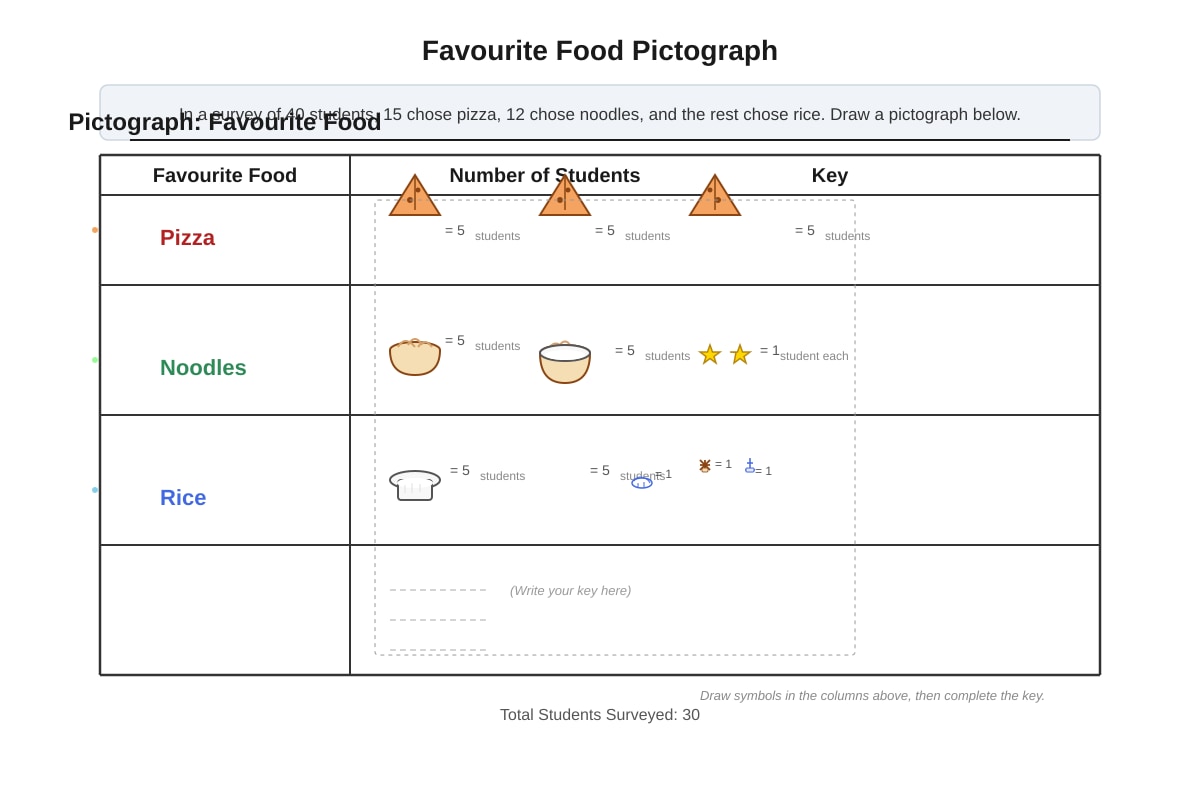
- Answer: (Student draws a pictograph. Possible key: 🍕 = 5 students. Pizza = 3 symbols, Noodles = 2 symbols + 2/5 of a symbol (or 12/5 = 2.4, so they might use a different key like 1 symbol = 2 students, then Pizza = 7.5 symbols which is tricky. A better key: 1 symbol = 1 student? Then too many symbols. Key 1 symbol = 5 students: Pizza 15/5=3 symbols. Noodles 12/5=2.4 symbols. Rice: 40-15-12=13, so 13/5=2.6 symbols. Partial symbols are allowed in P4. Key 1 symbol = 2 students: Pizza 15/2=7.5, Noodles 12/2=6, Rice 13/2=6.5. Key 1 symbol = 10 students: Pizza 1.5, Noodles 1.2, Rice 1.3. Any consistent and correctly drawn pictograph with 3 rows and proper key is acceptable.)
- Explanation: Total students = 40. Pizza = 15. Noodles = 12. Rice = 40 - 15 - 12 = 13. The student chooses a key and draws the correct number of symbols.
- Marking: 1 mark for correct calculations of Rice and correct number of students for each food. 1 mark for a correctly drawn pictograph with a key, all three rows labelled and drawn.
- Common Mistake: Students might not find the number of students who chose rice (could incorrectly calculate as 40-15-12=13, a common simple subtraction). They might choose a key that doesn't divide evenly and not show partial symbols correctly.
Question 18 (2 marks)
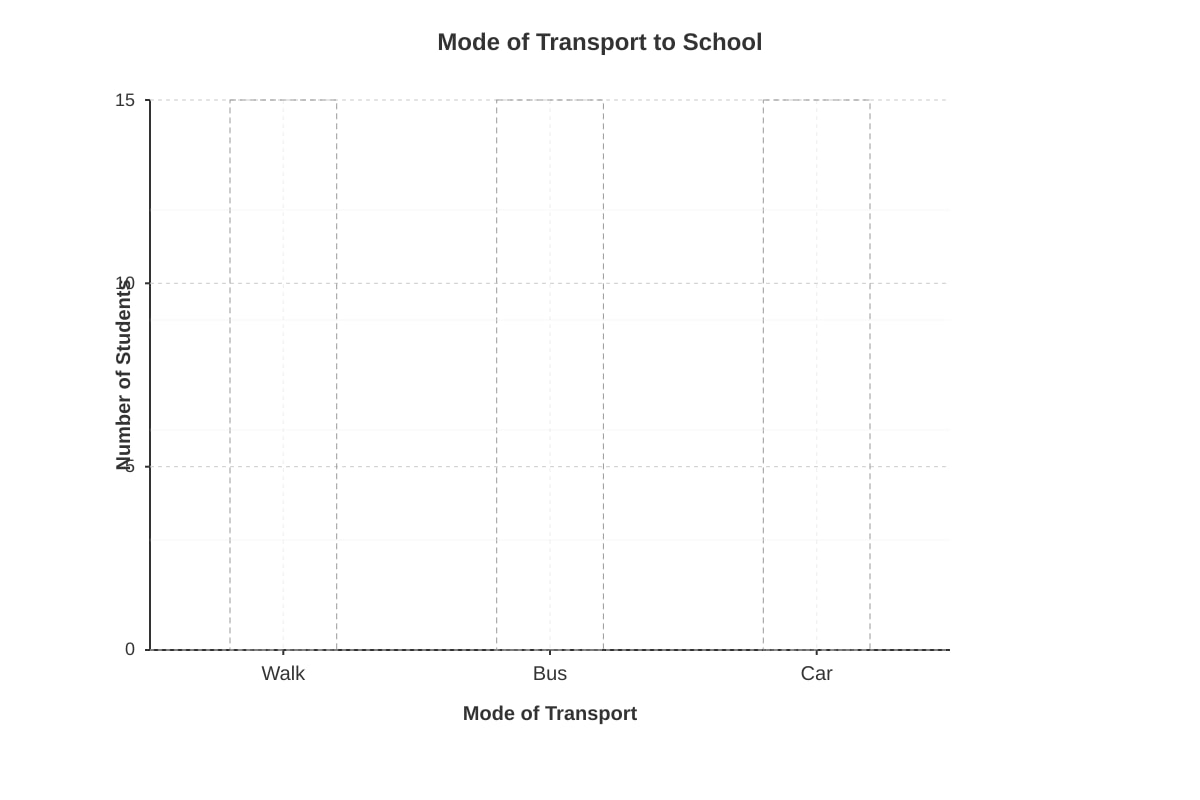
- Answer: (Student draws a bar graph with bars: Walk=10, Bus=12, Car=8 (since 30-10-12=8).)
- Explanation: Number of students who come by car = 30 - 10 - 12 = 8. The bars should be drawn to heights: Walk = 10, Bus = 12, Car = 8.
- Working: Total students who walk or take bus = 10 + 12 = 22. Students who come by car = 30 - 22 = 8.
- Marking: 1 mark for correct calculation of car (8 students). 1 mark for correctly drawn bars on the grid (all three bars at approximately correct heights relative to the scale).
- Common Mistake: Students might forget to calculate the number of students who come by car. They might also draw the bars at the wrong heights on the grid.
Question 19 (2 marks)
- Answers: (a) 14 cm, (b) 10 cm
- Explanation: (a) The point for Week 3 is at 14 cm. (b) Height at Week 4 = 18 cm. Height at Week 2 = 8 cm. Growth = 18 - 8 = 10 cm.
- Working: (a) Read from graph. (b) 18 - 8 = 10
- Marking: (a) 1 mark for correct answer. (b) 1 mark for correct answer.
- Common Mistake: For part (b), students might calculate the growth from Week 2 to Week 3 (14-8=6) or from Week 3 to Week 4 (18-14=4) instead of from Week 2 to Week 4. They need to read the question carefully.
Question 20 (2 marks)
- Answers: (a) Green, (b) 10
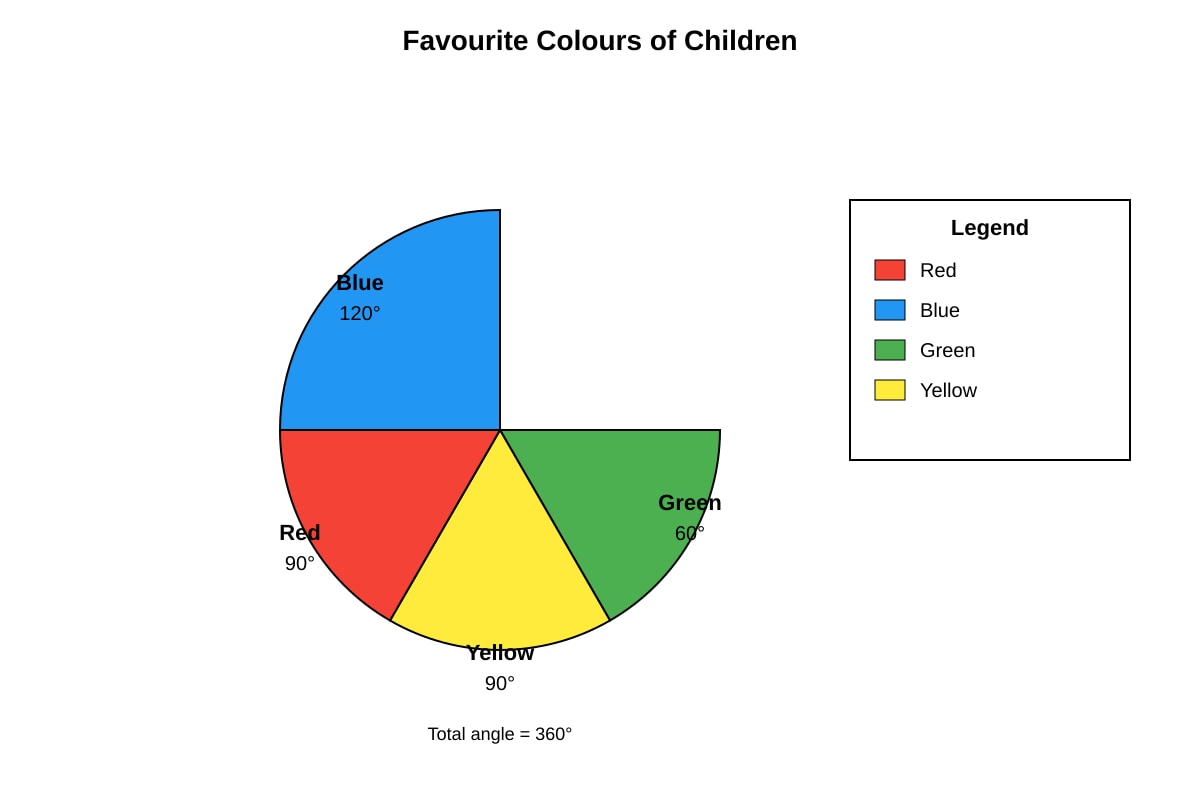
- Explanation: (a) The smallest sector in the pie chart is Green (60°). (b) The fraction of children who chose Blue is 120° out of 360° in a full circle. 120/360 = 1/3. If 30 children were surveyed, number who chose Blue = 1/3 × 30 = 10.
- Working: (a) Green sector = 60°, smallest. (b) Fraction for Blue = 120/360 = 1/3. Number of children = 1/3 × 30 = 10.
- Marking: (a) 1 mark for correct answer. (b) 1 mark for correct working and answer.
- Common Mistake: For part (b), students might try to guess the number based on the visual size of the sector without using the angles. They need to use the angle given in the diagram (120°) to find the fraction. Alternatively, if the diagram is a plain pie chart without angles, they might estimate. The placeholder specifies angles to allow for exact calculation. Students might also forget that a full circle is 360°.