AI Generated Quiz
Primary 3 Mathematics Data Analysis Quiz
Free P3 Maths Data Analysis quiz, HY3 AI version, with questions, answers, and syllabus-aligned practice for Singapore students.
These static practice materials are generated from the site's syllabus and paper-generation workflow, with source and model context shown so students and parents can evaluate the material before use.
Questions
Primary 3 Mathematics Quiz - Data Analysis
Name: ___________________________
Class: ________
Date: ____________
Score: _______ / 40
Duration: 50 minutes
Total Marks: 40
Instructions:
- This quiz has 20 questions on Data Analysis (bar graphs and picture graphs).
- Read each question carefully.
- Show your working where needed.
- Section A: 10 questions (1 mark each). Section B: 6 questions (2 marks each). Section C: 4 questions (3 marks each).
Section A (1 mark each, Questions 1–10)
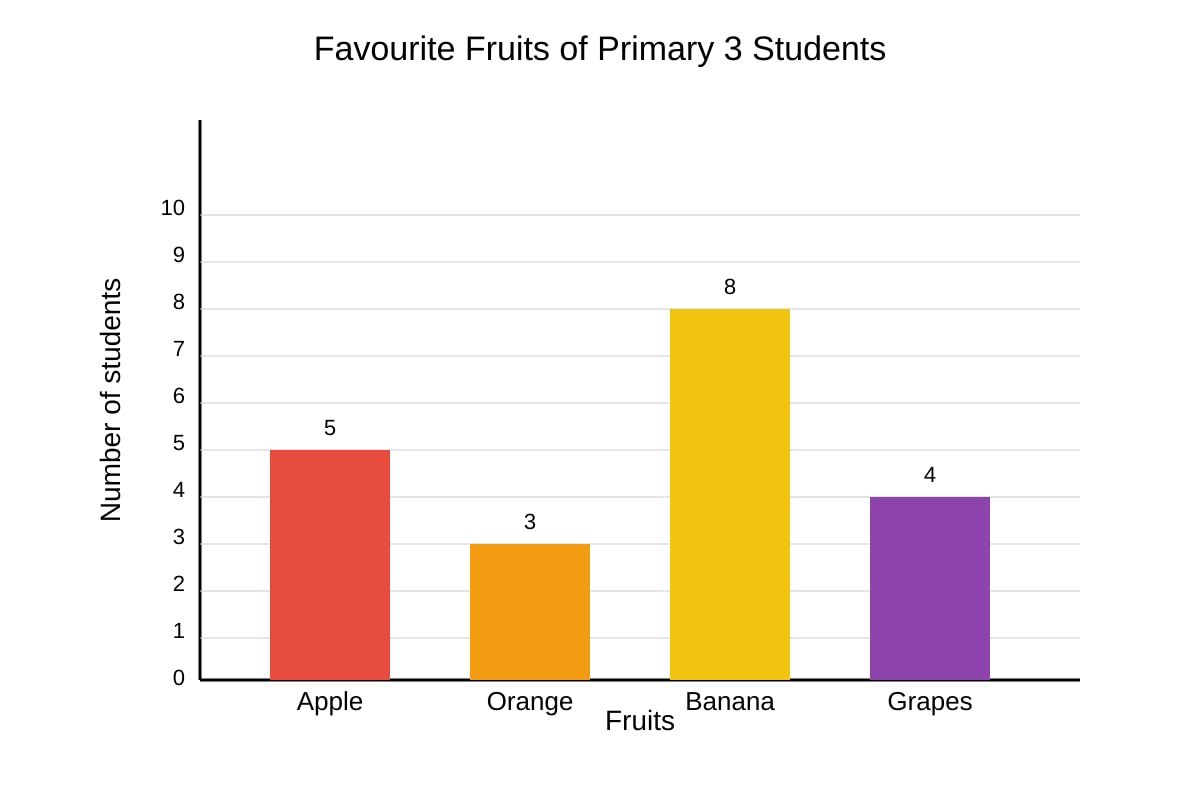
1. Look at the bar graph below.
Image pending generation: graph for Q1.
How many students chose Banana as their favourite fruit?
2. The bar graph in Q1 shows favourite fruits. Which fruit is liked by the fewest students?
3. A picture graph uses 1 star to represent 2 books. If Sam has 3 stars, how many books does Sam have?
4. Look at the bar graph from Q1. How many more students chose Apple than Orange?
5. In a picture graph, 1 circle stands for 5 children. Wei Ming has 4 circles. How many children does that show?
6. The bar graph in Q1 shows four fruits. How many fruits are shown in total on the graph?
7. A bar graph has title "Pets in Class 3B". The bars show: Dog = 6, Cat = 4, Rabbit = 2. What is the total number of pets?
8. In a picture graph, 1 triangle = 3 pencils. Lily has 5 triangles. How many pencils does she have?
9. From the Q1 bar graph, how many students chose Grapes?
10. A bar graph shows the number of buses: Monday = 7, Tuesday = 5, Wednesday = 9. On which day were there the most buses?
Section B (2 marks each, Questions 11–16)
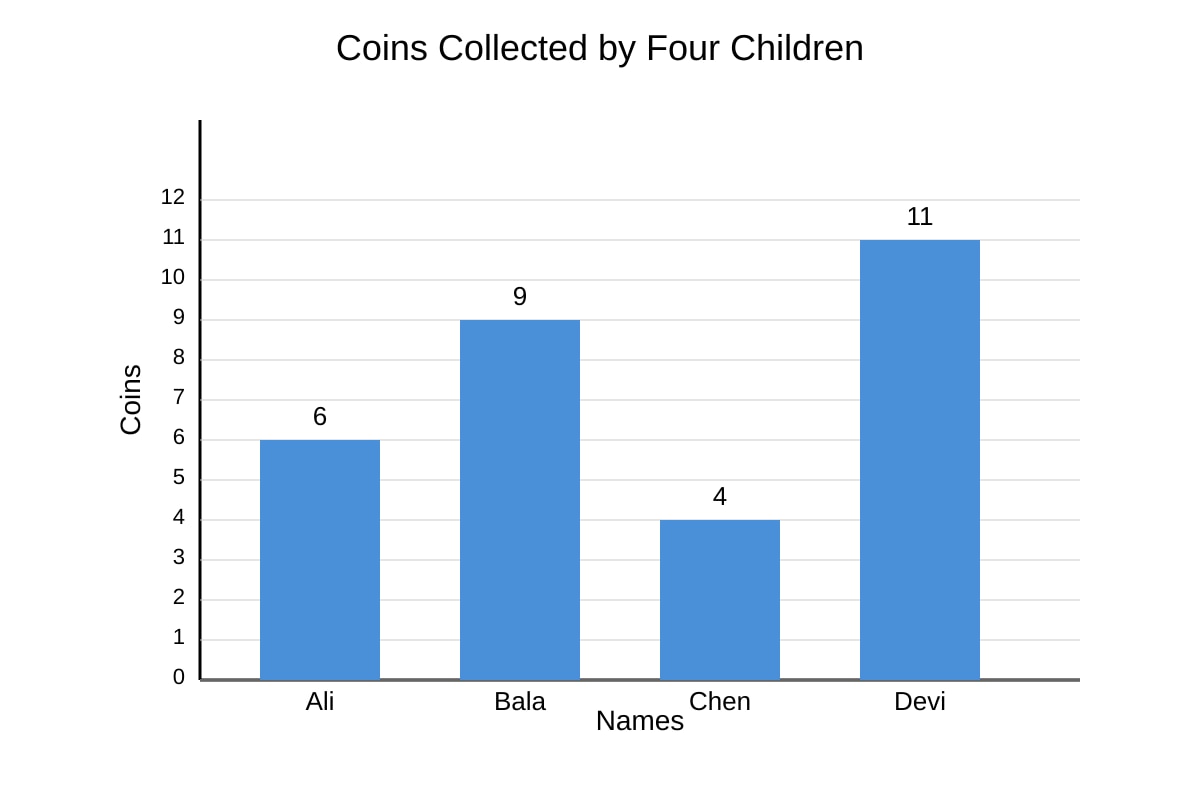
11. The bar graph below shows the number of coins collected by four children.
Image pending generation: graph for Q11.
(a) Who collected the most coins? ___________
(b) How many more coins did Devi collect than Chen? ___________
12. A picture graph shows the number of stickers each pupil has. Key: 1 sticker picture = 2 stickers.
Ravi: 4 pictures, Siti: 6 pictures, Jon: 3 pictures.
(a) How many stickers does Siti have? ___________
(b) How many more stickers does Ravi have than Jon? ___________
13. The bar graph from Q1 (fruits) is repeated here.
(a) Find the total number of students who chose Apple and Grapes. ___________
(b) How many students are there altogether in the survey? ___________
14. A class made a bar graph of favourite colours: Red = 7, Blue = 5, Green = 3, Yellow = 5.
(a) Which colour is the most popular? ___________
(b) How many more students chose Red than Green? ___________
15. In a picture graph, 1 book icon = 4 books read.
Mei: 5 icons, Tom: 2 icons, Eva: 3 icons.
(a) How many books did Mei read? ___________
(b) How many books did the three children read altogether? ___________
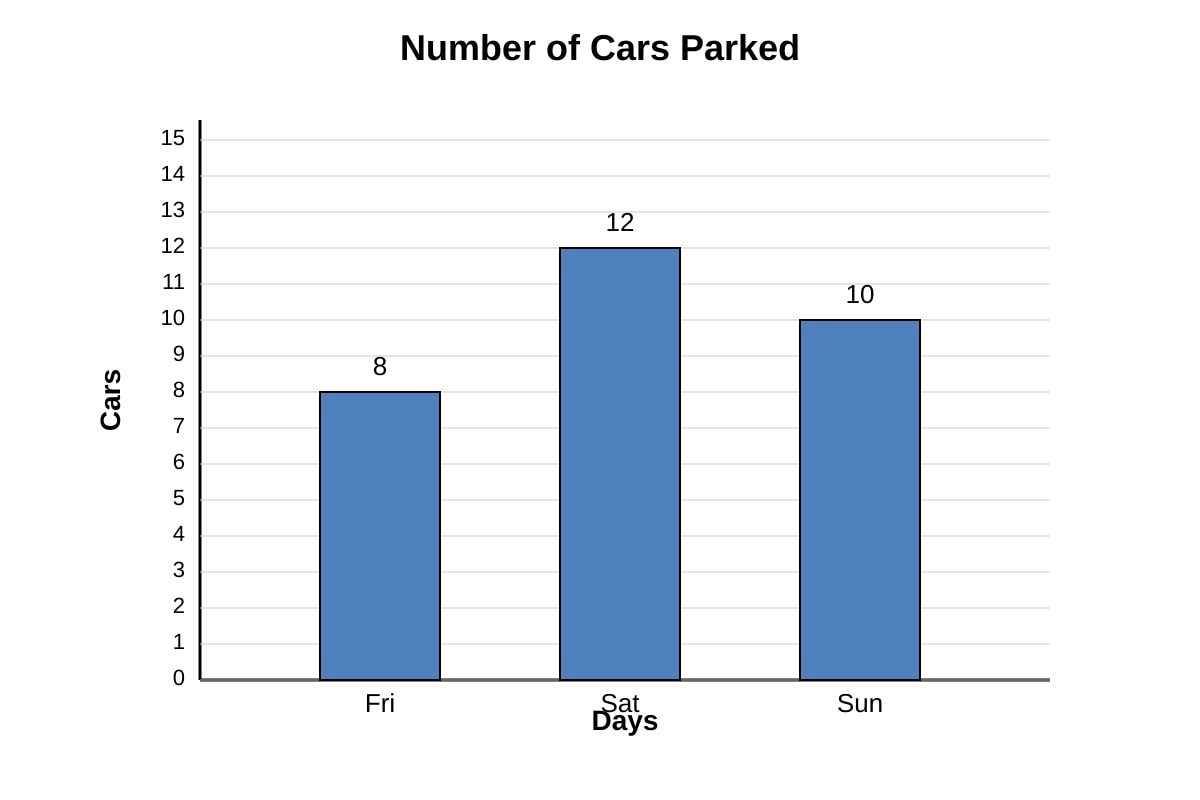
16. The bar graph below shows the number of cars parked on 3 days.
Image pending generation: graph for Q16.
(a) On which day were the fewest cars parked? ___________
(b) How many cars were parked on Saturday and Sunday altogether? ___________
Section C (3 marks each, Questions 17–20)
17. A bar graph shows the number of points scored by four teams in a quiz:
Team A = 10, Team B = 6, Team C = 14, Team D = 8.
(a) Which team scored the highest? ___________ (1 mark)
(b) Find the total points scored by all teams. ___________ (1 mark)
(c) How many more points did Team C score than Team B? ___________ (1 mark)
18. A picture graph uses 1 fish = 5 fish caught.
Boy A: 2 fish pictures, Boy B: 4 fish pictures, Boy C: 3 fish pictures.
(a) How many fish did Boy B catch? ___________ (1 mark)
(b) How many fish did Boy A and Boy C catch altogether? ___________ (1 mark)
(c) How many more fish did Boy B catch than Boy A? ___________ (1 mark)
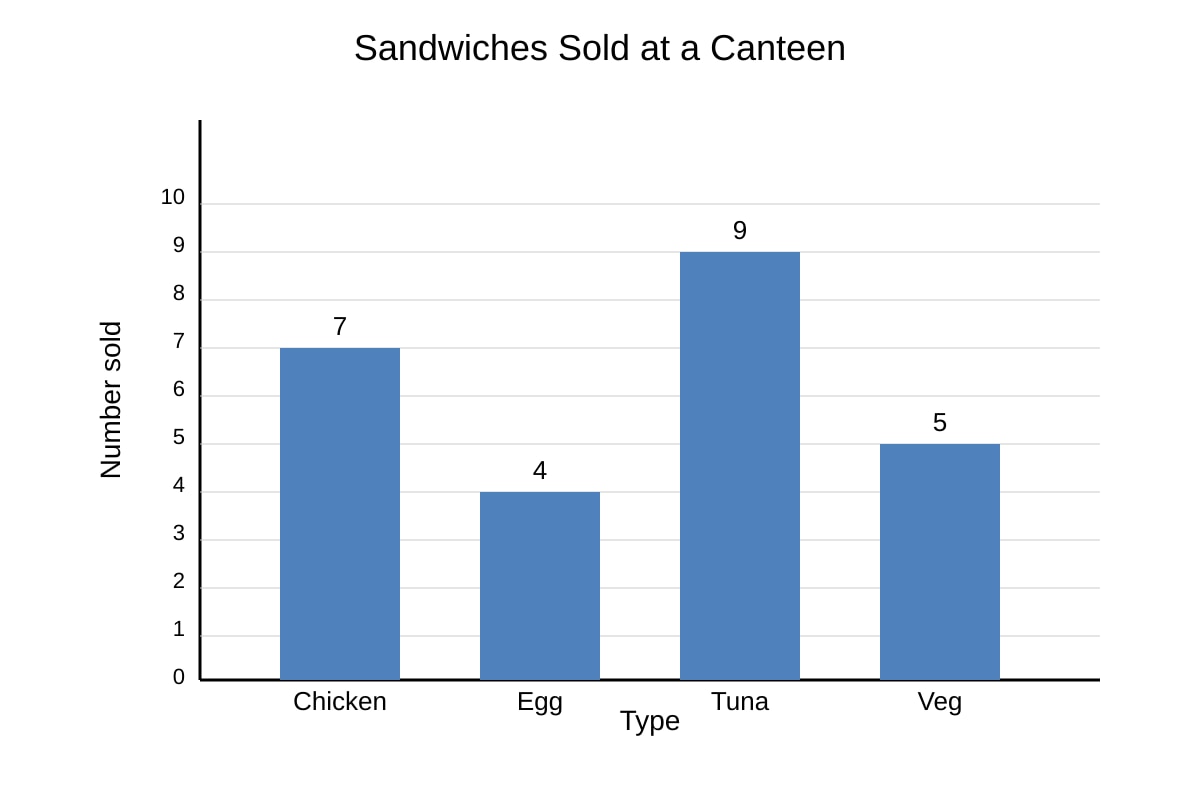
19. The bar graph below shows the number of sandwiches sold at a canteen.
Image pending generation: graph for Q19.
(a) Which type of sandwich sold the most? ___________ (1 mark)
(b) How many sandwiches were sold altogether? ___________ (1 mark)
(c) How many more Tuna than Egg sandwiches were sold? ___________ (1 mark)
20. Primary 3 students voted for their favourite sport. Results:
Football = 12, Swimming = 8, Badminton = 6, Cycling = 4.
(a) Draw a bar graph in the space below to show this data. (Use a scale of 1 square = 2 votes) ___________ (1 mark)
(b) Which sport got the fewest votes? ___________ (1 mark)
(c) How many more students chose Football than Badminton? ___________ (1 mark)
Answers
Primary 3 Mathematics Quiz - Data Analysis (Answer Key)
Total Marks: 40
Topic: Data Analysis (bar graphs and picture graphs)
Section A Answers (1 mark each)
Q1. 8
Teaching note: From the bar graph Q1-fig1, the Banana bar reaches 8 on the y-axis. Read the height of the bar carefully.
Q2. Orange
Teaching note: Orange bar is 3, the shortest among 5, 3, 8, 4. Fewest = smallest number.
Q3. 6 books
Working: 3 stars × 2 books per star = 6 books.
Q4. 2
Working: Apple = 5, Orange = 3. 5 − 3 = 2.
Q5. 20 children
Working: 4 circles × 5 children per circle = 20.
Q6. 20
Working: 5 + 3 + 8 + 4 = 20 fruits.
Q7. 12 pets
Working: 6 + 4 + 2 = 12.
Q8. 15 pencils
Working: 5 triangles × 3 pencils = 15.
Q9. 4
Teaching note: Grapes bar height is 4.
Q10. Wednesday
Teaching note: Wednesday = 9 is the largest among 7, 5, 9.
Section B Answers (2 marks each)
Q11.
(a) Devi (1 mark)
(b) 7 (1 mark)
Working: Devi = 11, Chen = 4. 11 − 4 = 7.
Common mistake: Picking Ali instead of Devi because bar looks tall but not tallest.
Q12.
(a) 12 stickers (1 mark)
(b) 2 stickers (1 mark)
Working: Siti: 6 × 2 = 12. Ravi: 4 × 2 = 8, Jon: 3 × 2 = 6. 8 − 6 = 2.
Q13.
(a) 9 (1 mark)
(b) 20 (1 mark)
Working: Apple 5 + Grapes 4 = 9. Total = 5+3+8+4 = 20.
Q14.
(a) Red (1 mark)
(b) 4 (1 mark)
Working: Red 7, Green 3. 7 − 3 = 4.
Q15.
(a) 20 books (1 mark)
(b) 40 books (1 mark)
Working: Mei: 5 × 4 = 20. Tom: 2 × 4 = 8. Eva: 3 × 4 = 12. Total = 20+8+12 = 40.
Q16.
(a) Friday (1 mark)
(b) 22 cars (1 mark)
Working: Sat 12 + Sun 10 = 22.
Section C Answers (3 marks each)
Q17.
(a) Team C (1 mark)
(b) 38 (1 mark)
(c) 8 (1 mark)
Working: Total = 10+6+14+8 = 38. Team C (14) − Team B (6) = 8.
Q18.
(a) 20 fish (1 mark)
(b) 25 fish (1 mark)
(c) 10 fish (1 mark)
Working: Boy B: 4 × 5 = 20. Boy A: 2×5=10, Boy C: 3×5=15, total = 25. Boy B − Boy A = 20−10 = 10.
Q19.
(a) Tuna (1 mark)
(b) 25 (1 mark)
(c) 5 (1 mark)
Working: Total = 7+4+9+5 = 25. Tuna 9 − Egg 4 = 5.
Q20.
(a) Bar graph drawn with Football=6 squares, Swimming=4, Badminton=3, Cycling=2 (1 mark)
(b) Cycling (1 mark)
(c) 6 (1 mark)
Working: Football 12 − Badminton 6 = 6.
Note for (a): Correct bars with scale 1 sq = 2 votes; all four bars labelled.
Free quiz and exam paper access
Enter your details to view this paper
Your access is remembered on this device.