From Real Exams Quiz
Primary 3 Mathematics Data Analysis Quiz
Free P3 Maths Data Analysis quiz, HY3 Exam version, with questions, answers, and syllabus-aligned practice for Singapore students.
These static practice materials are generated from the site's syllabus and paper-generation workflow, with source and model context shown so students and parents can evaluate the material before use.
Questions
Primary 3 Mathematics Quiz - Data Analysis
Name: ___________________________
Class: _________
Date: ____________
Score: _______ / 40
Duration: 50 minutes
Total Marks: 40
Instructions:
- This quiz has 20 questions on Data Analysis (bar graphs and picture graphs).
- Read each question carefully.
- Show your working where needed.
- Section A: 10 questions (1 mark each). Section B: 6 questions (2 marks each). Section C: 4 questions (3 marks each).
Section A (1 mark each, Questions 1–10)
-
A bar graph shows the number of books read by 4 children. The bar for Ali reaches 6. How many books did Ali read?
-
In a picture graph, 1 star stands for 2 pupils. Mei has 3 stars. How many pupils does Mei represent?
-
A bar graph shows favourite fruits. Mango bar is 5, Apple bar is 8. Which fruit is more popular?
-
The bar for "Bus" is 7 and "Car" is 4 on a graph of vehicles. How many more buses than cars?
-
A picture graph uses 1 circle = 5 stickers. Sam has 2 circles. How many stickers does Sam have?
-
On a bar graph of pets, the Cat bar is 9 and Dog bar is 6. Which has fewer?
-
A graph shows 3 red balls, 5 blue balls, 2 green balls. Which colour has the smallest number?
-
In a picture graph, 1 tree = 10 trees planted. A class has 4 trees shown. How many did they plant?
-
A bar graph shows scores: Class A = 12, Class B = 15. Which class scored less?
-
A bar is drawn to 4 on a graph of pencils. What number does the bar show?
Section B (2 marks each, Questions 11–16)
- A bar graph shows the number of apples sold: Monday = 3, Tuesday = 5, Wednesday = 7.
(a) On which day were the most apples sold?
(b) How many apples were sold on Tuesday and Wednesday altogether?
- A picture graph shows favourite drinks. 1 cup = 2 pupils.
Milk: 4 cups, Juice: 3 cups, Water: 5 cups.
(a) How many pupils chose Water?
(b) How many more pupils chose Milk than Juice?
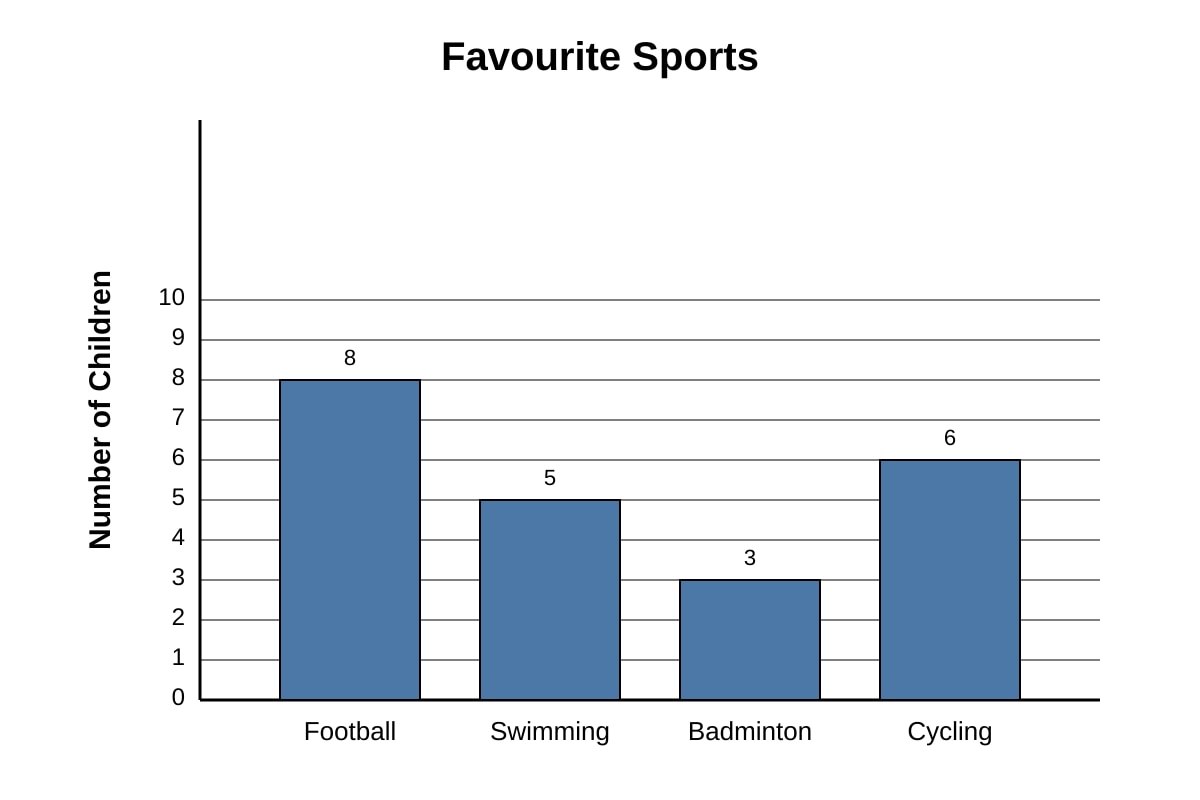
- The bar graph below shows the number of children who like each sport.

Generated graph for Q13.
(a) Which sport is liked by the fewest children?
(b) How many children like Football and Cycling altogether?
- A picture graph uses 1 fish = 4 fish caught.
Ravi: 3 fish symbols, Siti: 2 fish symbols, Tom: 5 fish symbols.
(a) How many fish did Siti catch?
(b) Who caught the most fish?
- A bar graph shows the height of plants in cm: Plant A = 12, Plant B = 9, Plant C = 15.
(a) Which plant is the tallest?
(b) What is the difference in height between Plant C and Plant B?
- A class made a picture graph of transport to school. 1 bus = 3 pupils.
Walk: 2 buses, Cycle: 1 bus, MRT: 4 buses.
(a) How many pupils walked?
(b) How many pupils took MRT or cycled?
Section C (3 marks each, Questions 17–20)
- A bar graph shows the number of points scored by 4 teams:
Team 1 = 10, Team 2 = 6, Team 3 = 8, Team 4 = 4.
(a) Which team scored the most points? (1 mark)
(b) Find the total points scored by all teams. (2 marks)
- A picture graph shows books borrowed from library. 1 book icon = 5 books.
Monday: 2 icons, Tuesday: 4 icons, Wednesday: 3 icons.
(a) How many books were borrowed on Tuesday? (1 mark)
(b) How many more books were borrowed on Tuesday than Monday? (2 marks)
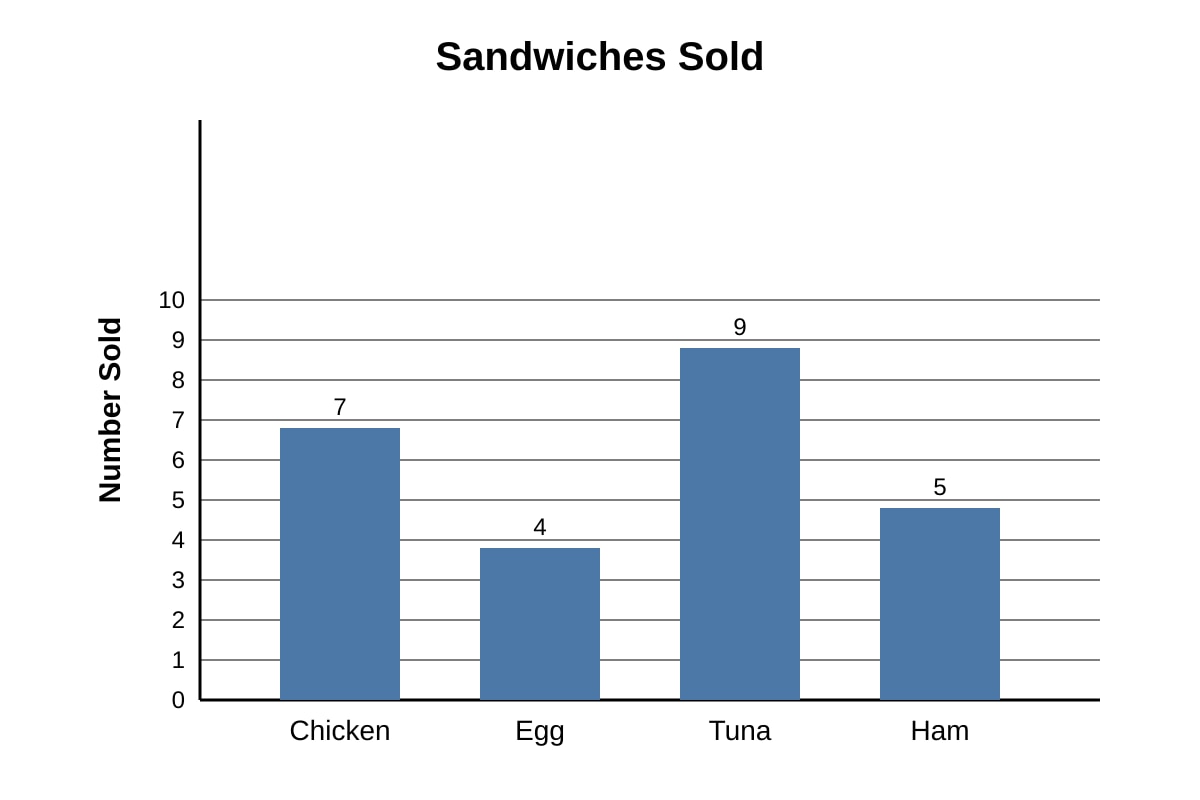
- The bar graph below shows the number of sandwiches sold at a stall.

Generated graph for Q19.
(a) Which sandwich was sold the most? (1 mark)
(b) How many sandwiches were sold altogether? (2 marks)
- A survey of 20 pupils asked for their favourite fruit. A bar graph shows:
Orange = 5, Banana = 7, Grapes = 4, Pear = ?
(a) Find the number of pupils who chose Pear. (1 mark)
(b) Which fruit was chosen by the second most pupils? (1 mark)
(c) How many more pupils chose Banana than Grapes? (1 mark)
Answers
Primary 3 Mathematics Quiz - Data Analysis (Answer Key)
Total Marks: 40
Topic: Data Analysis (bar graphs and picture graphs)
Section A Answers (1 mark each)
-
6
Teaching note: A bar graph uses the height of the bar to show the number. Ali’s bar reaches 6, so he read 6 books. Common mistake: misreading the scale. -
6 pupils
Method: 1 star = 2 pupils, Mei has 3 stars → 3 × 2 = 6. Picture graphs use symbols to stand for a number. -
Apple
Mango = 5, Apple = 8. 8 > 5, so Apple is more popular. -
3
Buses = 7, Cars = 4. Difference = 7 − 4 = 3. -
10 stickers
1 circle = 5 stickers, Sam has 2 → 2 × 5 = 10. -
Dog
Cat = 9, Dog = 6. 6 < 9, so Dog has fewer. -
Green
Red = 3, Blue = 5, Green = 2. Smallest is 2 (Green). -
40 trees
1 tree symbol = 10, 4 symbols → 4 × 10 = 40. -
Class A
Class A = 12, Class B = 15. 12 < 15, so Class A scored less. -
4
Bar drawn to 4 means the value is 4.
Section B Answers (2 marks each)
-
(a) Wednesday (1 mark) – Bar for Wednesday is 7, the highest.
(b) 12 (1 mark) – Tuesday 5 + Wednesday 7 = 12. Working: 5 + 7 = 12. -
(a) 10 pupils (1 mark) – Water: 5 cups × 2 = 10.
(b) 2 pupils (1 mark) – Milk: 4×2=8, Juice: 3×2=6, difference 8−6=2. -
(a) Badminton (1 mark) – From graph, Badminton bar is 3, the lowest.
(b) 14 children (1 mark) – Football 8 + Cycling 6 = 14. Working: 8 + 6 = 14.
Visual check: graph shows labelled bars with values as described. -
(a) 8 fish (1 mark) – Siti: 2 symbols × 4 = 8.
(b) Tom (1 mark) – Tom 5×4=20, Ravi 3×4=12, Siti 8. Tom most. -
(a) Plant C (1 mark) – Height 15 cm is tallest.
(b) 6 cm (1 mark) – Plant C 15 − Plant B 9 = 6. Working: 15 − 9 = 6. -
(a) 6 pupils (1 mark) – Walk: 2 buses × 3 = 6.
(b) 15 pupils (1 mark) – MRT: 4×3=12, Cycle: 1×3=3, total 12+3=15.
Section C Answers (3 marks each)
-
(a) Team 1 (1 mark) – Score 10 is highest.
(b) 28 points (2 marks) – Working: 10 + 6 + 8 + 4 = 28. Marking: 1 mark for correct addition, 1 mark for final answer. -
(a) 20 books (1 mark) – Tuesday: 4 icons × 5 = 20.
(b) 10 books (2 marks) – Monday: 2×5=10, Tuesday 20, difference 20−10=10. Marking: 1 mark method, 1 mark answer. -
(a) Tuna (1 mark) – Bar at 9 is highest.
(b) 25 sandwiches (2 marks) – Working: 7 + 4 + 9 + 5 = 25. From placeholder graph values. Marking: 1 mark sum, 1 mark total. -
(a) Pear = 4 (1 mark) – Total 20 − (5+7+4) = 20 − 16 = 4.
(b) Orange (1 mark) – Counts: Banana 7 (most), Orange 5 (second), Grapes 4, Pear 4.
(c) 3 (1 mark) – Banana 7 − Grapes 4 = 3.
Free quiz and exam paper access
Enter your details to view this paper
Your access is remembered on this device.