AI Generated Quiz
Primary 2 Mathematics Picture Graphs Quiz
Free P2 Maths Picture Graphs quiz, AI version, with questions, answers, and syllabus-aligned practice for Singapore students.
These static practice materials are generated from the site's syllabus and paper-generation workflow, with source and model context shown so students and parents can evaluate the material before use.
Questions
Free quiz and exam paper access
Enter your details to view this paper
Your access is remembered on this device.
Answers
Primary 2 Mathematics Quiz - Picture Graphs (Answer Key)
Total Marks: 20
Section A: Reading Picture Graphs (Questions 1 to 5)
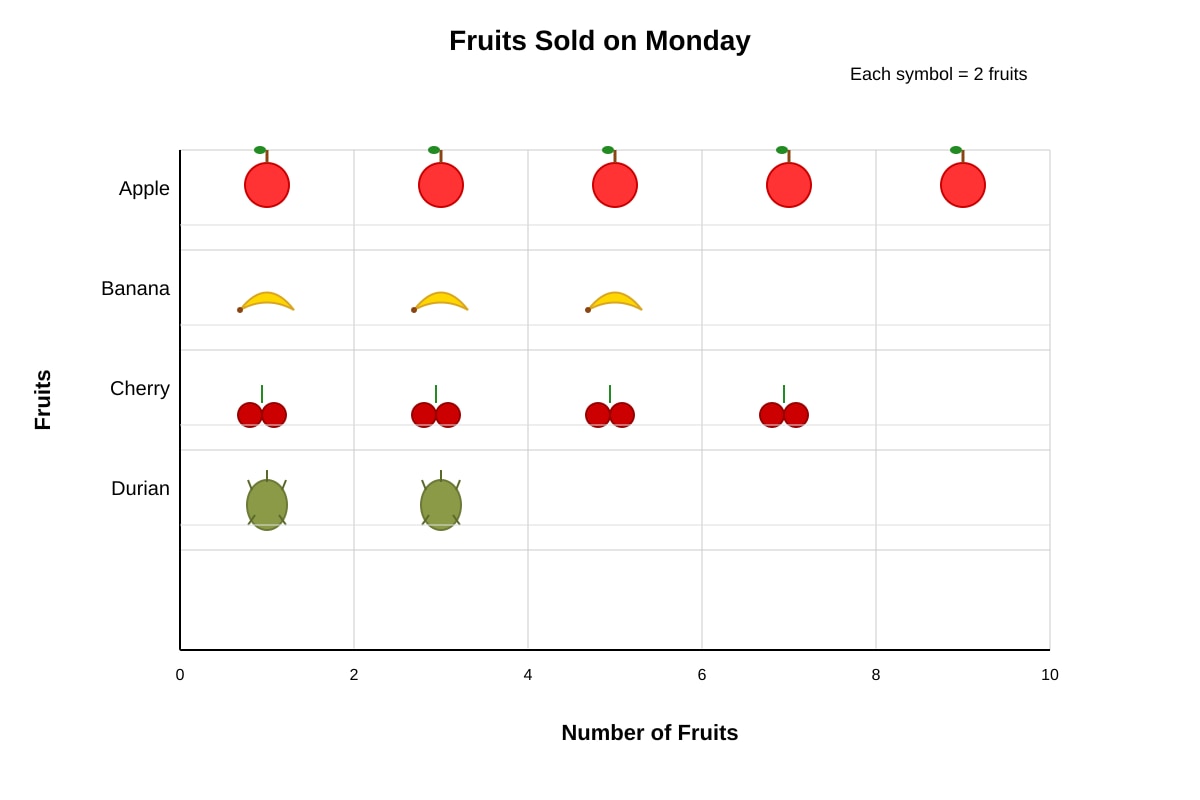
Context for Q1-Q5: The picture graph shows fruits sold on Monday. Each symbol represents 2 fruits. This means to find the actual number, we multiply the number of symbols by 2.
Question 1
Answer: 10 apples Marks: 1 Explanation: The row for Apple has 5 symbols. Each symbol = 2 apples. So, 5 × 2 = 10 apples. Teaching Note: When a picture graph uses a scale (each symbol = more than 1), we must multiply the number of symbols by the scale to find the actual value. Here, 5 symbols × 2 apples per symbol = 10 apples. Common Mistake: Students might count only the symbols (5) instead of multiplying by the scale (2).
Question 2
Answer: 6 bananas Marks: 1 Explanation: The row for Banana has 3 symbols. 3 × 2 = 6 bananas. Teaching Note: Same method as Q1. Always check the scale of the picture graph first.
Question 3
Answer: Apple Marks: 1 Explanation: Apple has 5 symbols (10 apples), Banana has 3 symbols (6 bananas), Cherry has 4 symbols (8 cherries), Durian has 2 symbols (4 durians). Apple has the most symbols, so it has the most fruits sold. Teaching Note: We can compare either the number of symbols or the actual values. Since each symbol represents the same number (2), comparing symbols is faster.
Question 4
Answer: 4 more cherries Marks: 1 Explanation: Cherry has 4 symbols (8 cherries). Durian has 2 symbols (4 durians). Difference = 4 symbols - 2 symbols = 2 symbols. 2 × 2 = 4 more cherries. OR 8 - 4 = 4 more cherries. Teaching Note: "How many more" means we subtract the smaller from the larger. We can find the difference in symbols (4 - 2 = 2 symbols) and then multiply by the scale (2 × 2 = 4), or find the actual values first and subtract.
Question 5
Answer: 28 fruits Marks: 1 Explanation: Total symbols = 5 + 3 + 4 + 2 = 14 symbols. 14 × 2 = 28 fruits. OR 10 + 6 + 8 + 4 = 28 fruits. Teaching Note: "Altogether" means we add all the values. We can add the symbols first and then multiply by the scale, or find each actual value and add them.
Section B: Interpreting Picture Graphs (Questions 6 to 10)
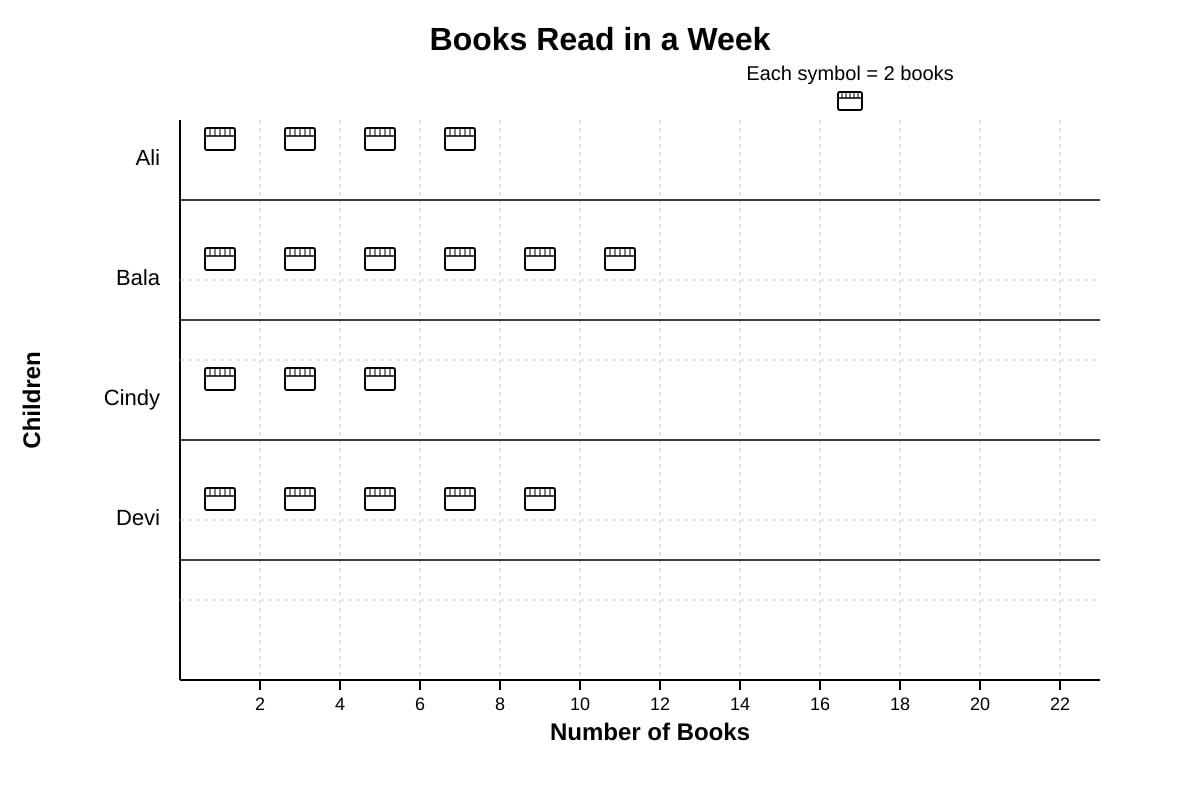
Context for Q6-Q10: The picture graph shows books read by four children. Each symbol represents 2 books.
Question 6
Answer: 8 books Marks: 1 Explanation: Ali has 4 symbols. 4 × 2 = 8 books. Teaching Note: Same method as Section A. Always check the scale first.
Question 7
Answer: Bala Marks: 1 Explanation: Bala has 6 symbols, which is the most. 6 × 2 = 12 books. Teaching Note: Compare the number of symbols or the actual values. Bala has the longest row of symbols.
Question 8
Answer: 22 books Marks: 1 Explanation: Bala has 6 symbols (12 books). Devi has 5 symbols (10 books). 12 + 10 = 22 books. OR 6 + 5 = 11 symbols, 11 × 2 = 22 books. Teaching Note: "Altogether" means add. We can add the actual values or add the symbols and multiply by the scale.
Question 9
Answer: 6 more books Marks: 1 Explanation: Bala has 6 symbols (12 books). Cindy has 3 symbols (6 books). 12 - 6 = 6 more books. OR 6 - 3 = 3 symbols, 3 × 2 = 6 more books. Teaching Note: "How many more" means subtract the smaller from the larger.
Question 10
Answer: 36 books Marks: 1 Explanation: Total symbols = 4 + 6 + 3 + 5 = 18 symbols. 18 × 2 = 36 books. OR 8 + 12 + 6 + 10 = 36 books. Teaching Note: "In total" means add all the values. Check your addition carefully.
Section C: Drawing and Completing Picture Graphs (Questions 11 to 15)
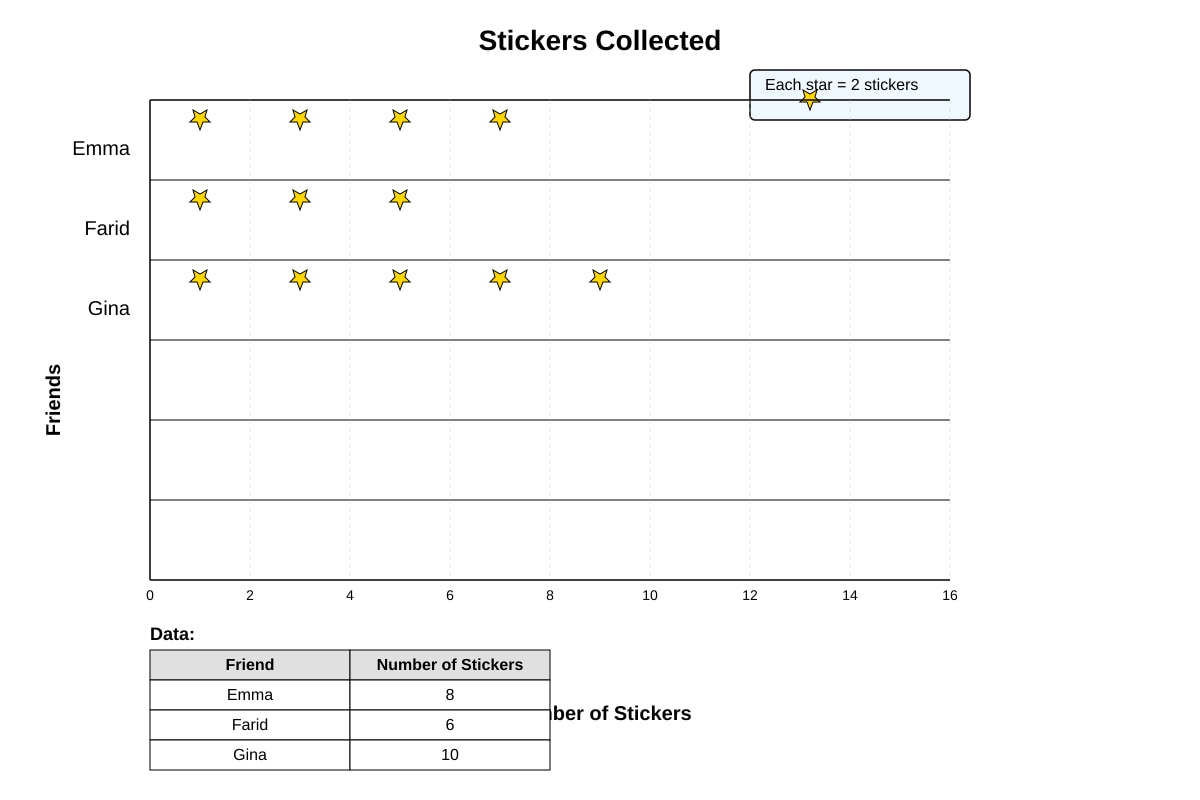
Context for Q11-Q15: The table shows stickers collected by three friends. Each star symbol = 2 stickers.
Question 11
Answer: Students should draw a picture graph with:
- Emma: 4 star symbols
- Farid: 3 star symbols
- Gina: 5 star symbols Marks: 1 Explanation: Emma has 8 stickers, so 8 ÷ 2 = 4 stars. Farid has 6 stickers, so 6 ÷ 2 = 3 stars. Gina has 10 stickers, so 10 ÷ 2 = 5 stars. Teaching Note: To draw a picture graph from a table, we divide the actual number by the scale to find how many symbols to draw. The graph should have a title, labels, and the correct number of symbols. Marking Note: Award 1 mark for correct number of symbols for all three friends. Deduct if symbols are not neatly drawn or if the graph is not labelled.
Question 12
Answer: 4 star symbols Marks: 1 Explanation: Emma has 8 stickers. Each star = 2 stickers. 8 ÷ 2 = 4 stars. Teaching Note: This is the reverse of reading a picture graph. Instead of multiplying, we divide.
Question 13
Answer: 5 star symbols Marks: 1 Explanation: Gina has 10 stickers. 10 ÷ 2 = 5 stars. Teaching Note: Same method as Q12. Divide the actual number by the scale.
Question 14
Answer: Gina Marks: 1 Explanation: Gina has 10 stickers, which is the most. She needs 5 star symbols. Teaching Note: We can compare the actual numbers from the table or the number of symbols in the graph.
Question 15
Answer: 14 stickers Marks: 1 Explanation: Emma has 8 stickers. Farid has 6 stickers. 8 + 6 = 14 stickers. Teaching Note: "Altogether" means add. This question uses the actual numbers from the table, not the symbols.
Section D: More Practice with Picture Graphs (Questions 16 to 20)
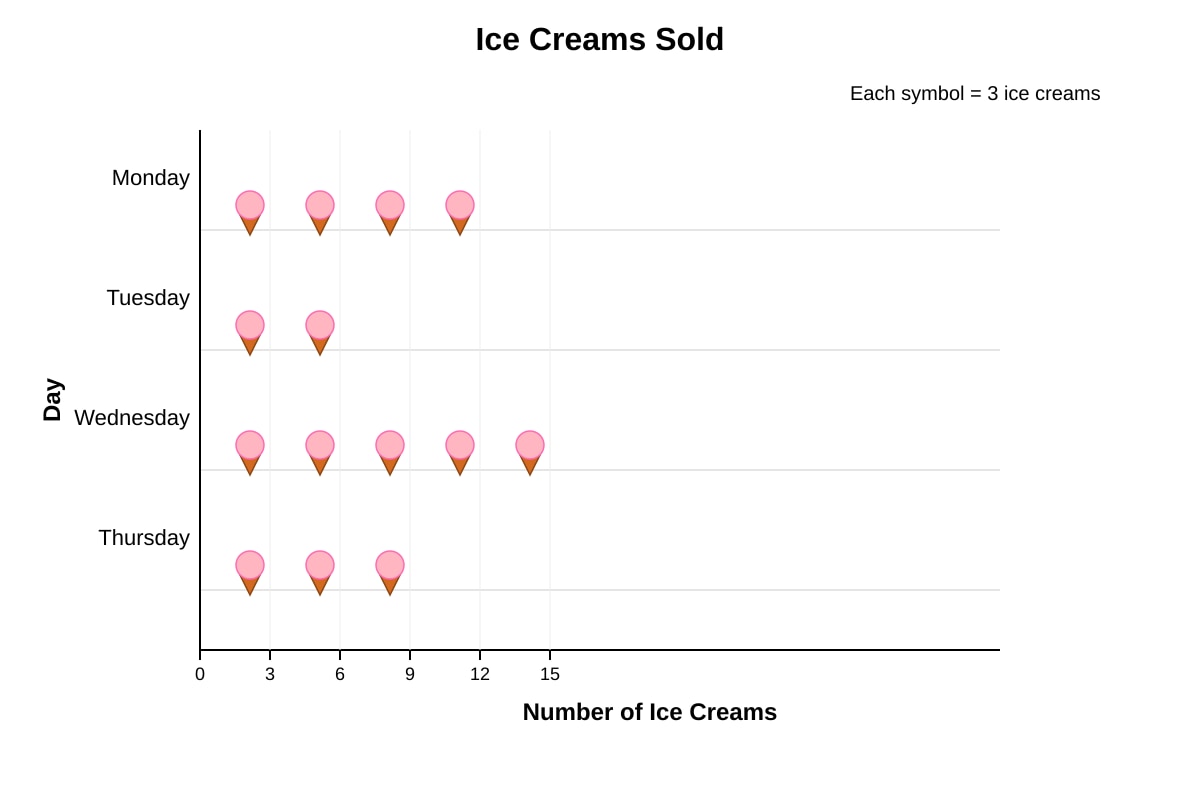
Context for Q16-Q20: The picture graph shows ice creams sold. Each symbol represents 3 ice creams.
Question 16
Answer: 12 ice creams Marks: 1 Explanation: Monday has 4 symbols. 4 × 3 = 12 ice creams. Teaching Note: The scale is different here (each symbol = 3). Always check the scale before calculating.
Question 17
Answer: 6 ice creams Marks: 1 Explanation: Tuesday has 2 symbols. 2 × 3 = 6 ice creams. Teaching Note: Same method as Q16.
Question 18
Answer: Wednesday Marks: 1 Explanation: Wednesday has 5 symbols, which is the most. 5 × 3 = 15 ice creams. Teaching Note: Compare the number of symbols or the actual values. Wednesday has the longest row.
Question 19
Answer: 9 more ice creams Marks: 1 Explanation: Wednesday has 5 symbols (15 ice creams). Tuesday has 2 symbols (6 ice creams). 15 - 6 = 9 more ice creams. OR 5 - 2 = 3 symbols, 3 × 3 = 9 more ice creams. Teaching Note: "How many more" means subtract. We can work with symbols or actual values.
Question 20
Answer: 42 ice creams Marks: 1 Explanation: Total symbols = 4 + 2 + 5 + 3 = 14 symbols. 14 × 3 = 42 ice creams. OR 12 + 6 + 15 + 9 = 42 ice creams. Teaching Note: "Altogether" means add all the values. Double-check your addition.
Marking Summary:
- Each question is worth 1 mark.
- Total marks: 20
- Award full marks for correct final answer.
- For questions requiring working (e.g., Q11), award marks for correct reasoning even if the drawing is slightly messy, as long as the correct number of symbols is shown.