AI Generated Quiz
Primary 2 Mathematics Picture Graphs Quiz
Free P2 Maths Picture Graphs quiz, AI version, with questions, answers, and syllabus-aligned practice for Singapore students.
These static practice materials are generated from the site's syllabus and paper-generation workflow, with source and model context shown so students and parents can evaluate the material before use.
Questions
Free quiz and exam paper access
Enter your details to view this paper
Your access is remembered on this device.
Answers
Answer Key: Primary 2 Mathematics Quiz - Picture Graphs
Total Marks: 40
Section A: Reading Picture Graphs (Questions 1 to 5)
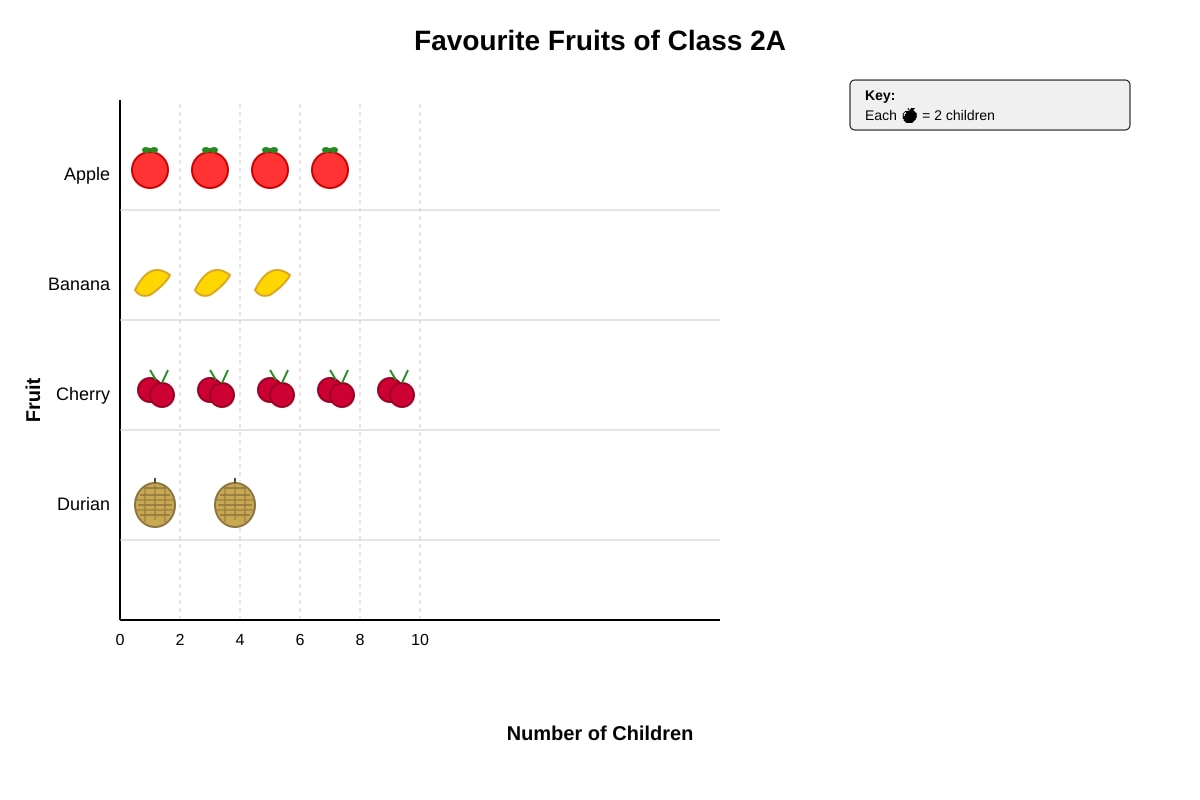
Graph Summary: The picture graph shows the favourite fruits of Class 2A. Each fruit symbol represents 2 children.
- Apple: 4 symbols → 4 × 2 = 8 children
- Banana: 3 symbols → 3 × 2 = 6 children
- Cherry: 5 symbols → 5 × 2 = 10 children
- Durian: 2 symbols → 2 × 2 = 4 children
1. How many children chose Apple as their favourite fruit? [1]
- Answer: 8 children
- Explanation: The Apple row has 4 symbols. Each symbol represents 2 children. So, 4 × 2 = 8 children chose Apple.
- Common mistake: Counting the symbols (4) instead of multiplying by the scale (2).
2. Which fruit was chosen by 6 children? [1]
- Answer: Banana
- Explanation: 6 children ÷ 2 children per symbol = 3 symbols. The Banana row has 3 symbols, so Banana was chosen by 6 children.
- Teaching note: To find the number of symbols, divide the number of children by the scale (2).
3. How many more children chose Cherry than Durian? [2]
- Answer: 6 more children
- Explanation:
- Cherry: 5 symbols × 2 = 10 children
- Durian: 2 symbols × 2 = 4 children
- Difference: 10 - 4 = 6 children
- Marking: 1 mark for correct method (finding both totals), 1 mark for correct answer.
4. How many children chose Banana and Durian altogether? [2]
- Answer: 10 children
- Explanation:
- Banana: 3 symbols × 2 = 6 children
- Durian: 2 symbols × 2 = 4 children
- Total: 6 + 4 = 10 children
- Marking: 1 mark for correct method, 1 mark for correct answer.
5. What is the total number of children in Class 2A who voted? [2]
- Answer: 28 children
- Explanation:
- Total symbols: 4 + 3 + 5 + 2 = 14 symbols
- Total children: 14 × 2 = 28 children
- Or add all totals: 8 + 6 + 10 + 4 = 28 children
- Marking: 1 mark for correct method, 1 mark for correct answer.
Section B: Interpreting Scaled Picture Graphs (Questions 6 to 10)
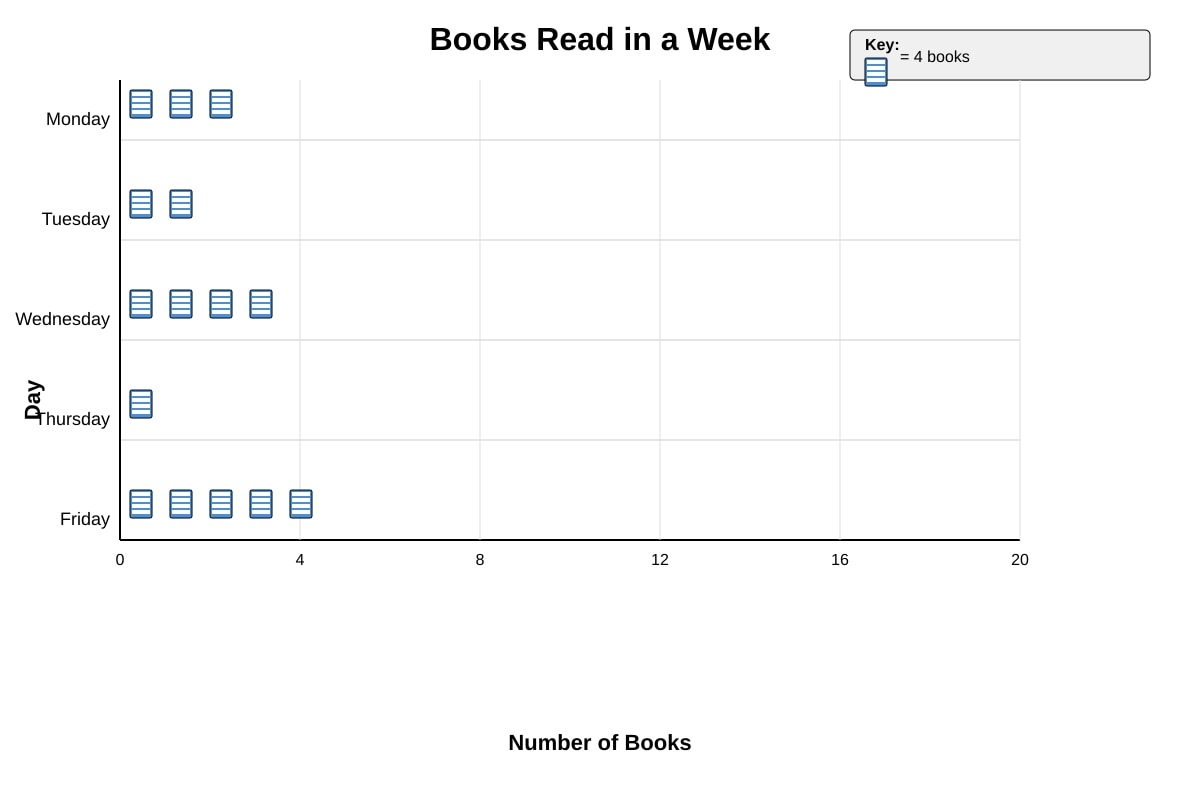
Graph Summary: The picture graph shows books read in a week. Each book symbol represents 4 books.
- Monday: 3 symbols → 3 × 4 = 12 books
- Tuesday: 2 symbols → 2 × 4 = 8 books
- Wednesday: 4 symbols → 4 × 4 = 16 books
- Thursday: 1 symbol → 1 × 4 = 4 books
- Friday: 5 symbols → 5 × 4 = 20 books
6. How many books were read on Wednesday? [1]
- Answer: 16 books
- Explanation: The Wednesday row has 4 symbols. Each symbol represents 4 books. So, 4 × 4 = 16 books.
7. On which day were 8 books read? [1]
- Answer: Tuesday
- Explanation: 8 books ÷ 4 books per symbol = 2 symbols. The Tuesday row has 2 symbols.
8. How many more books were read on Friday than on Thursday? [2]
- Answer: 16 more books
- Explanation:
- Friday: 5 symbols × 4 = 20 books
- Thursday: 1 symbol × 4 = 4 books
- Difference: 20 - 4 = 16 books
- Marking: 1 mark for correct method, 1 mark for correct answer.
9. How many books were read on Monday and Tuesday altogether? [2]
- Answer: 20 books
- Explanation:
- Monday: 3 symbols × 4 = 12 books
- Tuesday: 2 symbols × 4 = 8 books
- Total: 12 + 8 = 20 books
- Marking: 1 mark for correct method, 1 mark for correct answer.
10. What is the total number of books read from Monday to Friday? [2]
- Answer: 60 books
- Explanation:
- Total symbols: 3 + 2 + 4 + 1 + 5 = 15 symbols
- Total books: 15 × 4 = 60 books
- Or add all totals: 12 + 8 + 16 + 4 + 20 = 60 books
- Marking: 1 mark for correct method, 1 mark for correct answer.
Section C: Drawing and Completing Picture Graphs (Questions 11 to 15)
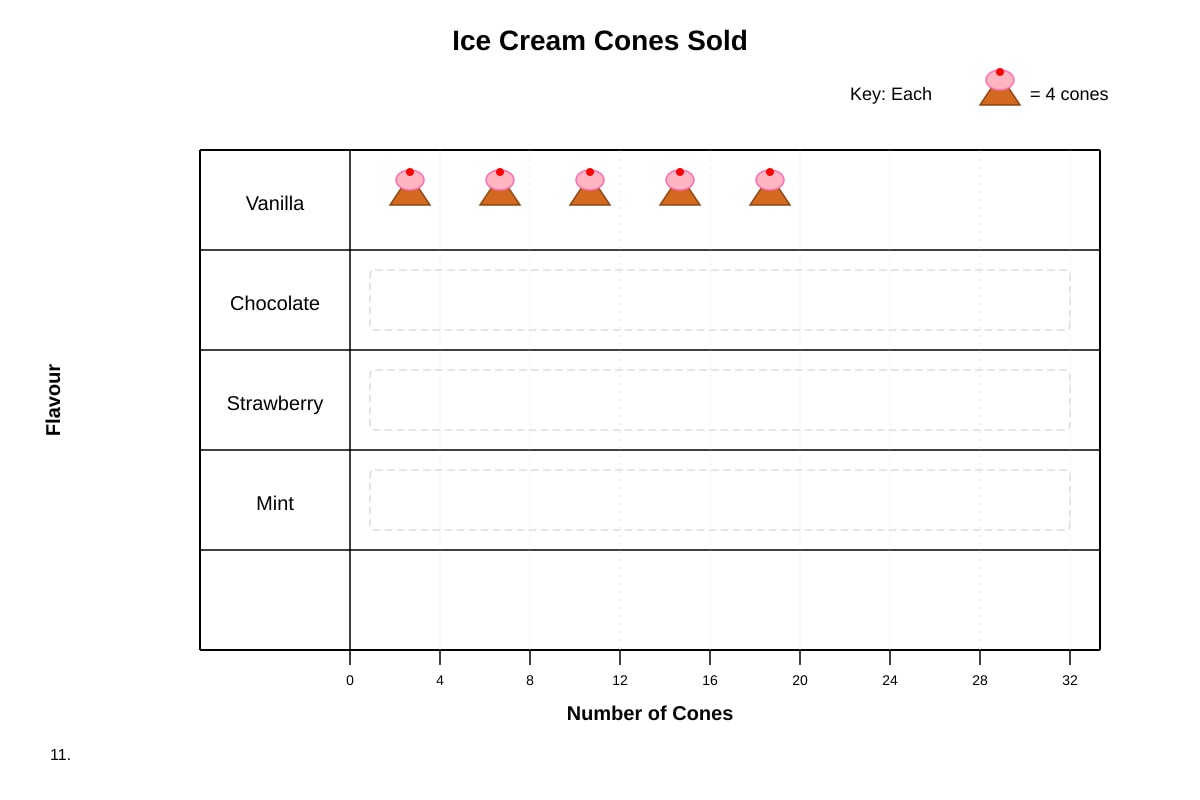
Table Data:
- Vanilla: 20 cones
- Chocolate: 12 cones
- Strawberry: 8 cones
- Mint: 16 cones
Scale: Each symbol = 4 cones
11. Draw the correct number of symbols in the picture graph below. [2]
- Answer:
- Chocolate: 12 cones ÷ 4 = 3 symbols
- Strawberry: 8 cones ÷ 4 = 2 symbols
- Mint: 16 cones ÷ 4 = 4 symbols
- Marking: 1 mark for drawing the correct number of symbols for Chocolate and Strawberry, 1 mark for drawing the correct number of symbols for Mint. Accept any clear symbol (e.g., a circle or a cone drawing).
- Common mistake: Drawing the number of cones instead of the number of symbols.
12. How many cones of Vanilla were sold? [1]
- Answer: 20 cones
- Explanation: The table shows 20 cones of Vanilla were sold.
13. Which flavour had the least number of cones sold? [1]
- Answer: Strawberry
- Explanation: Strawberry has 8 cones, which is the smallest number in the table.
14. How many more cones of Mint were sold than Strawberry? [2]
- Answer: 8 more cones
- Explanation:
- Mint: 16 cones
- Strawberry: 8 cones
- Difference: 16 - 8 = 8 cones
- Marking: 1 mark for correct method, 1 mark for correct answer.
15. How many cones of Vanilla and Chocolate were sold altogether? [2]
- Answer: 32 cones
- Explanation:
- Vanilla: 20 cones
- Chocolate: 12 cones
- Total: 20 + 12 = 32 cones
- Marking: 1 mark for correct method, 1 mark for correct answer.
Section D: Problem Solving with Picture Graphs (Questions 16 to 20)
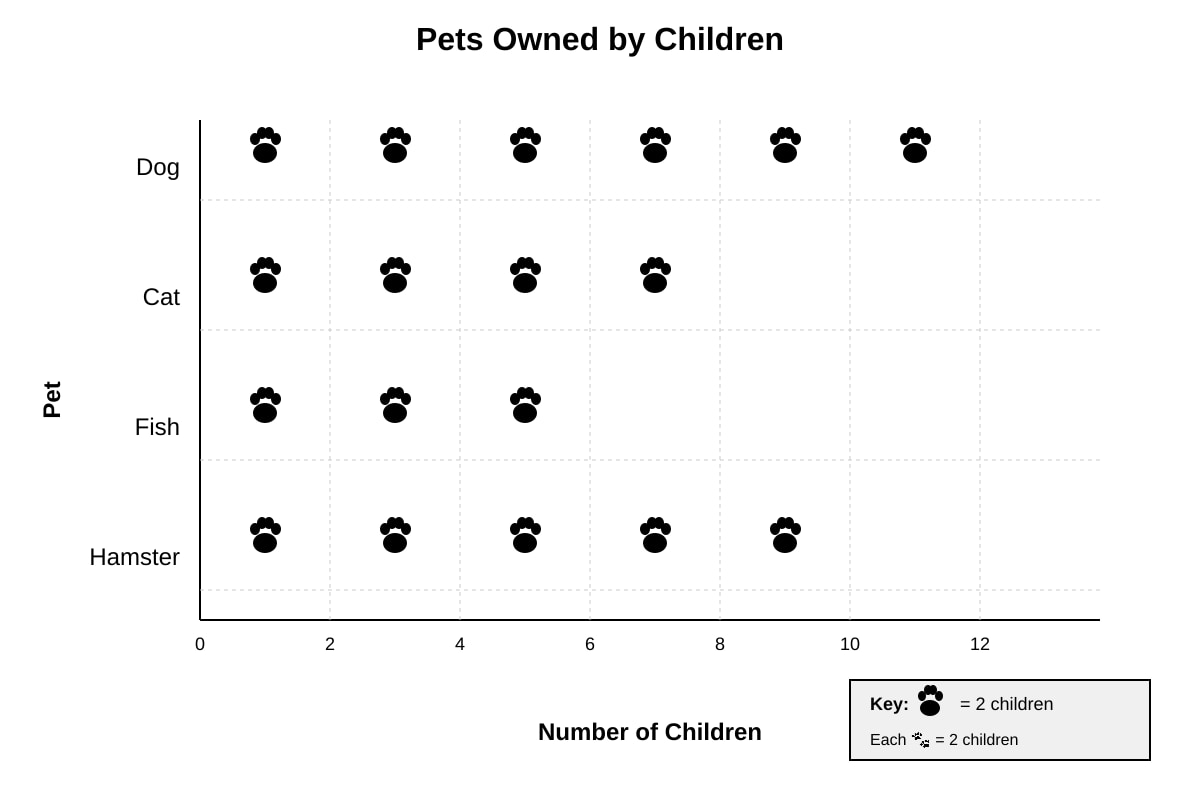
Graph Summary: The picture graph shows pets owned by children. Each paw symbol represents 2 children.
- Dog: 6 symbols → 6 × 2 = 12 children
- Cat: 4 symbols → 4 × 2 = 8 children
- Fish: 3 symbols → 3 × 2 = 6 children
- Hamster: 5 symbols → 5 × 2 = 10 children
16. How many children own a Cat? [1]
- Answer: 8 children
- Explanation: The Cat row has 4 symbols. Each symbol represents 2 children. So, 4 × 2 = 8 children.
17. How many more children own a Dog than a Fish? [2]
- Answer: 6 more children
- Explanation:
- Dog: 6 symbols × 2 = 12 children
- Fish: 3 symbols × 2 = 6 children
- Difference: 12 - 6 = 6 children
- Marking: 1 mark for correct method, 1 mark for correct answer.
18. Which two pets have a total of 16 children owning them? [2]
- Answer: Dog and Hamster
- Explanation:
- Dog: 12 children
- Hamster: 10 children
- Total: 12 + 10 = 22 children (not 16)
- Try other combinations:
- Cat (8) + Hamster (10) = 18 children (not 16)
- Dog (12) + Cat (8) = 20 children (not 16)
- Dog (12) + Fish (6) = 18 children (not 16)
- Cat (8) + Fish (6) = 14 children (not 16)
- Hamster (10) + Fish (6) = 16 children (correct!)
- So, Hamster and Fish have a total of 16 children.
- Marking: 1 mark for identifying the correct pair, 1 mark for showing the total. Accept "Hamster and Fish" or "Fish and Hamster".
- Teaching note: This question requires trial and error or systematic checking of different pairs.
19. 4 children who own a Hamster moved away. How many children now own a Hamster? [2]
- Answer: 6 children
- Explanation:
- Originally: 10 children owned a Hamster
- 4 children moved away: 10 - 4 = 6 children
- Marking: 1 mark for correct method, 1 mark for correct answer.
20. The children who own a Dog and a Cat are going to the park. How many children are going to the park? [2]
- Answer: 20 children
- Explanation:
- Dog owners: 12 children
- Cat owners: 8 children
- Total: 12 + 8 = 20 children
- Marking: 1 mark for correct method, 1 mark for correct answer.
End of Answer Key