AI Generated Quiz
Primary 1 Mathematics Picture Graphs Quiz
Free P1 Maths Picture Graphs quiz, AI version, with questions, answers, and syllabus-aligned practice for Singapore students.
These static practice materials are generated from the site's syllabus and paper-generation workflow, with source and model context shown so students and parents can evaluate the material before use.
Questions
Free quiz and exam paper access
Enter your details to view this paper
Your access is remembered on this device.
Answers
Primary 1 Mathematics Quiz - Picture Graphs - Answer Key
Total Marks: 20
Section A: Reading Picture Graphs (Questions 1 to 5)
Each question is worth 1 mark.
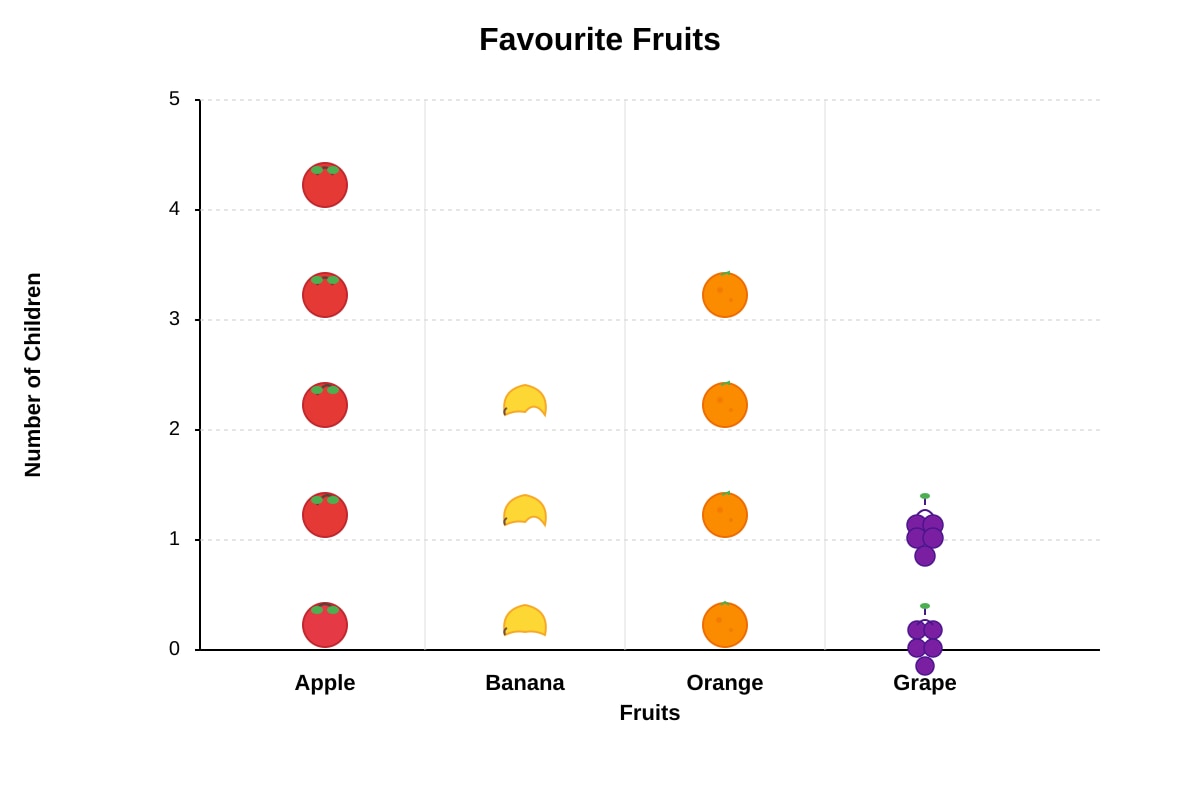
Q1. 5
- Explanation: Look at the column for Apple. Count the apple icons. There are 5 apples. So, 5 children chose Apple.
- Marking: 1 mark for correct answer.
Q2. Banana
- Explanation: Look at each column and count the fruit icons. Apple has 5, Banana has 3, Orange has 4, Grape has 2. The fruit with 3 icons is Banana.
- Marking: 1 mark for correct answer.
Q3. 2
- Explanation: Orange has 4 children. Grape has 2 children. To find "how many more", subtract: 4 - 2 = 2. So, 2 more children chose Orange than Grape.
- Marking: 1 mark for correct answer.
- Common Mistake: Students may add instead of subtract. Remind them that "how many more" means find the difference.
Q4. Grape
- Explanation: Look for the column with the fewest fruit icons. Apple has 5, Banana has 3, Orange has 4, Grape has 2. Grape has the fewest (2).
- Marking: 1 mark for correct answer.
Q5. 5
- Explanation: Banana has 3 children. Grape has 2 children. "Altogether" means add: 3 + 2 = 5. So, 5 children chose Banana and Grape altogether.
- Marking: 1 mark for correct answer.
Section B: Completing Picture Graphs (Questions 6 to 10)
Each question is worth 1 mark.
Q6. 6
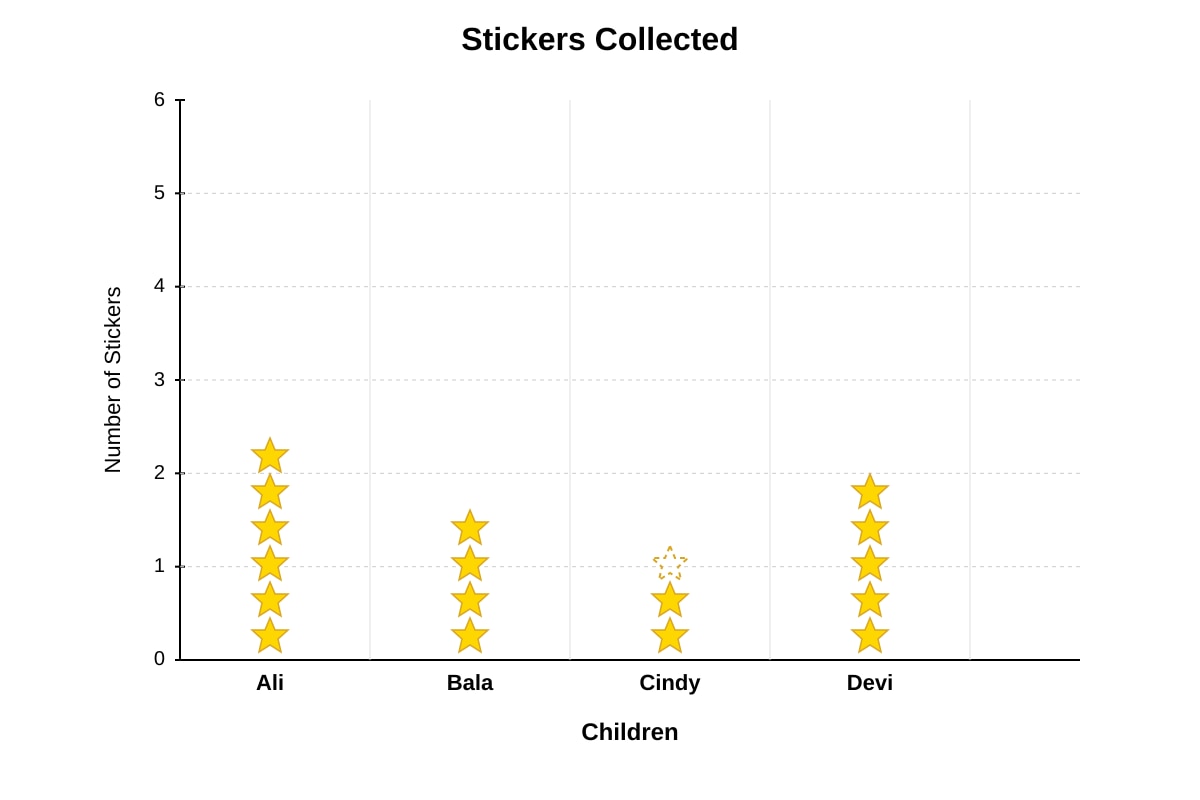
- Explanation: Look at Ali's column. Count the star icons. There are 6 stars. So, Ali has 6 stickers.
- Marking: 1 mark for correct answer.
Q7. Devi
- Explanation: Look at each child's column and count the stars. Ali has 6, Bala has 4, Cindy has 3, Devi has 5. The child with 5 stars is Devi.
- Marking: 1 mark for correct answer.
Q8. 3
- Explanation: Cindy has 3 stickers. The graph shows 2 solid stars and 1 dashed outline star. The dashed outline star means one sticker is missing. To show 3 stickers correctly, we need to draw 3 solid stars. So, we need to draw 1 more star to make it 3.
- Marking: 1 mark for correct answer.
- Teaching Note: Explain that a picture graph must have the correct number of pictures to match the data.
Q9. 9
- Explanation: Bala has 4 stickers. Devi has 5 stickers. "Altogether" means add: 4 + 5 = 9. So, Bala and Devi have 9 stickers altogether.
- Marking: 1 mark for correct answer.
Q10. 2
- Explanation: Ali has 6 stickers. Bala has 4 stickers. "How many more" means find the difference: 6 - 4 = 2. So, Ali has 2 more stickers than Bala.
- Marking: 1 mark for correct answer.
Section C: Interpreting Picture Graphs (Questions 11 to 15)
Each question is worth 1 mark.
Q11. 7
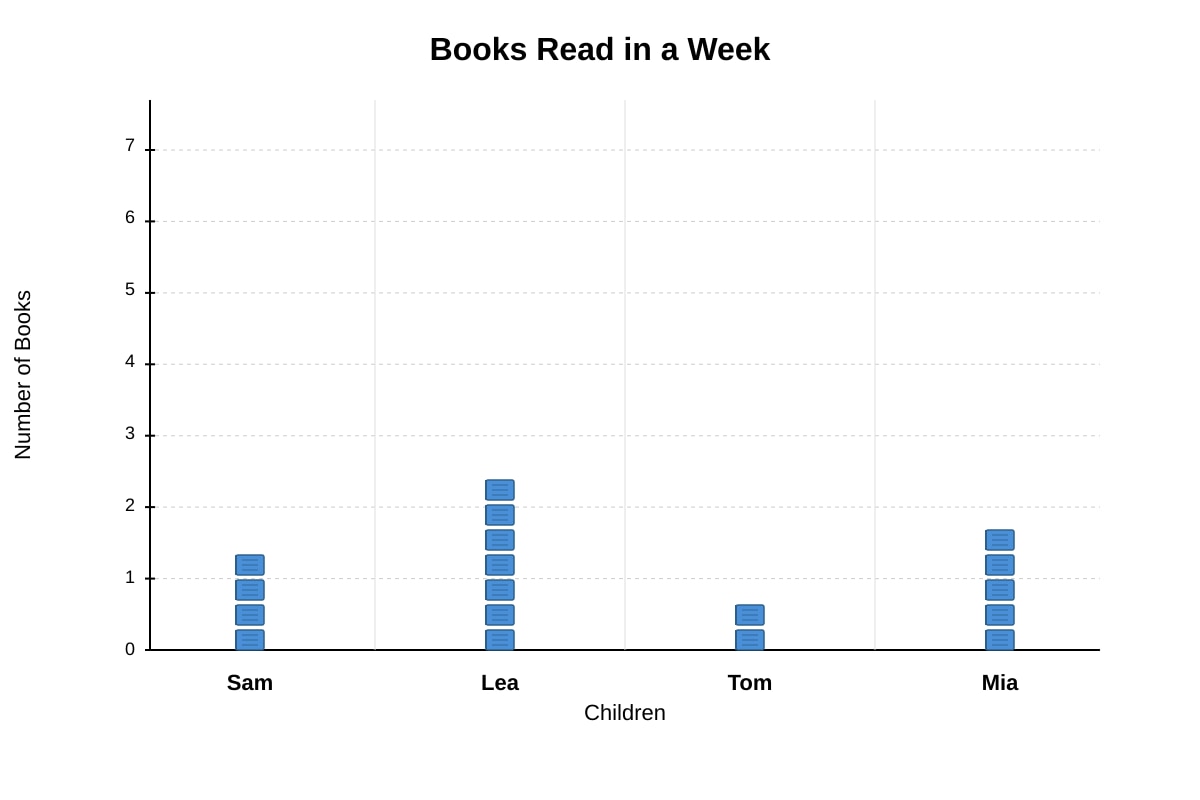
- Explanation: Look at Lea's column. Count the book icons. There are 7 books. So, Lea read 7 books.
- Marking: 1 mark for correct answer.
Q12. Lea
- Explanation: Look at each child's column and count the books. Sam has 4, Lea has 7, Tom has 2, Mia has 5. The child with the most books is Lea (7 books).
- Marking: 1 mark for correct answer.
Q13. 6
- Explanation: Sam read 4 books. Tom read 2 books. "Altogether" means add: 4 + 2 = 6. So, Sam and Tom read 6 books altogether.
- Marking: 1 mark for correct answer.
Q14. 3
- Explanation: Tom read 2 books. Mia read 5 books. "How many fewer" means find the difference: 5 - 2 = 3. So, Tom read 3 fewer books than Mia.
- Marking: 1 mark for correct answer.
- Common Mistake: Students may subtract the wrong way. Remind them that "fewer than" means the smaller number is compared to the larger number.
Q15. 3
- Explanation: Lea read 7 books. Sam read 4 books. "How many more" means find the difference: 7 - 4 = 3. So, Lea read 3 more books than Sam.
- Marking: 1 mark for correct answer.
Section D: Creating and Using Picture Graphs (Questions 16 to 20)
Each question is worth 1 mark.
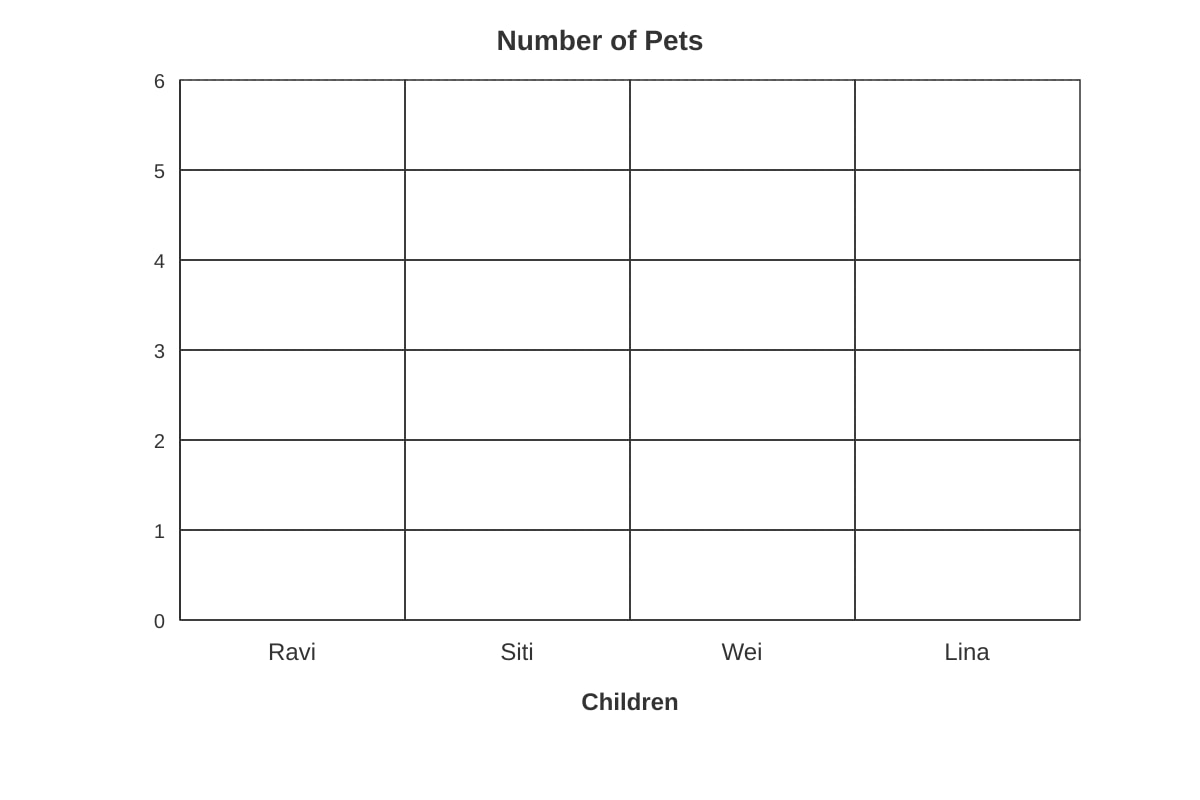
Q16. The student should draw circles in the grid to represent the number of pets each child has.
-
Ravi: 4 circles
-
Siti: 2 circles
-
Wei: 6 circles
-
Lina: 3 circles
-
Explanation: The table shows the number of pets. We use one circle to show 1 pet. So, for Ravi (4 pets), we draw 4 circles in his column. For Siti (2 pets), we draw 2 circles. For Wei (6 pets), we draw 6 circles. For Lina (3 pets), we draw 3 circles.
-
Marking: 1 mark for drawing the correct number of circles for all 4 children. Accept if the circles are drawn neatly in the correct columns.
Q17. 6
- Explanation: Look at the table. Wei has 6 pets.
- Marking: 1 mark for correct answer.
Q18. Siti
- Explanation: Look at the table. Ravi has 4, Siti has 2, Wei has 6, Lina has 3. The child with the fewest pets is Siti (2 pets).
- Marking: 1 mark for correct answer.
Q19. 7
- Explanation: Ravi has 4 pets. Lina has 3 pets. "Altogether" means add: 4 + 3 = 7. So, Ravi and Lina have 7 pets altogether.
- Marking: 1 mark for correct answer.
Q20. 4
- Explanation: Wei has 6 pets. Siti has 2 pets. "How many more" means find the difference: 6 - 2 = 4. So, Wei has 4 more pets than Siti.
- Marking: 1 mark for correct answer.
End of Answer Key