AI Generated Quiz
Primary 1 Mathematics Picture Graphs Quiz
Free P1 Maths Picture Graphs quiz, AI version, with questions, answers, and syllabus-aligned practice for Singapore students.
These static practice materials are generated from the site's syllabus and paper-generation workflow, with source and model context shown so students and parents can evaluate the material before use.
Questions
Free quiz and exam paper access
Enter your details to view this paper
Your access is remembered on this device.
Answers
Primary 1 Mathematics Quiz - Picture Graphs: Answer Key
Total Marks: 20
Section A: Reading Picture Graphs (Questions 1 to 10)
Each question carries 1 mark.
Question 1
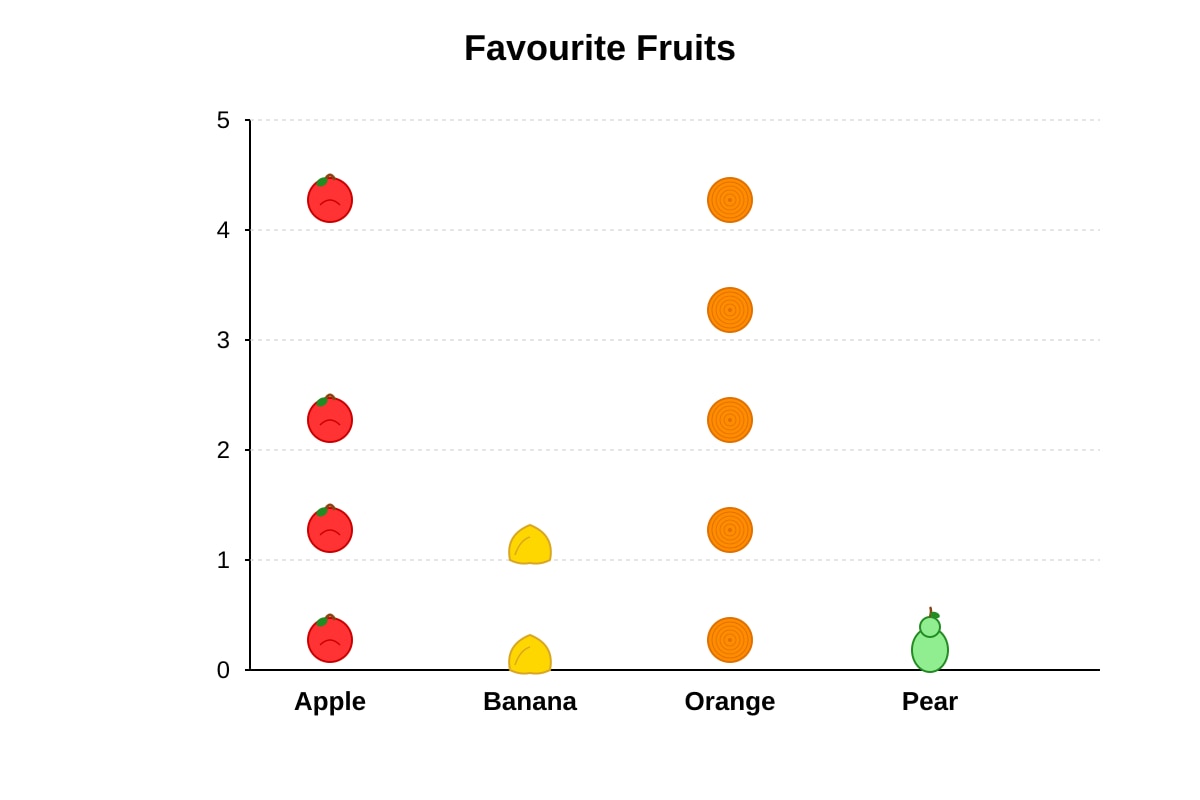
Answer: 4 Explanation: Look at the picture graph titled "Favourite Fruits". Find the row labelled "Apple". Count the number of apple pictures in that row. There are 4 apples drawn. So, 4 children chose Apple. Marking Notes: Award 1 mark for the correct number.
Question 2
Answer: Banana Explanation: Look at the picture graph. Find the row that has 2 fruit pictures. The row labelled "Banana" has 2 bananas drawn. So, 2 children chose Banana. Marking Notes: Award 1 mark for the correct fruit name.
Question 3
Answer: 4 Explanation: First, find how many children chose Orange. The Orange row has 5 oranges. Next, find how many children chose Pear. The Pear row has 1 pear. To find how many more, subtract: 5 - 1 = 4. So, 4 more children chose Orange than Pear. Marking Notes: Award 1 mark for the correct answer. Accept working shown.
Question 4
Answer: 3 Explanation: Find the number of children who chose Banana (2) and the number who chose Pear (1). To find the total, add: 2 + 1 = 3. So, 3 children chose Banana and Pear altogether. Marking Notes: Award 1 mark for the correct answer.
Question 5
Answer: Orange Explanation: The most popular fruit is the one with the most pictures. Compare the rows: Apple (4), Banana (2), Orange (5), Pear (1). Orange has the most pictures (5). So, Orange is the most popular. Marking Notes: Award 1 mark for the correct fruit name.
Question 6
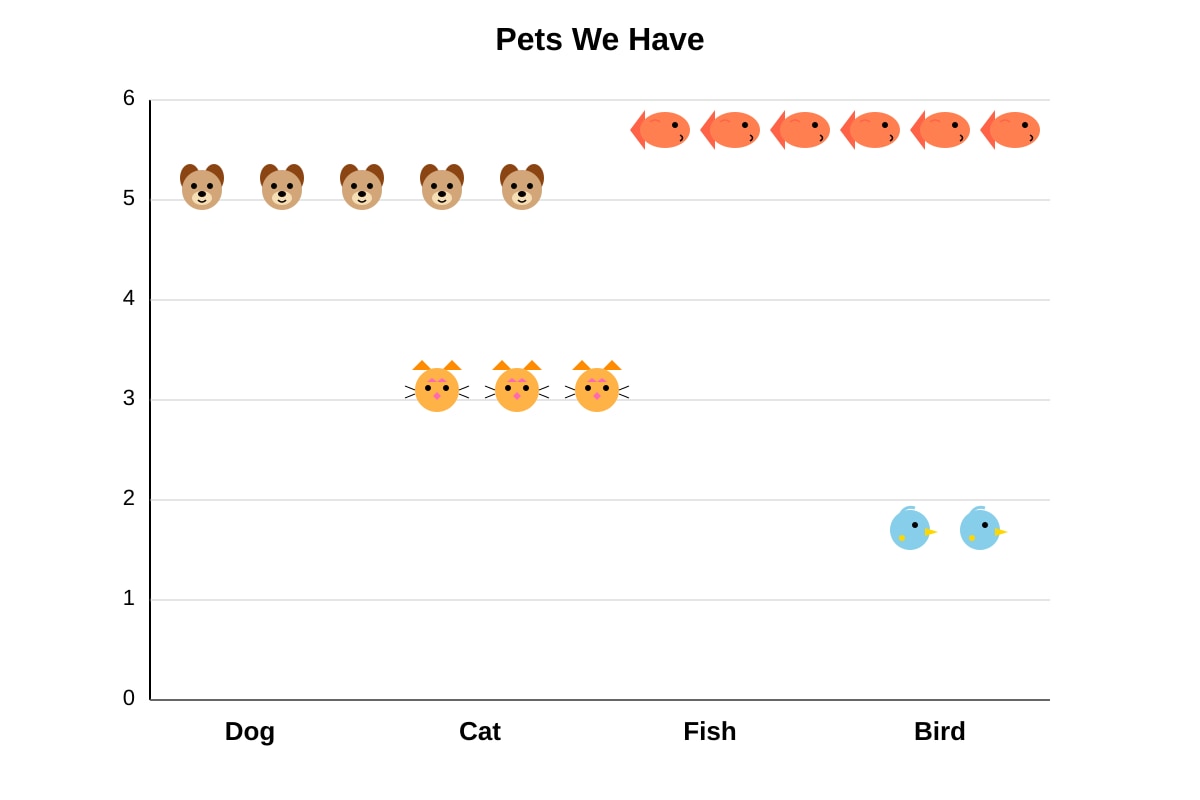
Answer: 6 Explanation: Look at the picture graph titled "Pets We Have". Find the row labelled "Fish". Count the number of fish face pictures. There are 6 fish faces drawn. So, 6 children have a fish. Marking Notes: Award 1 mark for the correct number.
Question 7
Answer: Cat Explanation: Look at the picture graph. Find the row that has 3 animal face pictures. The row labelled "Cat" has 3 cat faces drawn. So, 3 children have a cat. Marking Notes: Award 1 mark for the correct pet name.
Question 8
Answer: 3 Explanation: First, find how many children have a bird. The Bird row has 2 bird faces. Next, find how many children have a dog. The Dog row has 5 dog faces. To find how many fewer, subtract: 5 - 2 = 3. So, 3 fewer children have a bird than a dog. Marking Notes: Award 1 mark for the correct answer.
Question 9
Answer: 5 Explanation: Find the number of children who have a cat (3) and the number who have a bird (2). To find the total, add: 3 + 2 = 5. So, 5 children have a cat or a bird. Marking Notes: Award 1 mark for the correct answer.
Question 10
Answer: Bird Explanation: The least popular pet is the one with the fewest pictures. Compare the rows: Dog (5), Cat (3), Fish (6), Bird (2). Bird has the fewest pictures (2). So, Bird is the least popular. Marking Notes: Award 1 mark for the correct pet name.
Section B: Interpreting Picture Graphs (Questions 11 to 15)
Each question carries 2 marks.
Question 11
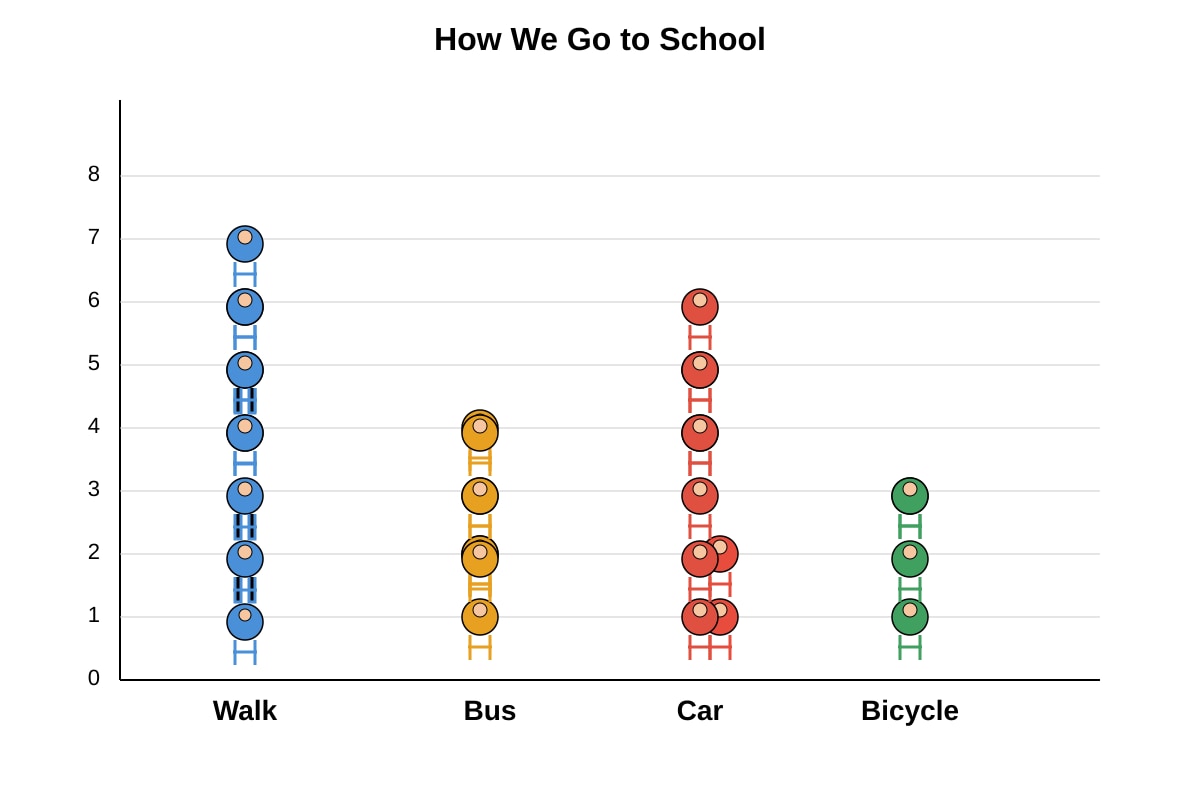
Answer: 7 Explanation: Look at the picture graph titled "How We Go to School". Find the row labelled "Walk". Count the number of child icons. There are 7 child icons drawn. So, 7 children walk to school. Marking Notes: Award 2 marks for the correct answer. Award 1 mark for a correct method but incorrect count.
Question 12
Answer: 2 Explanation: First, find how many children take the car. The Car row has 6 child icons. Next, find how many children take the bus. The Bus row has 4 child icons. To find how many more, subtract: 6 - 4 = 2. So, 2 more children take the car than the bus. Marking Notes: Award 2 marks for the correct answer with correct working. Award 1 mark for correct method but calculation error.
Question 13
Answer: 7 Explanation: Find the number of children who take the bus (4) and the number who take the bicycle (3). To find the total, add: 4 + 3 = 7. So, 7 children take the bus or the bicycle. Marking Notes: Award 2 marks for the correct answer with correct working. Award 1 mark for correct method but calculation error.
Question 14
Answer: 20 Explanation: Add the number of children for each mode of transport: Walk (7) + Bus (4) + Car (6) + Bicycle (3) = 20. So, there are 20 children altogether. Marking Notes: Award 2 marks for the correct answer with correct working. Award 1 mark for correct method but calculation error.
Question 15
Answer: 7 Explanation: First, find how many children currently take the bus (4). Then, add the 3 new children: 4 + 3 = 7. So, 7 children now take the bus. Marking Notes: Award 2 marks for the correct answer with correct working. Award 1 mark for correct method but calculation error.
Section C: Making Picture Graphs (Questions 16 to 20)
Each question carries 2 marks.
Question 16
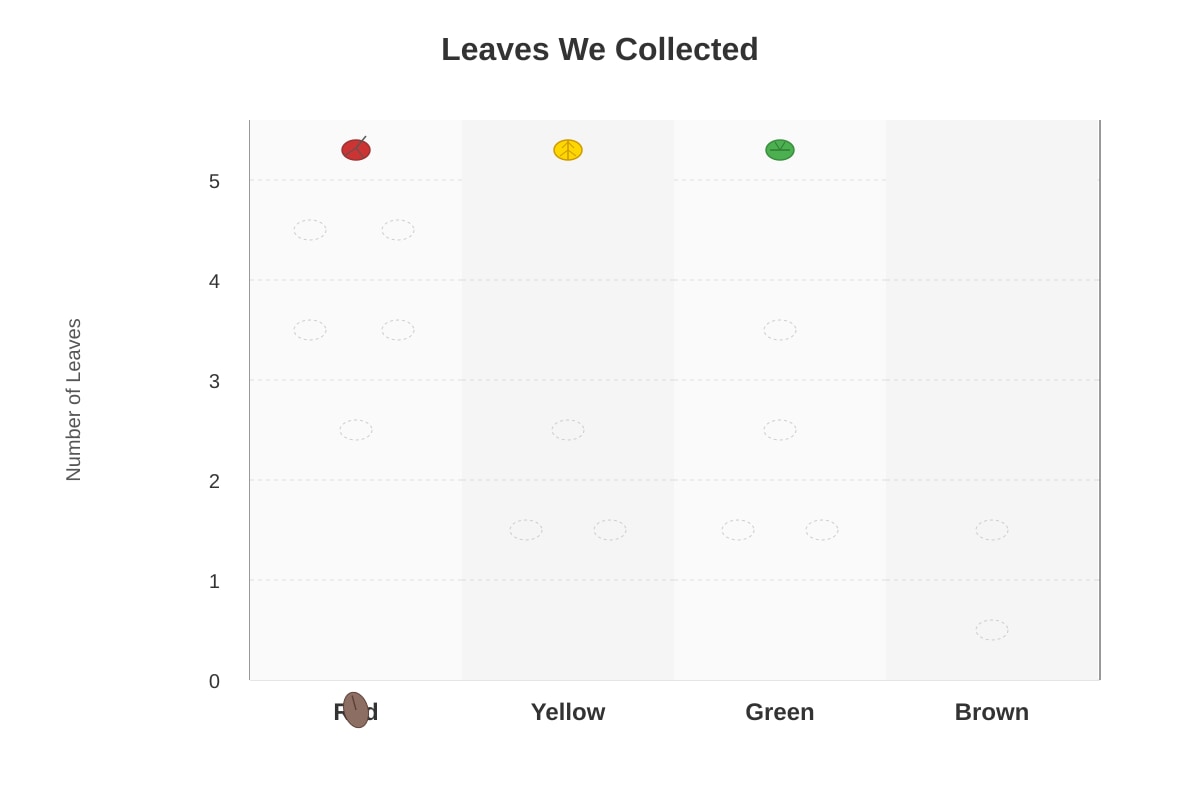
Answer: A correctly drawn picture graph with:
- Title: "Leaves We Collected"
- Red row: 5 leaf pictures
- Yellow row: 3 leaf pictures
- Green row: 4 leaf pictures
- Brown row: 2 leaf pictures
- Scale from 0 to 5 on the y-axis Explanation: The student should draw a simple leaf picture (e.g., a small oval with a stem) for each leaf in the correct row. The number of leaf pictures in each row must match the data given. Marking Notes: Award 2 marks for a completely correct graph with all rows drawn correctly. Award 1 mark if most rows are correct but there is a minor error (e.g., one row has the wrong number of leaves, or the title is missing).
Question 17
Answer: 14 Explanation: Add the number of leaves of each colour: Red (5) + Yellow (3) + Green (4) + Brown (2) = 14. So, there are 14 leaves in total. Marking Notes: Award 2 marks for the correct answer with correct working. Award 1 mark for correct method but calculation error.
Question 18
Answer: 3 Explanation: First, find the number of red leaves (5). Next, find the number of brown leaves (2). To find how many more, subtract: 5 - 2 = 3. So, there are 3 more red leaves than brown leaves. Marking Notes: Award 2 marks for the correct answer with correct working. Award 1 mark for correct method but calculation error.
Question 19
Answer: 7 Explanation: Find the number of yellow leaves (3) and the number of green leaves (4). To find the total, add: 3 + 4 = 7. So, there are 7 yellow and green leaves altogether. Marking Notes: Award 2 marks for the correct answer with correct working. Award 1 mark for correct method but calculation error.
Question 20
Answer: 5 Explanation: First, find the number of yellow leaves the class had (3). Then, add the 2 new yellow leaves: 3 + 2 = 5. So, there are now 5 yellow leaves. Marking Notes: Award 2 marks for the correct answer with correct working. Award 1 mark for correct method but calculation error.
Common Mistakes to Note:
- Students may miscount the pictures in a row. Encourage them to point to each picture as they count.
- Students may confuse "more than" with "altogether". Remind them that "more than" means subtract, and "altogether" means add.
- When drawing picture graphs, students may forget the title or labels. Remind them to include all parts of the graph.