AI Generated Quiz
O Level Geography Physical Geography Quiz
Free O Level Geography Physical Geography quiz, HY3 AI version, with questions, answers, and O Level-style practice for Singapore students.
These static practice materials are generated from the site's syllabus and paper-generation workflow, with source and model context shown so students and parents can evaluate the material before use.
Questions
Free quiz and exam paper access
Enter your details to view this paper
Your access is remembered on this device.
Answers
O-Level Geography Quiz - Answer Key (Physical Geography)
Topic: Physical Geography
Level: O-Level
Version: 1 of 5 (syllabus-first practice; not past-year derived)
Section A Answers
Q1 [2 marks]
- Weather is the short-term atmospheric condition (e.g., daily rainfall, temperature) at a place.
- Climate is the long-term average weather pattern (usually over 30 years) for a region.
(1 mark each point)
Teaching note: Students often confuse the time scale; emphasise “weather = day to day, climate = long term average”.
Q2 [1 mark]
Atmospheric circulation (or global atmospheric circulation / convection cells).
Accept: convection, wind systems transferring heat.
Q3 [2 marks]
- Sea has high heat capacity, absorbing heat slowly in day and releasing at night, moderating temperature.
- This reduces daily and annual temperature range compared to inland areas.
(1 mark for sea moderating effect, 1 mark for lower range outcome)
Q4 [1 mark]
Carbon dioxide (CO₂) / Methane (CH₄) / Nitrous oxide (N₂O).
Any one correct GHG from human activity.
Q5 [3 marks]
From diagram:
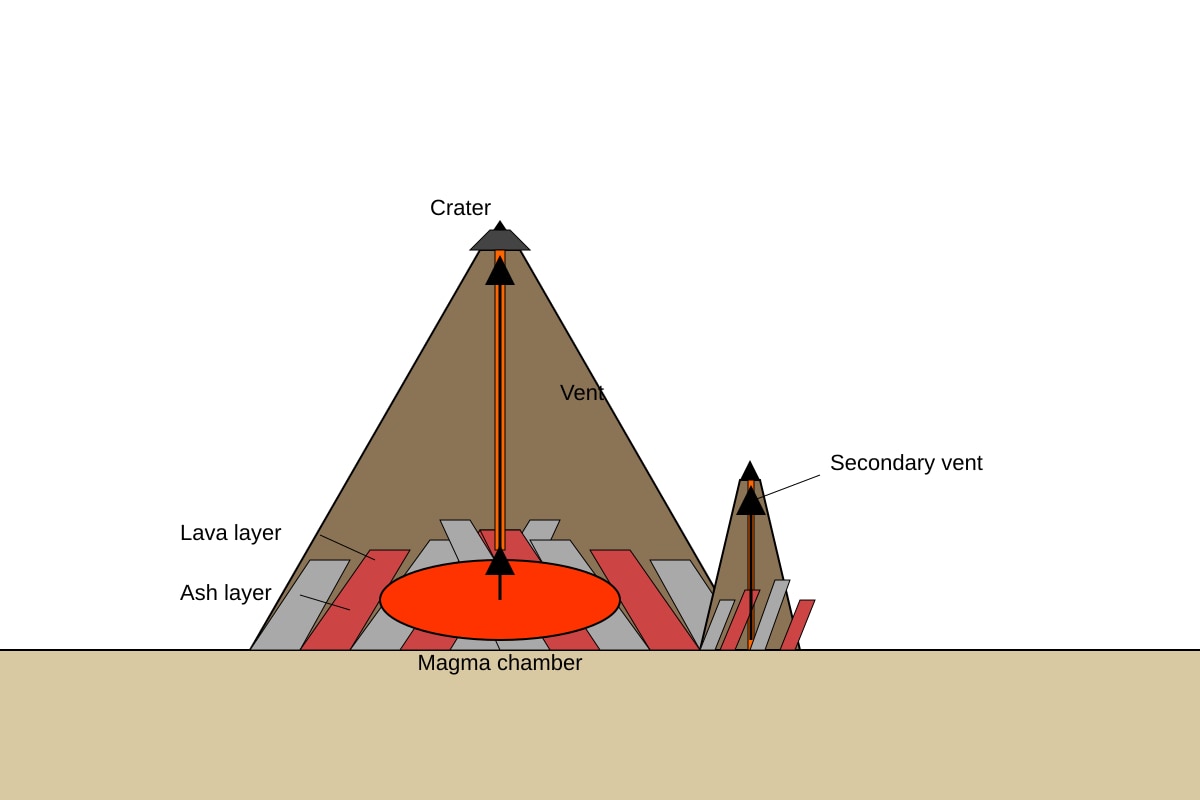
- Composite volcano has steep sides formed by alternating layers of ash and lava (1 mark).
- It has a central vent connecting magma chamber to crater; may have secondary vent (1 mark).
- Explosive eruptions due to viscous lava (1 mark if inferred from layers).
Marking: 2 features described = 2 marks; third for process link.
Q6 [2 marks]
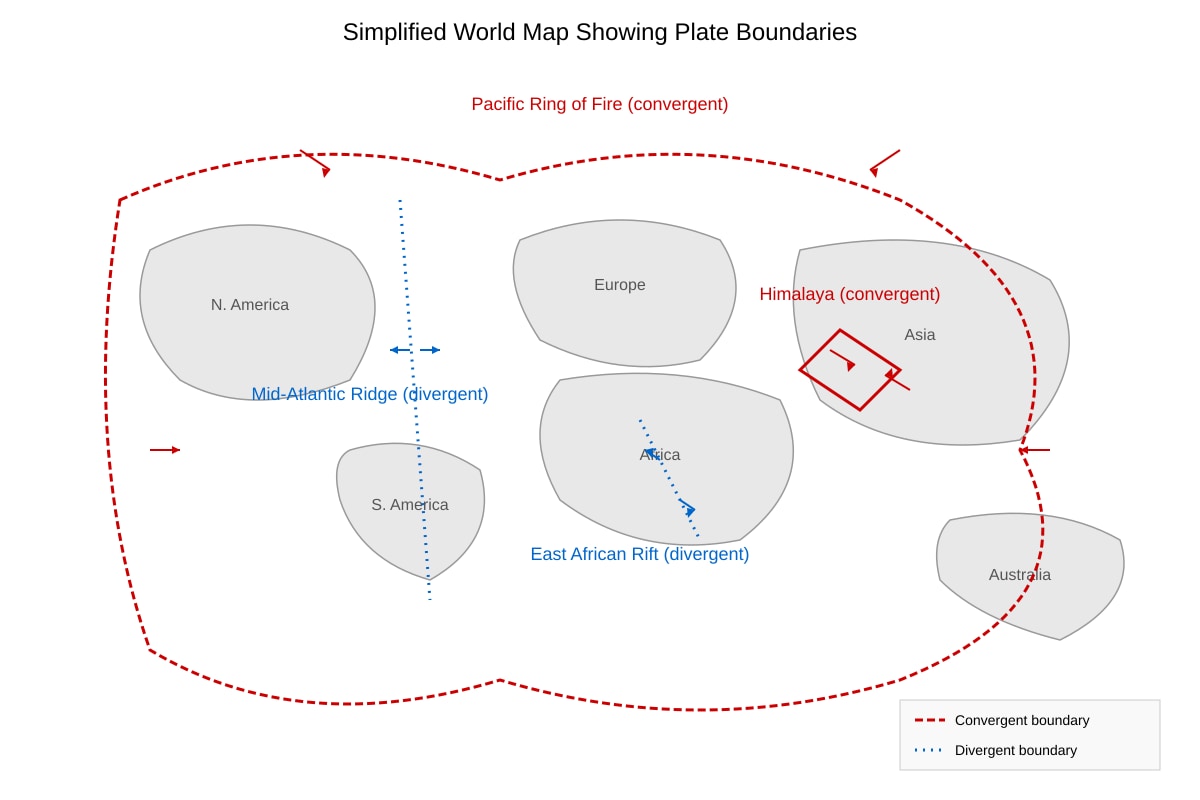
- At constructive boundary, plates move apart (1 mark).
- Magma rises to fill gap, cools and solidifies forming new crust (1 mark).
Example: Mid-Atlantic Ridge.
Q7 [1 mark]
Loss of tourism income / destruction of farms / cost of rebuilding / job loss.
Any one economic impact.
Section B Answers
Q8 [2 marks]
- Use a bar chart with three bars (A, B, C) on x-axis and wind speed (km/h) on y-axis (1 mark).
- Or overlay line graph if repeated measures; label legend clearly (1 mark).
Teaching: One combined graph, not three separate.
Q9 [3 marks]
- Annual range = highest mean – lowest mean = 21.0 (Jul) – 4.0 (Jan) = 17.0 °C (1 mark for calc, 1 mark for value).
- Shows temperate city has large seasonal temperature variation, unlike Singapore’s narrow range (~1°C) (1 mark).
Working: 21.0 − 4.0 = 17.0 °C.
Q10 [2 marks]
- Convergent boundary: Pacific Ring of Fire / Himalaya (1 mark).
- Creates volcanic arcs / fold mountains (1 mark).
Q11 [4 marks]
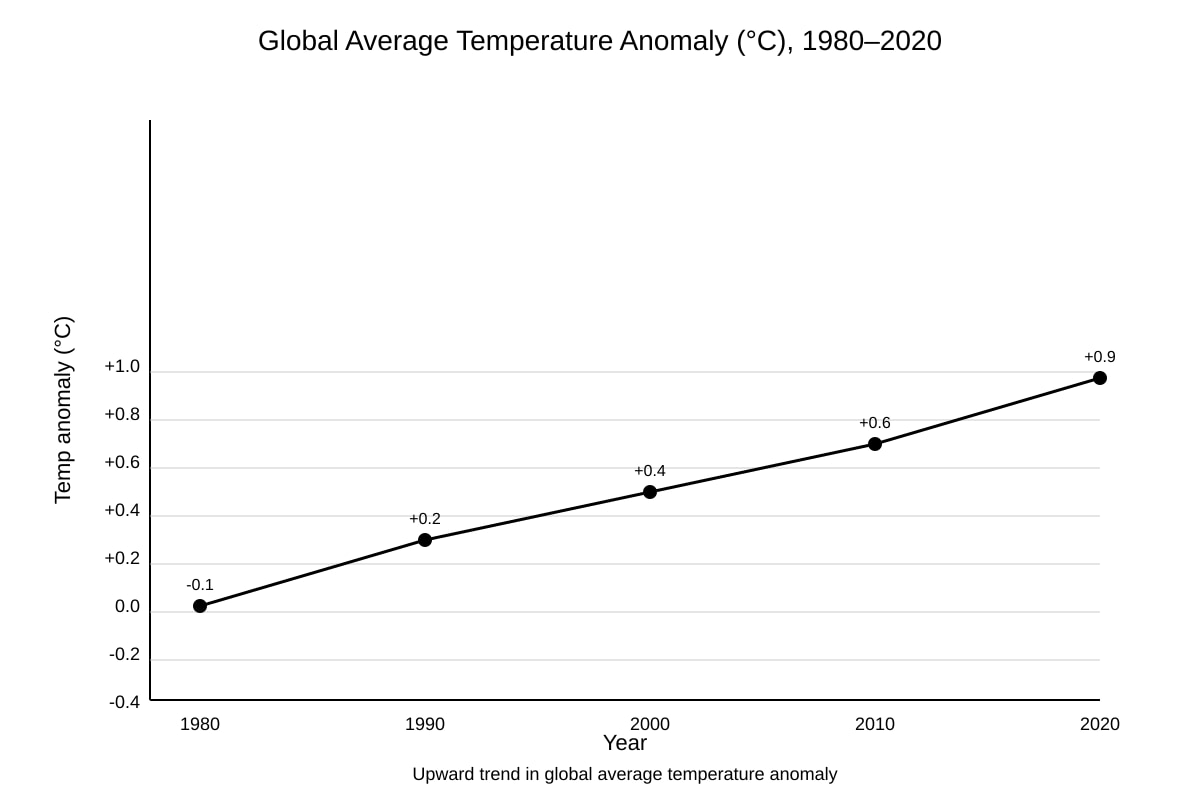
- Trend: global temp anomaly rises from −0.1 °C (1980) to +0.9 °C (2020), clear warming (2 marks for description).
- Human cause: burning fossil fuels increasing CO₂, enhancing greenhouse effect (2 marks).
Marking descriptors: trend 2m, cause 2m.
Q12 [2 marks]
- Increase sample size (e.g., 30 pebbles per site) (1 mark).
- Use calliper for precision / repeat measurements (1 mark).
Improves reliability by reducing random error.
Q13 [3 marks]
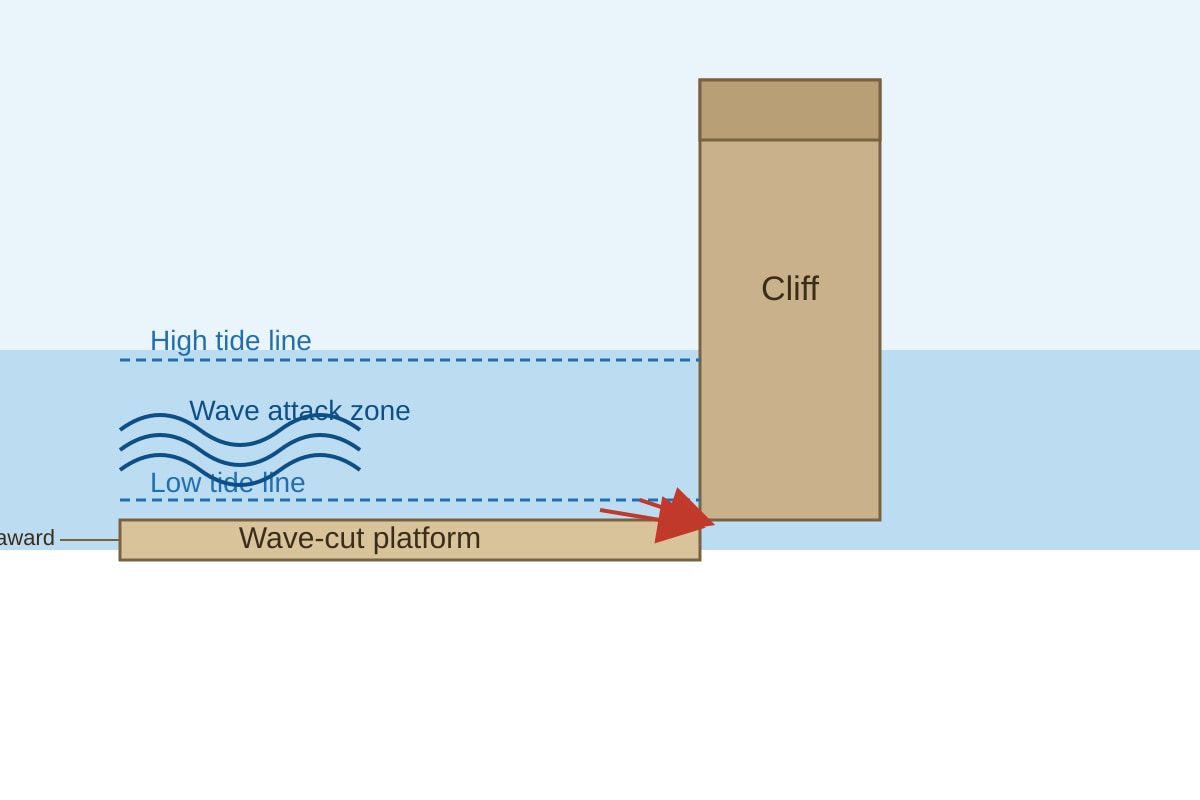
- Waves attack base of cliff at high tide line, eroding via hydraulic action (1 mark).
- Undercutting forms wave-cut notch, cliff retreats (1 mark).
- Exposed platform left at low tide as wave-cut platform (1 mark).
Ref to diagram required.
Q14 [2 marks]
- Bar chart with 4 bars for locations, y-axis average rainfall (mm) (1 mark).
- Or grouped line graph if over time; clear labels (1 mark).
Section C Answers
Q15 [4 marks]
- Human activities (deforestation, fossil fuels) increase GHGs like CO₂ (1m).
- GHGs trap outgoing infrared radiation, enhancing natural greenhouse effect (1m).
- More heat retained → global temperatures rise (1m).
- Leads to climate change: ice melt, sea level rise, weather shifts (1m).
Structure: cause → mechanism → impact.
Q16 [5 marks]
- Strength: systematic sampling every 10 m reduces bias, covers transect (1m).
- Strength: 15 pebbles/site adequate for basic trend (1m).
- Weakness: 80 m too short to show full gradient (1m).
- Weakness: ruler less precise than calliper; only one beach limits generalisation (1m).
- Conclusion: partially effective; improve length & multiple sites (1m).
AO3 evaluation expected.
Q17 [4 marks]
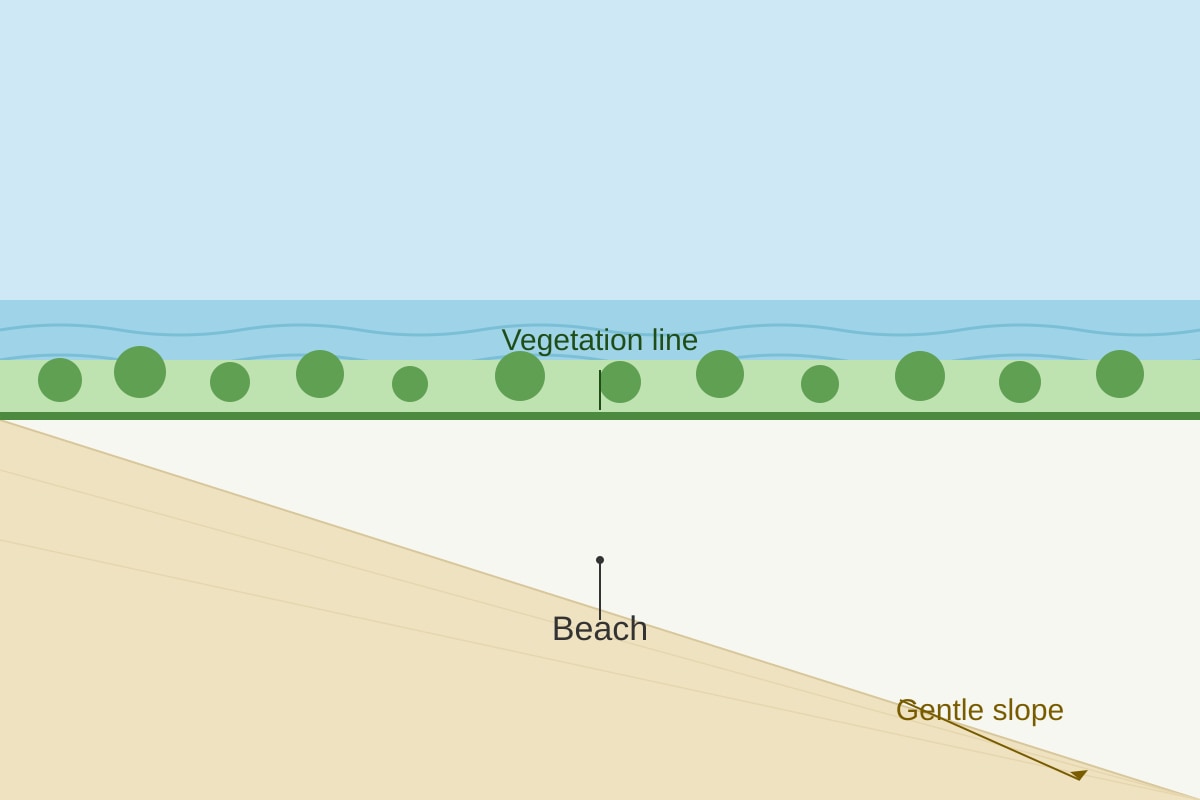
- Describe: flat/gentle slope sandy beach, vegetation at back, no cliff (2m).
- Formation: deposition of sand by waves in low-energy environment; vegetation stabilises (2m).
Must refer to photo features.
Q18 [6 marks]
- Destructive margin: oceanic plate subducts under continental (1m).
- Friction causes stress release → earthquakes (1m).
- Subducted plate melts, magma rises → volcanoes (1m).
- Example: Pacific Ring of Fire / Japan (1m).
- Link both hazards to same process (2m for synthesis).
Marking: process 3m, example 1m, synthesis 2m.
Q19 [4 marks]
- Advantage: GIS overlays historical shorelines to show erosion rate accurately (2m).
- Limitation: needs high-quality data and trained users; costly (2m).
Balance required.
Q20 [6 marks]
- Agree: sea level rise floods low islands, freshwater lens salinised (2m evidence).
- Other threats: storms, economic reliance (1m).
- Disagree extent: local governance, adaptation can reduce risk (2m).
- Judgement: serious but not sole threat; combined action needed (1m).
AO3: balanced + reasoned conclusion.