AI Generated Quiz
O Level Geography Fieldwork Quiz
Free O Level Geography Fieldwork quiz, HY3 AI version, with questions, answers, and O Level-style practice for Singapore students.
These static practice materials are generated from the site's syllabus and paper-generation workflow, with source and model context shown so students and parents can evaluate the material before use.
Questions
O-Level Geography Quiz - Fieldwork
Name: ___________________________
Class: ___________________________
Date: ___________________________
Score: _______ / 40
Duration: 50 minutes
Total Marks: 40
Instructions:
- This quiz tests your understanding of geographical fieldwork methods from the O-Level syllabus (2279), Topic 1.3 Geographical Methods (Fieldwork).
- Answer all 20 questions.
- Section A: Short answers (1–8). Section B: Data and methods (9–14). Section C: Evaluation and extended response (15–20).
- Use clear geographical terms. Show working where calculations are needed.
Section A: Fieldwork Foundations (Questions 1–8)
1. [2 marks] State one difference between a hypothesis and a research question in geographical fieldwork.
2. [1 mark] Give one example of a primary data collection method used in fieldwork.
3. [2 marks] Explain why a pilot study is carried out before the main fieldwork data collection.
4. [1 mark] What does the term "stratified sampling" mean in fieldwork?
5. [2 marks] A student counts the number of pedestrians at a park at 8 am, 12 pm, and 5 pm. Identify the type of sampling used and give one limitation of this method.
6. [2 marks] Describe one way a bar chart can be used to present fieldwork data on tourist visitor numbers at four attractions.
7. [1 mark] State one reason why a line graph is more suitable than a pie chart for showing rainfall over 12 months.
8. [3 marks] The table below shows survey responses on park cleanliness (20 people). Calculate the net satisfaction score using: Strongly Agree = +2, Agree = +1, Disagree = –1, Strongly Disagree = –2.
| Response | Frequency |
|---|---|
| Strongly Agree | 8 |
| Agree | 6 |
| Disagree | 4 |
| Strongly Disagree | 2 |
Net score = ___________
Show working: ___________________________________________________
Section B: Data Collection and Presentation (Questions 9–14)
9. [3 marks] Students measured wind speed (km/h) at three locations: East Coast (12), Jurong (9), Woodlands (7). Suggest how these could be shown on one graph. Include the graph type and labelling requirements.
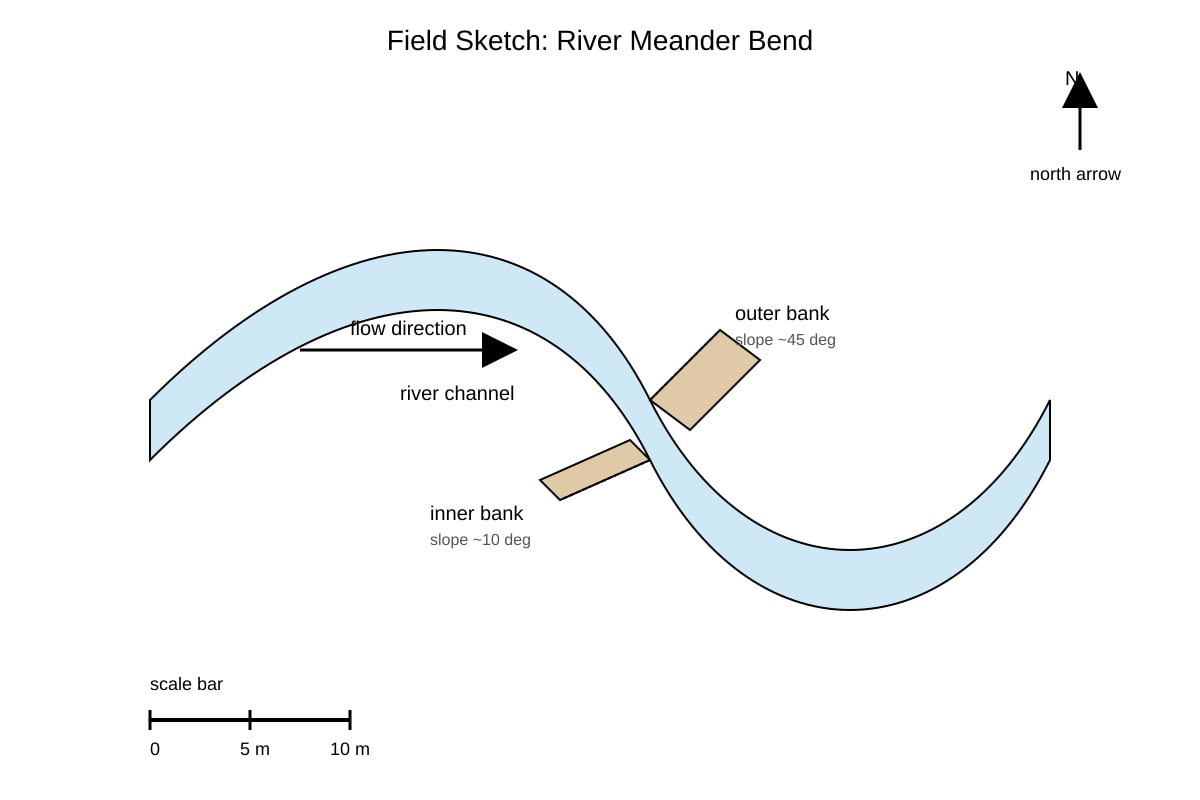
10. [2 marks] Study the field sketch below described by students: a river bend with outer bank steeper than inner bank. State two labels that must be added to make the sketch a useful fieldwork record.
Image pending generation: diagram for Q10.
11. [3 marks] A class used a Likert scale (1 = poor, 5 = excellent) to rate bus stop shelter quality at 10 stops. Their scores: 2,3,4,3,5,2,4,3,4,3. Calculate the mean score. Show your working.
Mean = ___________
Working: ___________________________________________________
12. [2 marks] Explain one advantage of using a GIS map over a paper map when presenting fieldwork on urban heat islands.
13. [3 marks] The students collected the average temperature at four fieldwork stations. Suggest how the average temperature at the four locations could be shown on one graph.
14. [4 marks] Evaluate whether the following data collection is reliable: "A student counted cyclists passing a park entrance for 10 minutes at 7 am on a weekday and concluded cycling usage is low."
Position: ___________________________________________________
Evidence: ___________________________________________________
Explanation: ___________________________________________________
Qualification: ___________________________________________________
Section C: Evaluation and Extended Response (Questions 15–20)
15. [3 marks] A hypothesis states: "Litter increases with distance from the bin in a hawker centre." Suggest a sampling method to test this and state one control variable.
16. [4 marks] Students tested: "Beach sediment size decreases with distance from the cliff." They used systematic sampling every 10 m for 100 m, measuring 20 pebbles per site with calipers. Evaluate the effectiveness of their methodology.
17. [3 marks] Describe how mobile phone apps can be used to improve the accuracy of fieldwork data collection on traffic volume.
18. [4 marks] A questionnaire asked: "Do you think the new park is bad for the environment?" Give two reasons why this question may reduce data validity and suggest an improved wording.
Reasons: ___________________________________________________
Improved wording: ___________________________________________________
19. [5 marks] Study the table of fieldwork results on noise level (dB) at three sites. Draw conclusions and evaluate the reliability of the data.
| Site | Time | Noise (dB) |
|---|---|---|
| A (MRT) | 8 am | 85 |
| B (Park) | 8 am | 55 |
| C (Market) | 8 am | 78 |
Conclusions: ___________________________________________________
Reliability evaluation: ___________________________________________________
20. [6 marks] A geography class conducted fieldwork to test: "Pedestrian density is higher near train stations than inland." They counted people in 5 m × 5 m squares for 5 minutes at 3 station areas and 3 inland areas. Evaluate the effectiveness of their methodology in testing this hypothesis.
Answers
O-Level Geography Quiz - Fieldwork: Answer Key
Total Marks: 40
Topic: Topic 1.3 Geographical Methods (Fieldwork)
Section A: Answers (Q1–8)
Q1 [2 marks]
A hypothesis is a testable statement predicting a relationship (e.g., "More trees reduce temperature"). A research question is an open enquiry (e.g., "How does tree cover affect temperature?").
Teaching note: Hypothesis guides data collection with a predicted outcome; research question explores without stating expected result.
Marking: 1 mark for hypothesis definition, 1 mark for research question definition.
Q2 [1 mark]
Any one: survey, observation, measurement (e.g., using anemometer), interview, field sketch.
Teaching note: Primary data is collected first-hand by the student in the field.
Q3 [2 marks]
A pilot study tests the method on a small scale to identify problems (e.g., unclear questions, wrong equipment) before full data collection, saving time and improving reliability.
Marking: 1 mark for "test method", 1 mark for "identify/ fix problems".
Q4 [1 mark]
Dividing the population into subgroups (strata) and sampling from each (e.g., by age group or zone) to ensure representation.
Q5 [2 marks]
Type: systematic or time-interval sampling (1 mark). Limitation: misses variation at other times; not representative of full-day usage (1 mark).
Q6 [2 marks]
Use a bar chart with attraction names on x-axis, visitor numbers on y-axis, separate bars for each attraction; allows easy comparison (2 marks for correct use + purpose).
Q7 [1 mark]
Line graph shows trend over time; pie chart shows proportion only (no time pattern).
Q8 [3 marks]
Net score = (8×2)+(6×1)+(4×–1)+(2×–2) = 16+6–4–4 = 14.
Working: Positive = 16+6 = 22; Negative = 4+4 = 8; Net = 22–8 = 14.
Marking: 1 mark method, 2 marks correct total. Common mistake: forgetting negative weights.
Section B: Answers (Q9–14)
Q9 [3 marks]
Use a bar chart (1) with locations on x-axis, wind speed (km/h) on y-axis (1), and labelled bars for each location with legend/title (1). Alternatively, line graph if comparing across time but here bar is direct.
Note: One combined graph, not separate.
Q10 [2 marks]
Must add: (1) north arrow, (2) scale bar (or ruler scale). Other valid: flow direction, label "outer bank (steep)" and "inner bank (gentle)".
Image support: Sketch must show steeper outer bank, gentle inner bank, flow arrow, north arrow.
Q11 [3 marks]
Sum = 2+3+4+3+5+2+4+3+4+3 = 33. Mean = 33 ÷ 10 = 3.3.
Marking: 1 mark sum, 1 mark division, 1 mark answer 3.3.
Q12 [2 marks]
GIS can overlay heat data with land use and building layers to show patterns spatially (1); updates digitally and allows zoom/analysis not possible on paper (1).
Q13 [3 marks]
Bar chart with four locations on x-axis, avg temperature on y-axis, clear labels and units °C (3 marks: type, axes, labels). Or line graph if continuous.
Q14 [4 marks]
Position: Not reliable / partially reliable (1). Evidence: only 10 min, one day, weekday morning (1). Explanation: excludes other times, weekend, longer periods → low representation (1). Qualification: quick count useful for snapshot but cannot generalise (1).
Section C: Answers (Q15–20)
Q15 [3 marks]
Method: systematic sampling along transect from bin outward every 2 m (1); count litter items per quadrant (1). Control: same bin size, same time of day (1).
Q16 [4 marks]
Effective: systematic sampling reduces bias (1); calipers give precise size (1); 20 pebbles/site adequate sample (1). Limitation: 100 m too short for trend; one beach only limits generalisation (1). Overall partially effective.
Q17 [3 marks]
Apps with GPS can auto-log location and time (1); camera records evidence (1); forms reduce writing error and sync to cloud (1).
Q18 [4 marks]
Reasons: leading question (assumes bad) (1); no scale/neutral option (1). Improved: "How does the new park affect the environment? Rate from very negative to very positive." (2 marks for neutral wording).
Q19 [5 marks]
Conclusions: MRT noisiest (85 dB), park quietest (55 dB) (2). Reliability: same time good but only one day, no repeat, small sample (3: 1 per point).
Marking descriptors: pattern identified, evaluate sample size/timing.
Q20 [6 marks]
Strengths: clear hypothesis, grid squares standardise count (2). Weakness: 5 min may miss peak; only 3 each limits; time not compared; inland definition vague (3). Improve: more areas, longer count, same day parts (1). Eval: partially effective (1).
Free quiz and exam paper access
Enter your details to view this paper
Your access is remembered on this device.