From Real Exams Quiz
O Level Geography Resources Sustainability Quiz
Free O Level Geography Resources Sustainability quiz, HY3 Exam version, with questions, answers, and O Level-style practice for Singapore students.
These static practice materials are generated from the site's syllabus and paper-generation workflow, with source and model context shown so students and parents can evaluate the material before use.
Questions
Free quiz and exam paper access
Enter your details to view this paper
Your access is remembered on this device.
Answers
O-Level Geography Quiz - Resources Sustainability (Answer Key)
Total Marks: 40 | Duration: 60 min
Section A Answers (Q1–8)
Q1 [1 mark]
Answer: Sustainable development is "development that meets the needs of the present without compromising the ability of future generations to meet their own needs" (Brundtland Report, 1987).
Teaching note: This is the standard definition; accept any close paraphrase. Key idea: intergenerational equity.
Q2 [1 mark]
Answer: Ecocentric.
Teaching note: Ecocentric = nature valued for itself; anthropocentric = nature valued for human benefit. The statement says "regardless of human use" → ecocentric.
Q3 [1 mark]
Answer: Resource-dependent / import-dependent country. (Accept "resource-scarce")
Teaching note: Singapore is resource-scarce; term shows reliance on external supply.
Q4 [2 marks]
Working: Mean = (120+115+130+125+140+135) / 6 = 765 / 6 = 127.5 million litres.
Answer: 127.5 million litres.
Mark breakdown: 1 for sum, 1 for division & unit. Common mistake: omitting unit or wrong division.
Q5 [1 mark]
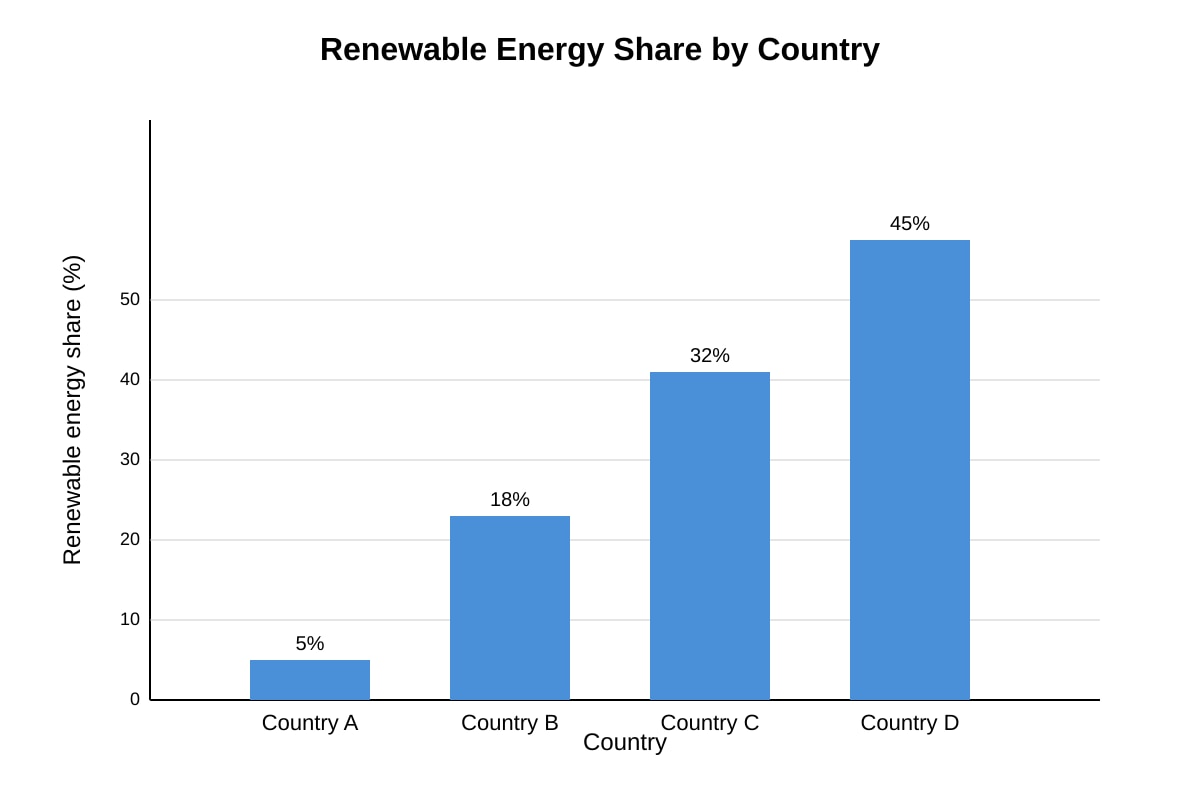
Answer: Country A (5%).
Teaching note: From placeholder chart, A bar is shortest at 5%.
Q6 [1 mark]
Answer: Coal / oil / natural gas (any one).
Teaching note: Non-renewable = formed over millions of years, finite.
Q7 [2 marks]
Answer: Reducing food waste means less land, water and energy used for production that is thrown away; lowers methane from landfills. (1 mark reason, 1 mark link to sustainability)
Teaching note: Connects resource efficiency and emissions.
Q8 [3 marks]
Answer: Use a bar chart with x-axis = 4 locations, y-axis = average electricity use (kWh), bars for each location; or line graph if over time. Must be ONE graph with legend/labels.
Marking: 1 graph type, 1 axes labelled, 1 all 4 locations on same graph. Trap: separate graphs not accepted.
Section B Answers (Q9–14)
Q9 [4 marks]
(a) NEWater (recycled wastewater) – 2 marks for description.
(b) Catchment management / import diversification / desalination – 2 marks.
Teaching note: Singapore's 4 taps strategy.
Q10 [2 marks]
Method: Net score = (30×2)+(50×1)+(15×–1)+(5×–2) = 60+50–15–10 = 85.
Marking: 1 for weighting assignment, 1 for calculation. Show weights applied.
Q11 [3 marks]
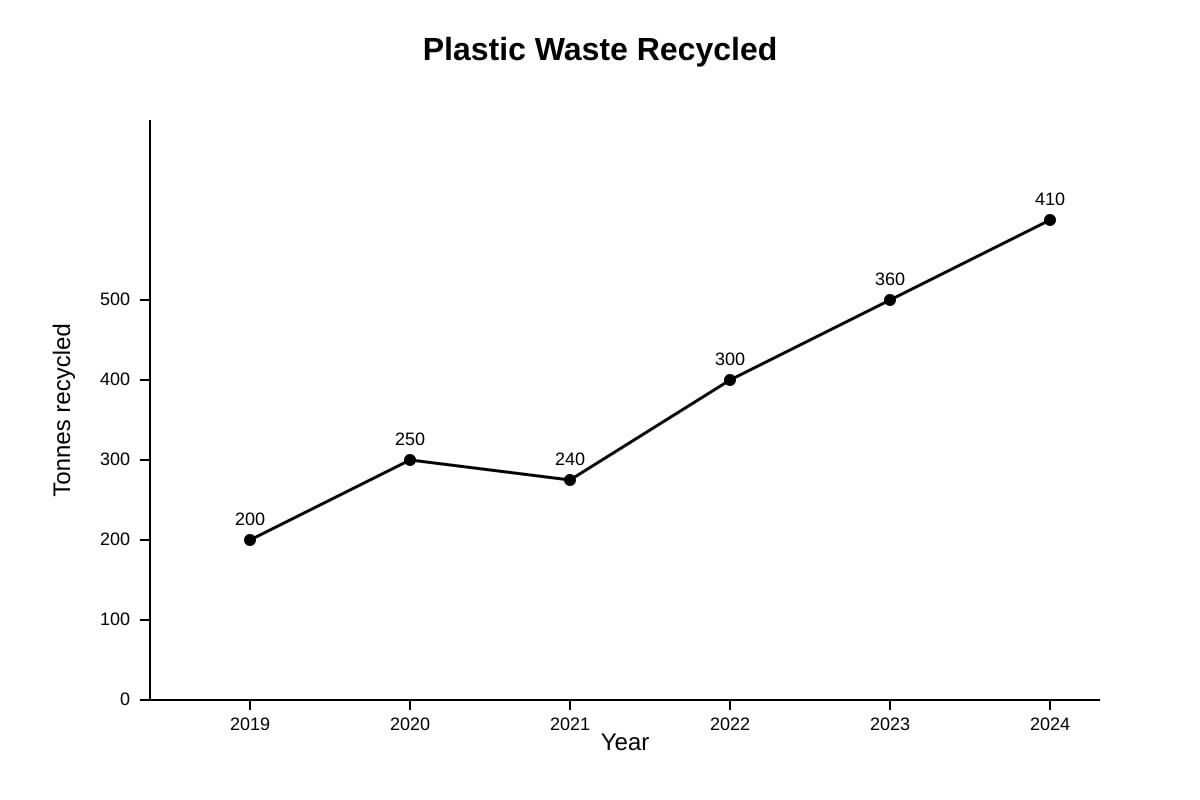
Trend: Overall increase from 200 to 410 tonnes (1). Reason: e.g., better collection schemes, awareness campaigns (2).
From placeholder: line rises steadily. Teaching: describe then explain.
Q12 [4 marks]
Mitigation: reducing causes (e.g., solar panels cut CO2) – 2. Adaptation: adjusting to impacts (e.g., flood barriers) – 2.
Teaching: mitigation addresses source, adaptation addresses effect.
Q13 [4 marks]
Position: Partially unsustainable (1). Env: harms reserve biodiversity (1). Eco: cheap disposal, jobs (1). Trade-off noted (1).
Descriptors: balanced view needed.
Q14 [3 marks]
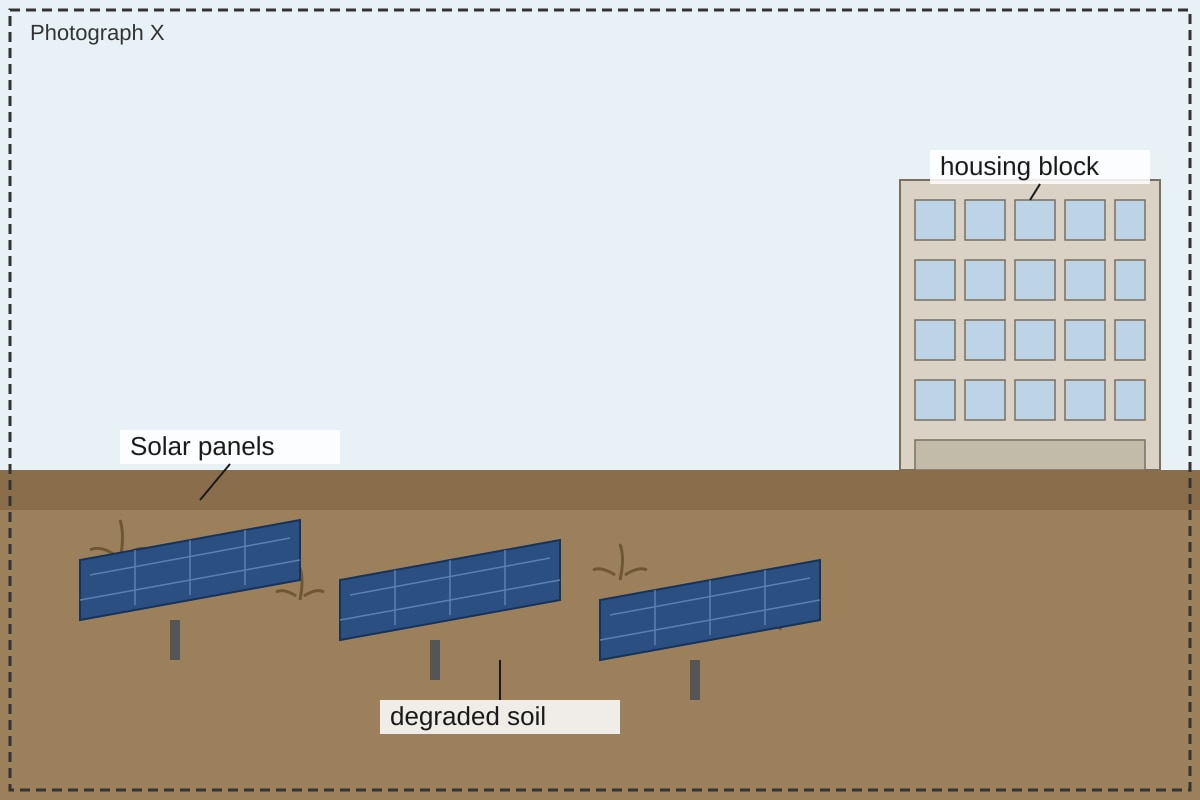
From photo: panels on degraded land avoid farmland loss (1); generate clean energy (1); near housing = local use (1).
Teaching: brownfield reuse supports sustainability.
Section C Answers (Q15–20)
Q15 [6 marks]
Structure: Agree points (growth funds tech) 2; Disagree (degradation irreversible) 2; Conclusion extent (2).
Descriptors: 6-mark AO3 needs evaluated judgement.
Q16 [4 marks]
City Y more sustainable: lower water 110 vs 150 (1), higher recycling 55 vs 20 (1), more green 35 vs 10 (1); compare clearly (1).
Teaching: use data directly.
Q17 [4 marks]
Method: survey meters / observe off-switch (2). Reliability: small sample / timing bias (2).
Teaching: fieldwork design + eval.
Q18 [5 marks]
Effective: shared targets, finance (2). Limited: no enforcement (2). Judgement (1).
Descriptors: AO3 evaluate.
Q19 [4 marks]
Economic: jobs, GDP (2). Food: loses farmland, security drop (2).
Teaching: trade-off explicit.
Q20 [6 marks]
Individual: reduce demand (2). Limit: systemic scale (2). Extent conclusion (2).
Descriptors: balanced AO3.