From Real Exams Quiz
O Level Geography Physical Geography Quiz
Free O Level Geography Physical Geography quiz, HY3 Exam version, with questions, answers, and O Level-style practice for Singapore students.
These static practice materials are generated from the site's syllabus and paper-generation workflow, with source and model context shown so students and parents can evaluate the material before use.
Questions
Free quiz and exam paper access
Enter your details to view this paper
Your access is remembered on this device.
Answers
O-Level Geography Quiz - Physical Geography (Answer Key)
Total Marks: 40
Topic: Physical Geography
Section A: Answers
Q1 [1 mark]
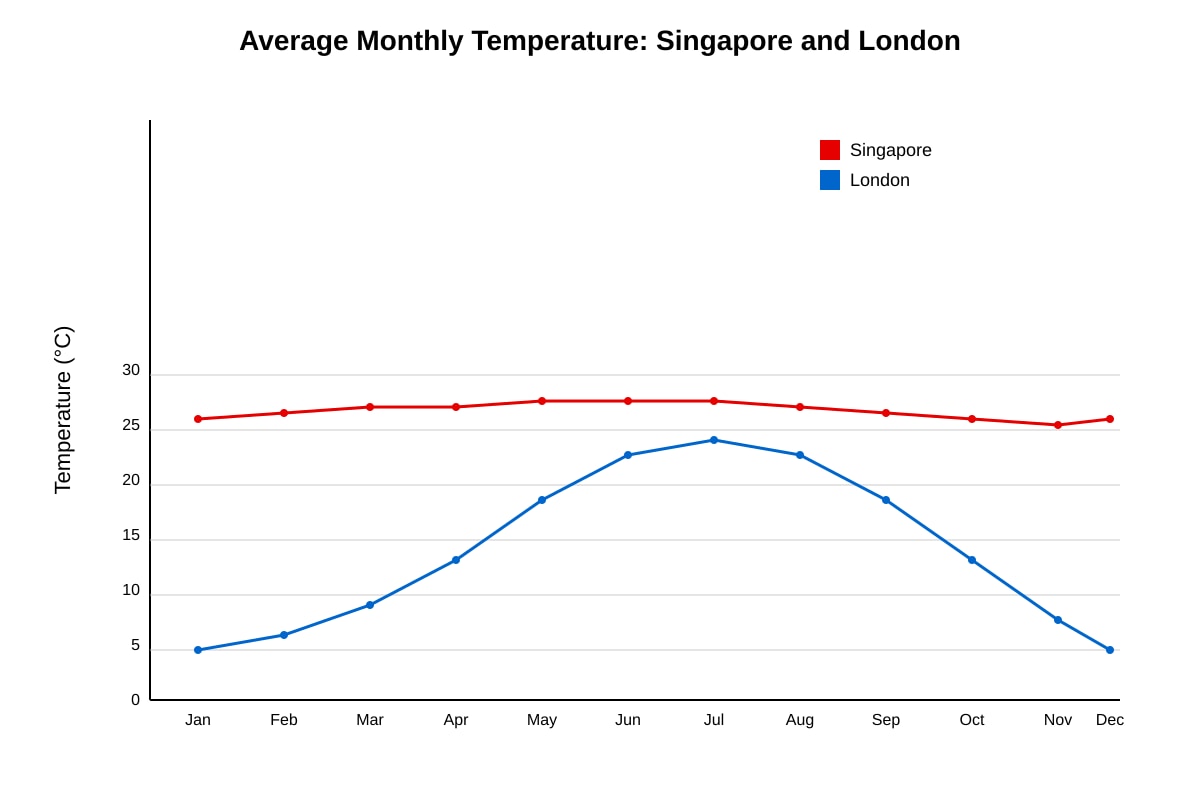
Answer: London has a larger annual temperature range than Singapore (or Singapore temperatures are more constant around 26–28°C while London varies from 5°C to 22°C).
Teaching note: Temperature pattern refers to how temperature changes across months. Singapore is near equator → small range; London mid-latitude → seasonal variation. Accept any one clear difference.
Q2 [3 marks]
Answer: Use a bar chart (or grouped bar chart) with locations A, B, C on x-axis and wind speed (km/h) on y-axis; OR a line graph if time-series but here comparison → bar chart best. Include legend/labels.
Mark breakdown: 1 mark for graph type (bar chart), 1 mark for correct axes (location, wind speed with unit), 1 mark for labelling/legend.
Teaching note: Continuous comparison of 3 categories → bar chart. Do not use pie chart (not for comparing magnitudes across independent sites). Common mistake: suggesting 3 separate graphs.
Q3 [1 mark]
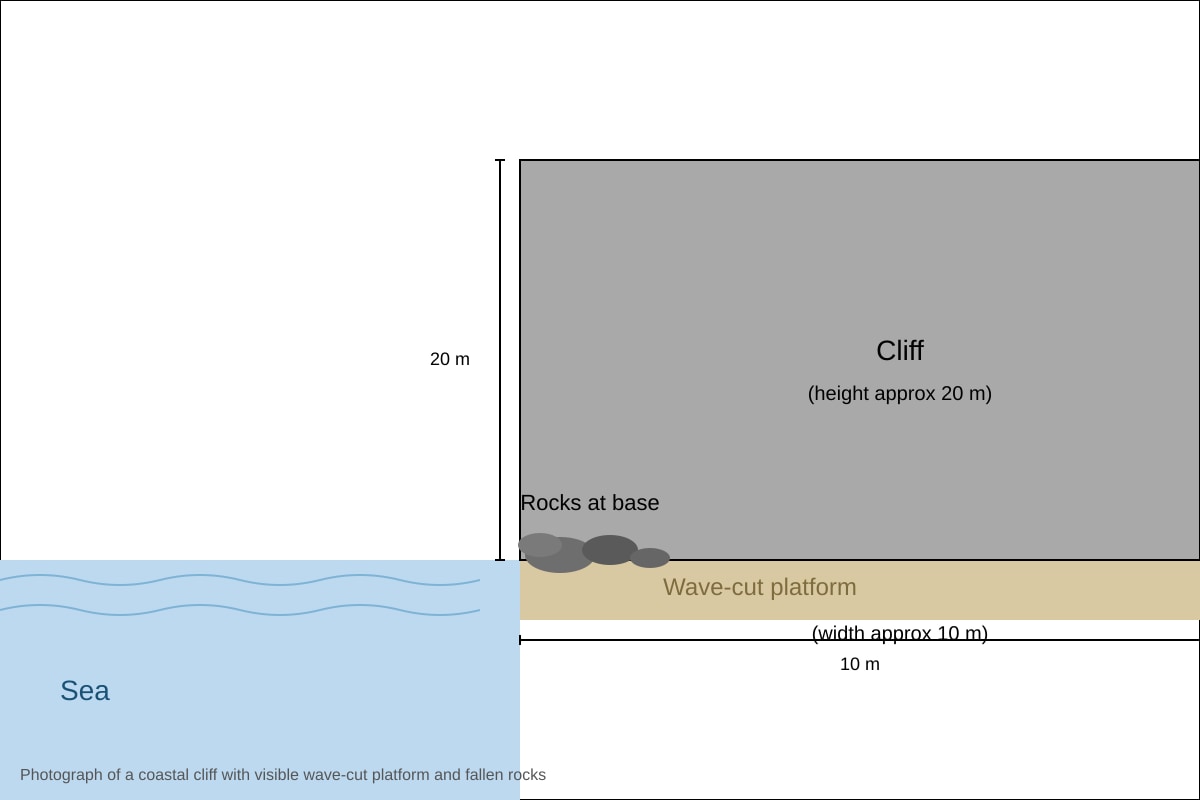
Answer: Wave-cut platform.
Teaching note: Flat eroded surface at cliff base formed by wave action.
Q4 [2 marks]
Answer: Any one feature e.g., "The cliff is steep/vertical" (1m), "approximately 20 m high with bare rock" (1m).
Mark breakdown: 1 mark identify feature, 1 mark elaboration (height/material/gradient).
Teaching note: Describe = what you see, not process.
Q5 [1 mark]
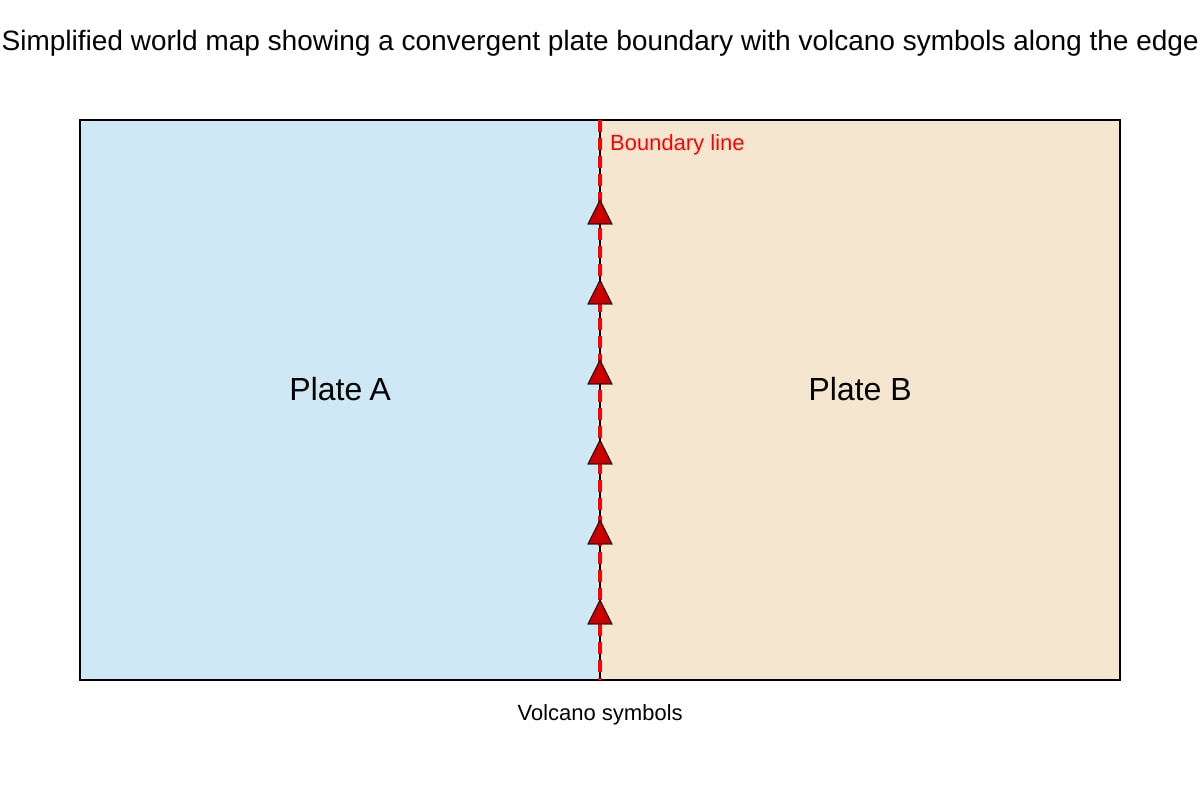
Answer: Volcanoes are concentrated along the plate boundary (linear pattern).
Teaching note: Map shows dots on boundary line, not random.
Q6 [2 marks]
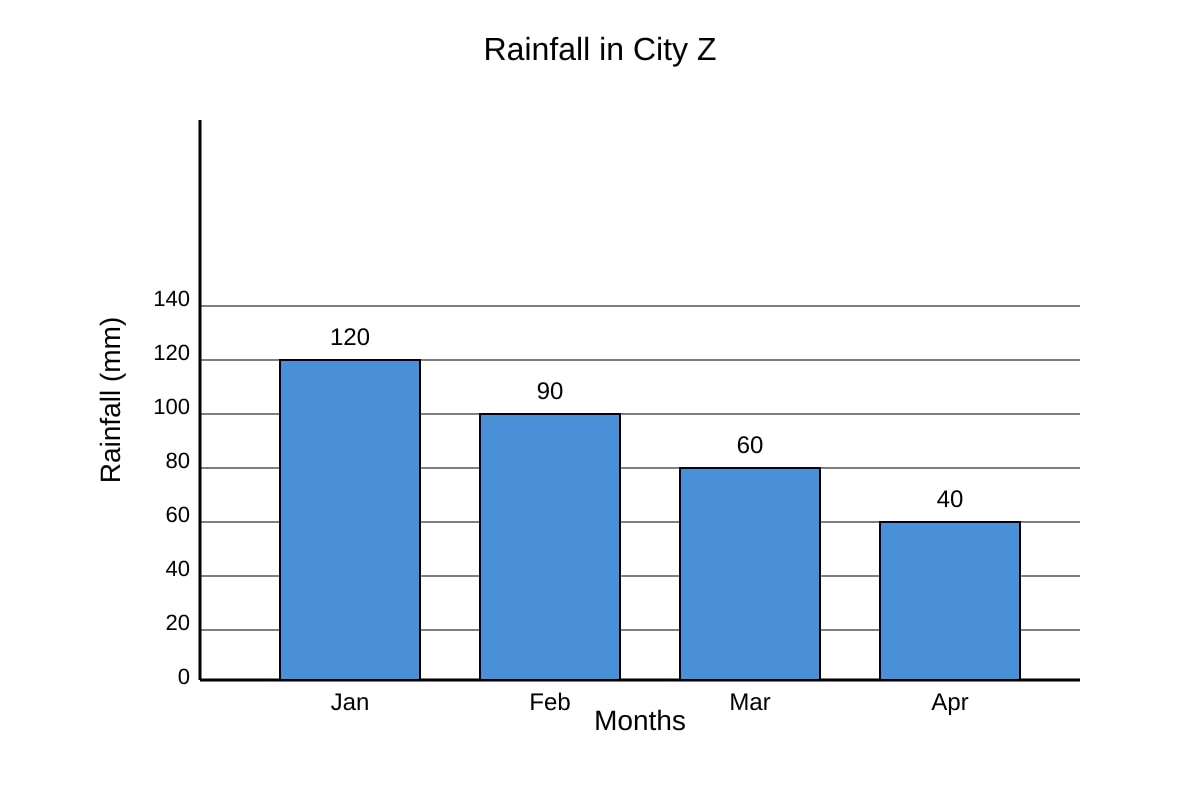
Answer: 120 + 90 + 60 + 40 = 310 mm.
Working: Jan 120, Feb 90 → 210; + Mar 60 → 270; + Apr 40 → 310.
Teaching note: Sum bars from chart. Units must be mm.
Q7 [1 mark]
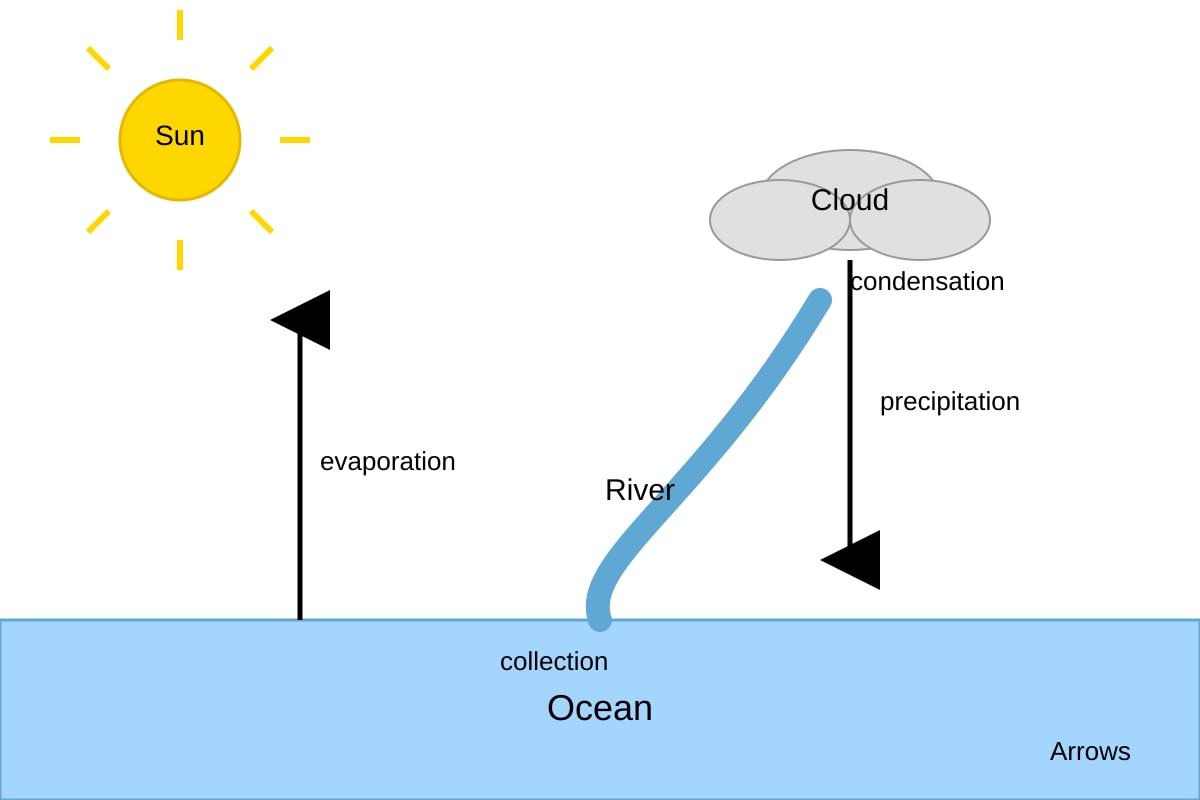
Answer: Evaporation.
Teaching note: Upward arrow from ocean to cloud = water turning to vapour.
Q8 [1 mark]
Answer: Burning fossil fuels (or deforestation, cement production).
Teaching note: Releases CO₂, traps heat.
Section B: Answers
Q9 [3 marks]
Answer: Waves attack cliff base at high tide → notch forms (1m). Undercutting causes cliff to collapse (1m). Repeated retreat leaves flat platform at low tide level (1m).
Teaching note: Process = erosion + mass movement. Link to Q3 photo.
Q10 [2 marks]
Answer: High annual rainfall (e.g., >2000mm) (1m); high and stable temperatures (~25–28°C) (1m).
Teaching note: Tropical climate near equator; not four seasons.
Q11 [3 marks]
Answer: Longshore drift moves sediment along coast (1m); at a bend or river mouth, deposition occurs (1m); sediment extends as narrow ridge into sea = spit (1m).
Teaching note: Spit = depositional, needs drift + supply.
Q12 [2 marks]
Answer: Add the recorded temperatures for each location; divide by number of recordings (1m). Example: (T1+T2+...)/n (1m).
Teaching note: Mean = sum ÷ count. Not just state highest.
Q13 [2 marks]
Answer: Weather = short-term atmospheric condition (1m); climate = long-term average over 30+ years (1m).
Teaching note: Time scale is key difference.
Q14 [3 marks]
Answer: Boundary is convergent (1m); one plate subducts, melts to magma (1m); magma rises to form volcanoes on boundary (1m).
Teaching note: From Q5 map, volcanoes on edge = subduction zone.
Q15 [2 marks]
Answer: Any two: sea level rise floods land (1m); stronger storms erode coast (1m).
Teaching note: Climate change → thermal expansion + ice melt.
Section C: Answers
Q16 [5 marks]
Describe (2m): Steep rocky cliff ~20m; wave-cut platform flat ~10m wide at base.
Account (3m): Wave erosion at high tide cuts notch; cliff collapses; repeated retreat forms platform; process visible in photo.
Teaching note: Must link photo. Mark descriptors: 2 for description, 3 for process with mechanism.
Q17 [4 marks]
Position: Partially unreliable (1m). Evidence: single quadrat = small sample (1m); one time = misses tidal variation (1m); but quick method reduces cost (1m).
Teaching note: Reliability = consistency. Counterargument needed for 4th mark.
Q18 [4 marks]
Cause: CO₂/methane trap infrared (1m); from fossil fuels/deforestation (1m). Leads to: more heat retained → global temp rise (1m); melting ice, sea rise (1m).
Teaching note: Greenhouse effect natural but enhanced by humans.
Q19 [4 marks]
Natural processes dominate (1m): plate movement, earthquakes (1m). Human action minor (1m): mining, dams induce small quakes but not main (1m). Conclusion: mostly natural.
Teaching note: Evaluate = weigh both, conclude.
Q20 [4 marks]
Against sustainable: hard engineering, high cost, visual impact (1m). For: protects lives/properties now (1m). Not fully sustainable: no long-term ecosystem benefit (1m); better soft engineering (1m).
Teaching note: Sustainable = meet present without compromising future.