O-Level Geography Quiz - Human Geography
Name: ___________________________
Class: ___________________________
Date: ___________________________
Score: _______ / 40
Duration: 60 minutes
Total Marks: 40
Topic: Human Geography (Tourism Development, Urbanisation, Population, Economic Activities, Sustainable Human Development)
Instructions:
- Answer all 20 questions.
- Section A: Short structured questions (1–8). Section B: Data and source interpretation (9–14). Section C: Extended response (15–20).
- Use the spaces provided. Show working where requested.
- Marks for each question are shown in brackets [ ].
Section A: Short Structured Questions (1–8)
1. State one push factor that may cause people to migrate from a rural area to a city. [1]
2. Give one example of a primary economic activity. [1]
3. Define the term "urbanisation" in one sentence. [2]
4. Name one negative socio-cultural impact of mass tourism on a host community. [1]
5. The table below shows the population of Town X in 2010 and 2020.
| Year | Population |
|---|
| 2010 | 20 000 |
| 2020 | 26 000 |
Calculate the percentage increase in population from 2010 to 2020. Show your working. [2]
Working: __________________________________________________
Answer: _______ %
6. Identify one strategy used to achieve sustainable tourism development. [1]
7. State one environmental problem caused by rapid urbanisation in a developing country. [1]
8. Explain one reason why tourism is important to a country's economy. [2]
Section B: Data and Source Interpretation (9–14)
9. Study the data below showing visitor arrivals (in thousands) to Country Y for three types of tourism in 2023.
| Tourism type | Visitor arrivals (000) |
|---|
| Cultural tourism | 120 |
| Ecotourism | 80 |
| Beach resort | 200 |
Suggest how the visitor arrivals for the three types of tourism could be shown on one graph. [3]
10. A fieldwork study surveyed 40 residents on their view of a new shopping mall using a Likert scale: Strongly Agree (+2), Agree (+1), Disagree (−1), Strongly Disagree (−2). Results for "The mall improves local amenities": Strongly Agree = 10, Agree = 12, Disagree = 10, Strongly Disagree = 8. Describe how the students could calculate a net score for this statement. [2]
11. Using the data in Q10, calculate the net score. Show your working. [2]
Working: __________________________________________________
Answer: _______
12. Study the extract below from a report on urbanisation in City Z.
"City Z grew from 1 million people in 1990 to 4 million in 2020. Informal settlements expanded on the outskirts because of rural-urban migration. Air pollution worsened as car ownership tripled."
Identify two environmental impacts of urbanisation mentioned in the extract. [2]
13. With reference to the extract in Q12, explain one economic reason for the growth of informal settlements. [2]
14.
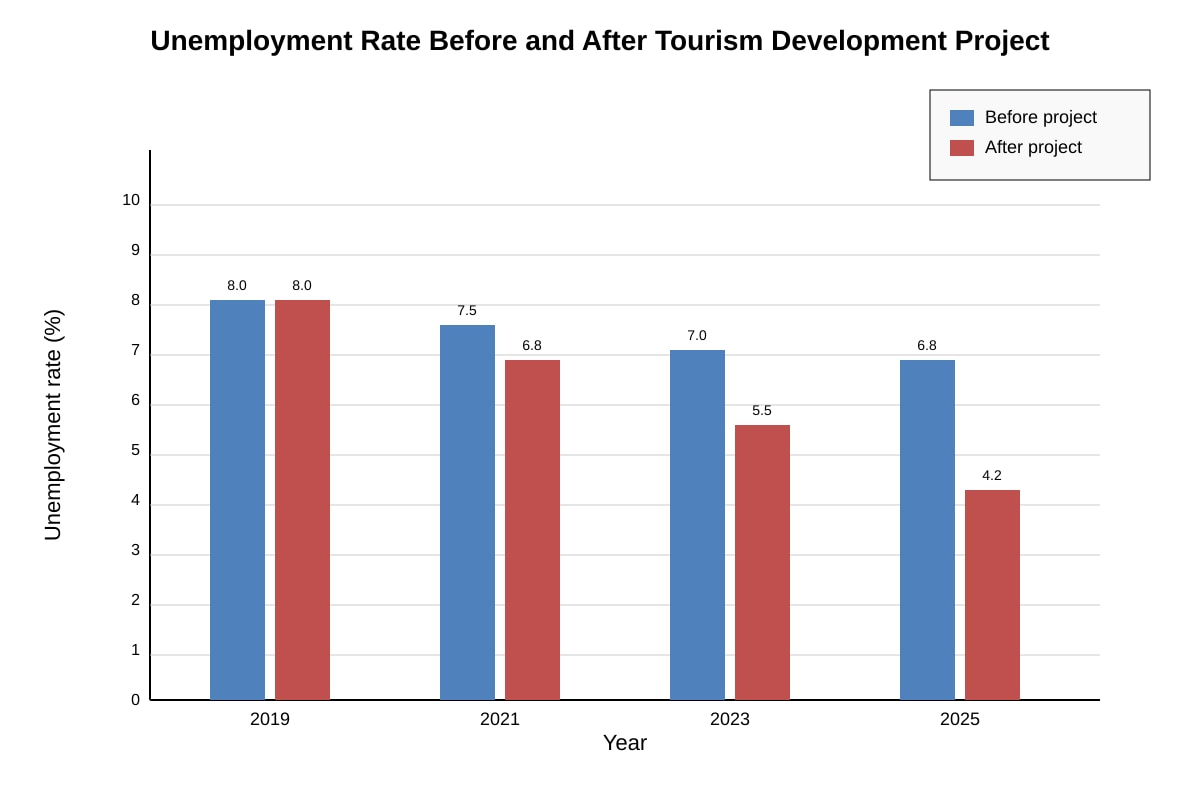
Generated graph for Q14.
Using the graph above, describe the trend in unemployment rate after the tourism development project. [2]
Section C: Extended Response (15–20)
15. Explain how tourism development can lead to both positive and negative economic impacts on a host country. [4]
16. A student says: "Rapid urbanisation always improves the quality of life for migrants." To what extent do you agree? Explain your answer using geographical evidence. [4]
17. Study the table below on two towns.
| Town | Population 2000 | Population 2020 | Jobs created 2020 | Green space lost (ha) |
|---|
| A | 50 000 | 90 000 | 8 000 | 120 |
| B | 30 000 | 45 000 | 3 500 | 40 |
Evaluate whether Town A's development is more sustainable than Town B's. [4]
18. Describe two differences between rural and urban settlements in terms of functions and population density. [2]
19. "Ecotourism is the best way to achieve sustainable tourism development." Evaluate this statement. [4]
20. A town plans to build a new industrial estate. Suggest two ways the local council can reduce the negative social impacts on nearby residents. [2]
</stage3_quiz_answers_md>
O-Level Geography Quiz - Human Geography (Answer Key)
Total Marks: 40
Topic: Human Geography
Section A: Short Structured Questions (1–8)
1. [1]
Answer: Any one push factor, e.g. lack of jobs in rural area / drought / conflict / poor services.
Teaching note: Push factors are conditions that make people leave a place. Mark awarded for a clear cause of out-migration.
2. [1]
Answer: Any primary activity, e.g. farming / fishing / mining / forestry.
Teaching note: Primary activities extract natural resources directly from the environment.
3. [2]
Answer: Urbanisation is the increase in the proportion of people living in urban areas compared to rural areas, usually due to rural-urban migration and natural increase.
Marking: 1 mark for "increase in urban population/share", 1 mark for process (migration/natural increase).
Teaching note: Do not say "city grows" only; must show relative change.
4. [1]
Answer: e.g. loss of local culture / crowding / crime increase / conflict with tourists.
Teaching note: Socio-cultural = how people and culture are affected.
5. [2]
Working: % increase = ((26 000 − 20 000) / 20 000) × 100 = (6 000 / 20 000) × 100 = 30%
Answer: 30%
Marking: 1 mark working, 1 mark correct answer.
Teaching note: Percentage increase = change ÷ original × 100.
6. [1]
Answer: e.g. limit visitor numbers / use local guides / conserve heritage / eco-certification.
Teaching note: Strategy must link to sustainability (future + local benefit).
7. [1]
Answer: e.g. air pollution / water pollution / slums / loss of farmland.
Teaching note: Environmental, not economic.
8. [2]
Answer: Tourism brings foreign exchange earnings / creates jobs (e.g. in hotels) / multiplier effect helps local businesses.
Marking: 1 mark for idea, 1 mark for explanation.
Teaching note: Economy = money and jobs.
Section B: Data and Source Interpretation (9–14)
9. [3]
Answer: Use a bar chart with tourism type on x-axis and arrivals (000) on y-axis; three bars (cultural, ecotourism, beach) for one year; label axes and units; legend not needed if labelled.
Marking: 1 mark graph type, 1 mark axes/variable, 1 mark labels/units.
Teaching note: One combined graph, not three separate pies. Categorical comparison → bar chart.
10. [2]
Answer: Assign weight: SA=+2, A=+1, D=−1, SD=−2. Multiply frequency by weight, sum all = net score.
Marking: 1 mark weighting, 1 mark sum method.
Teaching note: Likert scale needs weighting before summing.
11. [2]
Working: (10×2)+(12×1)+(10×−1)+(8×−2) = 20+12−10−16 = 6
Answer: 6
Marking: 1 mark working, 1 mark answer.
Teaching note: Positive minus negative gives net.
12. [2]
Answer: Air pollution worsened; loss of green space (if inferred from settlements) — from extract: air pollution. Also acceptable: expansion of informal settlements as environmental/social.
Marking: 1 mark each, max 2.
Teaching note: Only use extract evidence.
13. [2]
Answer: Rural-urban migrants had no formal housing/jobs, so they settled informally due to lack of affordable housing / low income.
Marking: 1 mark link to migration, 1 mark economic reason.
Teaching note: Economic = income/housing cost.
14. [2]
Answer: After the project, unemployment rate fell from 8.0% (2019) to 4.2% (2025); steady decline after 2019 while before-project stayed ~6.8–8.0%.
Marking: 1 mark trend, 1 mark data reference.
Teaching note: Describe visible bars from placeholder values.
Section C: Extended Response (15–20)
15. [4]
Answer points:
- Economic: jobs in services, foreign exchange, infrastructure improvement.
− Economic: leakage (foreign companies take profit), seasonal jobs, price rise for locals.
Marking: 2 marks positive (1 point+explain), 2 marks negative.
Teaching note: Balanced economic view required.
16. [4]
Answer: Disagree partly. Migrants may get jobs (positive), but face slums, high cost, pollution (negative). Use extract-style evidence.
Marking: Position 1, evidence 2, conclusion 1.
Teaching note: "Always" is extreme; evaluate both sides.
17. [4]
Answer: Town A: more jobs per person? 8000/90000 vs B 3500/45000 → B higher ratio. A lost more green space. Sustainability = balance. Town B more sustainable on space, A on jobs.
Marking: 1 calc/compare, 1 environmental, 1 economic, 1 judgement.
Teaching note: Compare rates not just totals.
18. [2]
Answer: Rural: low density, agriculture functions. Urban: high density, commercial/industrial functions.
Marking: 1 each.
Teaching note: Function = what the settlement does.
19. [4]
Answer: For: conserves environment, local benefit. Against: costly, limited scale, other types (pro-poor) also help. Conclusion: useful but not only way.
Marking: 2 for, 2 against/balance.
Teaching note: Evaluate, not just describe.
20. [2]
Answer: e.g. build buffer green space, consult residents, improve transport, noise limits.
Marking: 1 each.
Teaching note: Social = community wellbeing.
</stage3_quiz_answers_md>
<stage3_quiz_md>
O-Level Geography Quiz - Human Geography
Name: ___________________________
Class: ___________________________
Date: ___________________________
Score: _______ / 40
Duration: 60 minutes
Total Marks: 40
Topic: Human Geography (Tourism Development, Urbanisation, Population, Economic Activities, Sustainable Human Development)
Instructions:
- Answer all 20 questions.
- Section A: Short structured questions (1–8). Section B: Data and source interpretation (9–14). Section C: Extended response (15–20).
- Use the spaces provided. Show working where requested.
- Marks for each question are shown in brackets [ ].
Section A: Short Structured Questions (1–8)
1. State one push factor that may cause people to migrate from a rural area to a city. [1]
2. Give one example of a primary economic activity. [1]
3. Define the term "urbanisation" in one sentence. [2]
4. Name one negative socio-cultural impact of mass tourism on a host community. [1]
5. The table below shows the population of Town X in 2010 and 2020.
| Year | Population |
|---|
| 2010 | 20 000 |
| 2020 | 26 000 |
Calculate the percentage increase in population from 2010 to 2020. Show your working. [2]
Working: __________________________________________________
Answer: _______ %
6. Identify one strategy used to achieve sustainable tourism development. [1]
7. State one environmental problem caused by rapid urbanisation in a developing country. [1]
8. Explain one reason why tourism is important to a country's economy. [2]
Section B: Data and Source Interpretation (9–14)
9. Study the data below showing visitor arrivals (in thousands) to Country Y for three types of tourism in 2023.
| Tourism type | Visitor arrivals (000) |
|---|
| Cultural tourism | 120 |
| Ecotourism | 80 |
| Beach resort | 200 |
Suggest how the visitor arrivals for the three types of tourism could be shown on one graph. [3]
10. A fieldwork study surveyed 40 residents on their view of a new shopping mall using a Likert scale: Strongly Agree (+2), Agree (+1), Disagree (−1), Strongly Disagree (−2). Results for "The mall improves local amenities": Strongly Agree = 10, Agree = 12, Disagree = 10, Strongly Disagree = 8. Describe how the students could calculate a net score for this statement. [2]
11. Using the data in Q10, calculate the net score. Show your working. [2]
Working: __________________________________________________
Answer: _______
12. Study the extract below from a report on urbanisation in City Z.
"City Z grew from 1 million people in 1990 to 4 million in 2020. Informal settlements expanded on the outskirts because of rural-urban migration. Air pollution worsened as car ownership tripled."
Identify two environmental impacts of urbanisation mentioned in the extract. [2]
13. With reference to the extract in Q12, explain one economic reason for the growth of informal settlements. [2]
14.
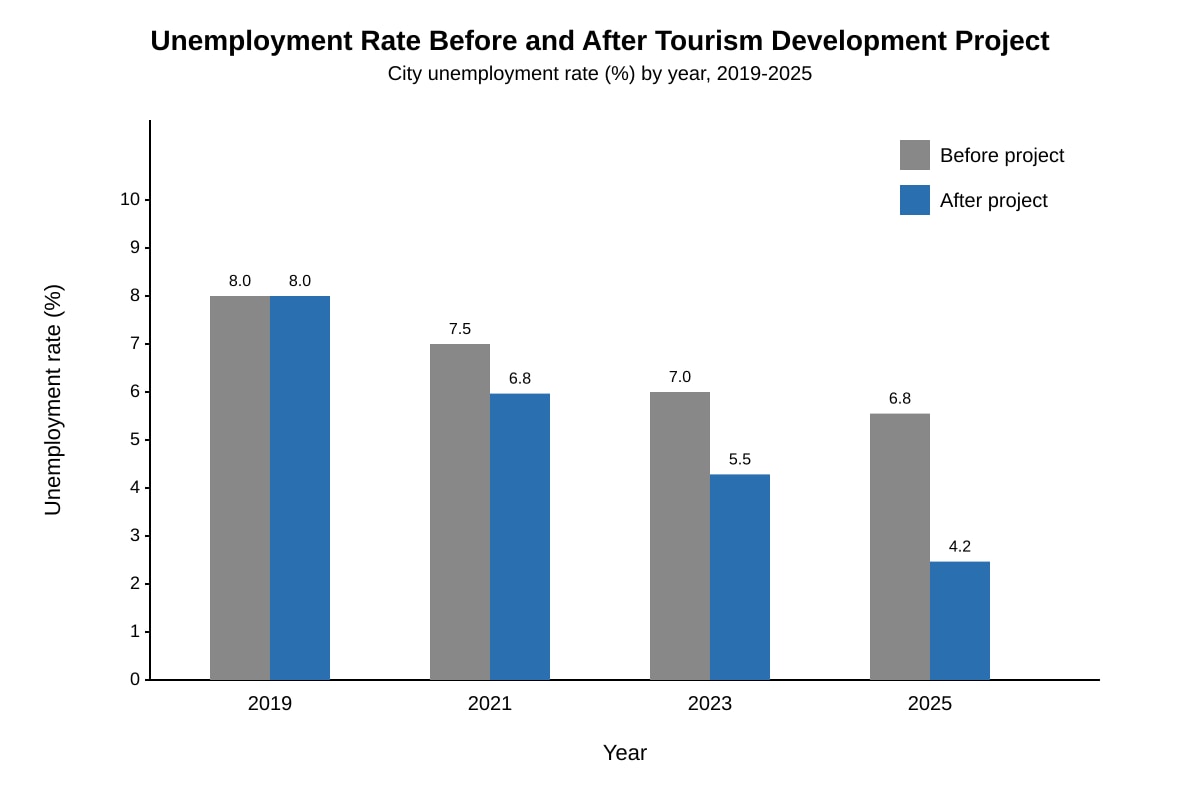
Generated graph for Q14.
Using the graph above, describe the trend in unemployment rate after the tourism development project. [2]
Section C: Extended Response (15–20)
15. Explain how tourism development can lead to both positive and negative economic impacts on a host country. [4]
16. A student says: "Rapid urbanisation always improves the quality of life for migrants." To what extent do you agree? Explain your answer using geographical evidence. [4]
17. Study the table below on two towns.
| Town | Population 2000 | Population 2020 | Jobs created 2020 | Green space lost (ha) |
|---|
| A | 50 000 | 90 000 | 8 000 | 120 |
| B | 30 000 | 45 000 | 3 500 | 40 |
Evaluate whether Town A's development is more sustainable than Town B's. [4]
18. Describe two differences between rural and urban settlements in terms of functions and population density. [2]
19. "Ecotourism is the best way to achieve sustainable tourism development." Evaluate this statement. [4]
20. A town plans to build a new industrial estate. Suggest two ways the local council can reduce the negative social impacts on nearby residents. [2]