O-Level Geography Quiz - Fieldwork
Name: ___________________________
Class: ___________________________
Date: ___________________________
Score: ___________ / 40
Duration: 60 minutes
Total Marks: 40
Topic: Fieldwork (Geographical Methods)
Instructions:
- Answer all 20 questions.
- Section A: Short Answer (1–5)
- Section B: Data and Method Application (6–13)
- Section C: Structured Response and Evaluation (14–20)
- Use clear geographical terms. Show working where calculation is required.
Section A: Short Answer (1–5)
1. [2 marks] State one purpose of carrying out geographical fieldwork in the O-Level syllabus.
2. [1 mark] Give one example of a primary data collection method used in fieldwork.
3. [2 marks] Define the term "hypothesis" in a geographical investigation.
4. [1 mark] Name one instrument used to measure wind speed during fieldwork.
5. [2 marks] Explain why a pilot study is carried out before the main fieldwork data collection.
Section B: Data and Method Application (6–13)
6. [2 marks] A student group collected the average temperature (°C) at four locations in a neighbourhood: Park, Carpark, Field, and Block. Suggest how the temperature at the four locations could be shown on one graph.
7. [2 marks] The students used a Likert scale for amenity satisfaction: Strongly Agree = +2, Agree = +1, Disagree = −1, Strongly Disagree = −2. Describe how they could calculate the net score for each amenity from the survey responses.
8. [3 marks] Study the table below showing pedestrian count at a void deck at 3 time slots.
| Time | Count |
|---|
| 8am | 12 |
| 12pm | 25 |
| 6pm | 40 |
Suggest a suitable graph to display this data and give two labelling requirements.
9. [2 marks] A fieldwork study used a sample of 10 households in one HDB block to represent the whole town. State one reason why this sampling method may reduce reliability.
10. [3 marks] The students measured noise level (dB) at 3 sites: MRT (82), Playground (68), Library (45). Calculate the mean noise level across the three sites. Show your working.
11. [2 marks] Explain one advantage of using a questionnaire instead of an interview for fieldwork data collection.
12. [2 marks] State two types of secondary data that could support a fieldwork project on urban heat islands in Singapore.
13. [3 marks]
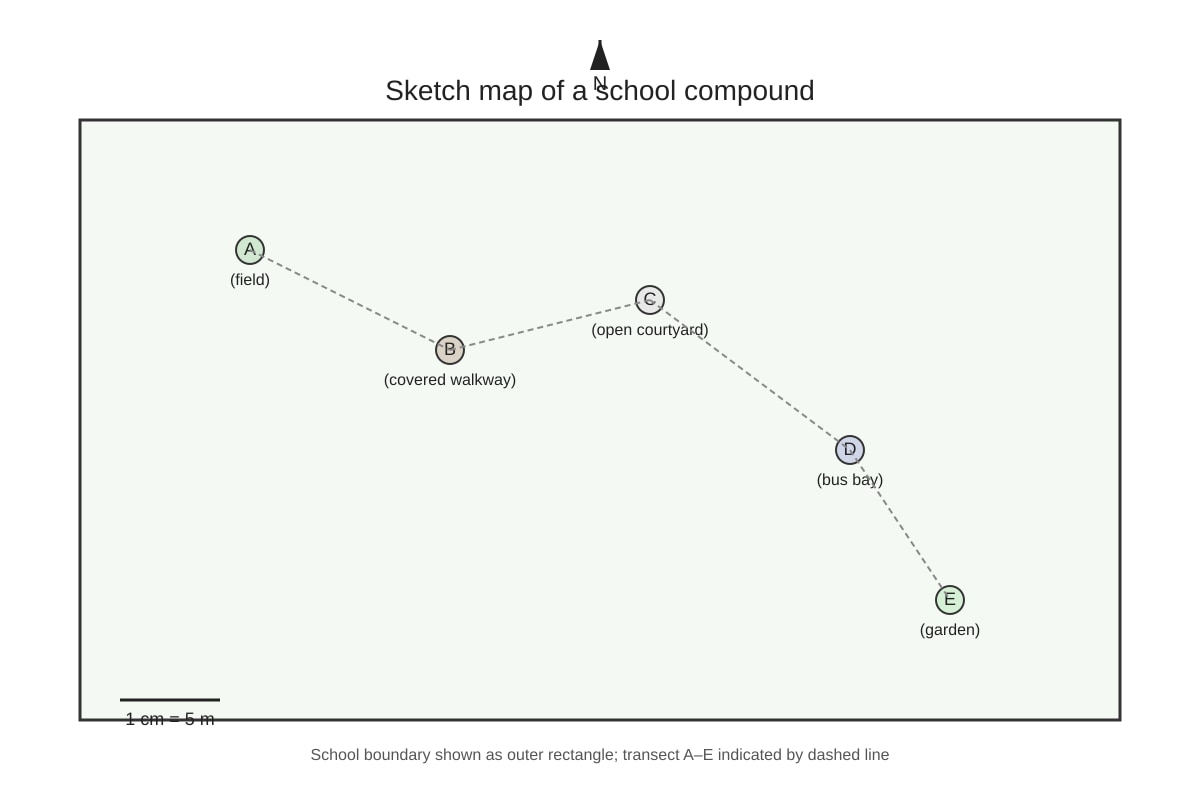
Generated map for Q13.
Using the map above, describe how systematic sampling along a transect from A to E could be carried out for surface temperature.
Section C: Structured Response and Evaluation (14–20)
14. [2 marks] Explain why documenting the exact time and weather during outdoor measurements improves data quality.
15. [3 marks] A hypothesis states: "Tree cover reduces ambient temperature in residential areas." Outline how a student could test this using fieldwork methods.
16. [3 marks] Evaluate whether using a mobile phone app for GPS tracking is reliable for mapping pedestrian routes. Give one strength and one limitation.
17. [3 marks] Study the bar chart description below.
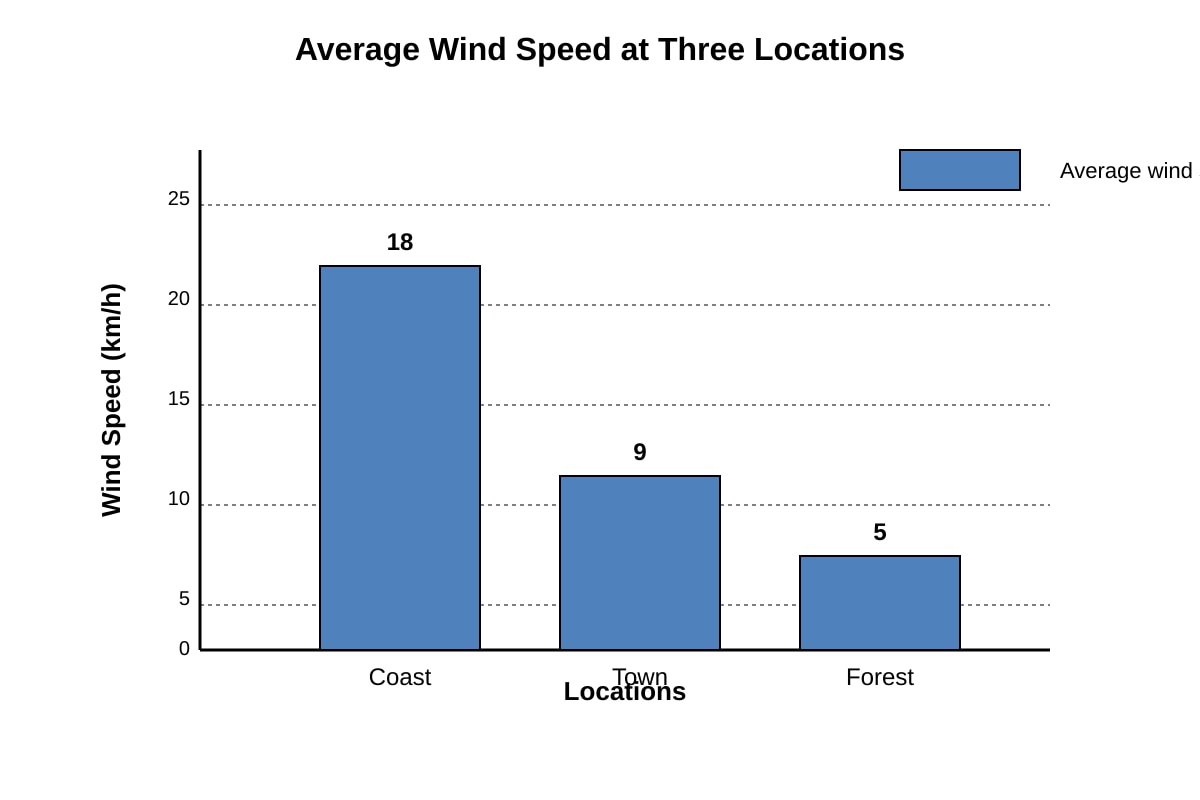
Generated chart for Q17.
Describe the pattern shown and suggest one reason for the difference between Coast and Forest.
18. [4 marks] For a fieldwork study on litter in a park, students collected 20 photographs and counted items in each. Evaluate whether this method gives reliable data. Use evidence from the method.
19. [4 marks] A group assessed sense of place by asking 50 residents to score attachment from 1 (low) to 5 (high). They reported a mean of 4.1. Explain how the students should present and interpret this result in their conclusion.
20. [4 marks] "Fieldwork conclusions are only valid if the sample is large." To what extent do you agree with this statement? Use geographical enquiry concepts.
</stage3_quiz_answers_md>
O-Level Geography Quiz - Fieldwork: Answer Key
Total Marks: 40
Topic: Fieldwork
Section A: Short Answer (1–5)
Q1 [2 marks]
Answer: To apply classroom geographical concepts to real-world investigation / to collect primary data / to develop geographical skills (any one valid purpose).
Teaching note: Fieldwork in O-Level Geography (2279) Topic 1.3 lets students frame inquiries, collect and analyse data, and draw conclusions beyond textbook cases.
Marking: 1 mark for identifying fieldwork, 1 mark for valid syllabus-linked purpose.
Q2 [1 mark]
Answer: Survey / observation / measurement (e.g., using anemometer).
Teaching note: Primary data is collected first-hand by the student; contrast with secondary data from reports.
Q3 [2 marks]
Answer: A hypothesis is a testable statement or predicted relationship between variables that guides the geographical investigation.
Teaching note: E.g., "More trees lead to lower temperature." It must be falsifiable and tested with data.
Marking: 1 mark testable statement, 1 mark links to investigation.
Q4 [1 mark]
Answer: Anemometer.
Teaching note: Other instruments: thermometer (temp), sound meter (noise).
Q5 [2 marks]
Answer: To identify problems in method, timing, or questions before full data collection, saving time and improving reliability.
Teaching note: Pilot study = small trial run; helps refine sampling and instruments.
Section B: Data and Method Application (6–13)
Q6 [2 marks]
Answer: Use a bar chart with locations on x-axis and temperature on y-axis, or grouped line if time-based; one combined graph with legend.
Teaching note: Continuous comparison across 4 sites needs one graph, not separate ones. Label axes with units °C.
Marking: 1 mark graph type, 1 mark one combined + labelling.
Q7 [2 marks]
Answer: Multiply frequency of each response by its weight (+2,+1,−1,−2), sum products per amenity to get net score.
Teaching note: Weighted score reflects intensity, not just count. Positive net = overall satisfaction.
Marking: 1 mark weighting, 1 mark summing.
Q8 [3 marks]
Answer: Line graph (time-series). Labels: x-axis "Time of day", y-axis "Pedestrian count (people)". Include title and units.
Teaching note: Time on x, count on y shows trend.
Marking: 1 mark graph type, 2 marks labelling requirements.
Q9 [2 marks]
Answer: Small sample (10) from one block may not represent whole town; spatial bias reduces reliability.
Teaching note: Reliability = consistent if repeated; representativeness matters.
Q10 [3 marks]
Working: Mean = (82 + 68 + 45) ÷ 3 = 195 ÷ 3 = 65 dB.
Answer: 65 dB.
Teaching note: Mean = sum ÷ n. Units dB must be kept.
Marking: 1 mark sum, 1 mark divide, 1 mark correct value + unit.
Q11 [2 marks]
Answer: Questionnaire can reach more respondents quickly and reduce interviewer bias.
Teaching note: Interview gives depth but is slow; questionnaire is standardised.
Q12 [2 marks]
Answer: Any two: NEA temperature records, URA land use maps, Singapore census data, past year weather data.
Teaching note: Secondary = existing published data.
Q13 [3 marks]
Answer: Place measuring points at equal intervals (e.g., every 10 m) from A to E; record surface temp at each using infrared thermometer; note surface type at each point.
Teaching note: Systematic sampling = fixed interval; transect shows spatial change. Map must show A–E, north, scale.
Marking: 1 mark intervals, 1 mark instrument, 1 mark surface record.
Section C: Structured Response and Evaluation (14–20)
Q14 [2 marks]
Answer: Time/weather affect readings (e.g., sun, wind); recording them lets others judge conditions and repeat study.
Teaching note: Metadata improves reliability and context.
Q15 [3 marks]
Answer: Select paired sites with/without tree cover; measure temp at same time with thermometer; compare means; use t-test or simple difference.
Teaching note: Controlled comparison tests hypothesis.
Marking: 1 mark sites, 1 mark measurement, 1 mark comparison.
Q16 [3 marks]
Answer: Strength: accurate location, fast. Limitation: battery/ signal loss, privacy issues. Partially reliable.
Teaching note: Reliability needs consistent function.
Marking: 1 mark strength, 1 mark limit, 1 mark conclusion.
Q17 [3 marks]
Answer: Wind speed highest at Coast (18 km/h), lowest at Forest (5). Reason: Coast exposed to open sea wind; forest blocks wind.
Teaching note: Barrier effect of trees.
Marking: 1 mark pattern, 2 marks reason.
Q18 [4 marks]
Answer: Partially reliable. Strength: visual record, 20 photos give spread. Limitation: only countable items, time-bound, observer bias. Conclusion: useful but not full litter profile.
Teaching note: Evaluate with evidence from method.
Marking: 1 position, 1 strength, 1 limit, 1 synthesis.
Q19 [4 marks]
Answer: Present as mean with perhaps bar chart; interpret 4.1/5 as high attachment; note 50 sample, possible variance. Conclusion: residents feel strong place bond.
Teaching note: Mean summarises; conclusion links to sense of place aim.
Marking: 1 present, 1 interpret, 1 sample note, 1 link.
Q20 [4 marks]
Answer: Partly agree. Large sample helps representativeness but random/stratified small sample can be valid. Quality of method matters. Conclusion: size is one of several validity factors.
Teaching note: AO3 judgement; weigh sample size vs design.
Marking: 1 stance, 1 large sample point, 1 counter, 1 conclude.
</stage3_quiz_answers_md>
<stage3_quiz_md>
O-Level Geography Quiz - Fieldwork
Name: ___________________________
Class: ___________________________
Date: ___________________________
Score: ___________ / 40
Duration: 60 minutes
Total Marks: 40
Topic: Fieldwork (Geographical Methods)
Instructions:
- Answer all 20 questions.
- Section A: Short Answer (1–5)
- Section B: Data and Method Application (6–13)
- Section C: Structured Response and Evaluation (14–20)
- Use clear geographical terms. Show working where calculation is required.
Section A: Short Answer (1–5)
1. [2 marks] State one purpose of carrying out geographical fieldwork in the O-Level syllabus.
2. [1 mark] Give one example of a primary data collection method used in fieldwork.
3. [2 marks] Define the term "hypothesis" in a geographical investigation.
4. [1 mark] Name one instrument used to measure wind speed during fieldwork.
5. [2 marks] Explain why a pilot study is carried out before the main fieldwork data collection.
Section B: Data and Method Application (6–13)
6. [2 marks] A student group collected the average temperature (°C) at four locations in a neighbourhood: Park, Carpark, Field, and Block. Suggest how the temperature at the four locations could be shown on one graph.
7. [2 marks] The students used a Likert scale for amenity satisfaction: Strongly Agree = +2, Agree = +1, Disagree = −1, Strongly Disagree = −2. Describe how they could calculate the net score for each amenity from the survey responses.
8. [3 marks] Study the table below showing pedestrian count at a void deck at 3 time slots.
| Time | Count |
|---|
| 8am | 12 |
| 12pm | 25 |
| 6pm | 40 |
Suggest a suitable graph to display this data and give two labelling requirements.
9. [2 marks] A fieldwork study used a sample of 10 households in one HDB block to represent the whole town. State one reason why this sampling method may reduce reliability.
10. [3 marks] The students measured noise level (dB) at 3 sites: MRT (82), Playground (68), Library (45). Calculate the mean noise level across the three sites. Show your working.
11. [2 marks] Explain one advantage of using a questionnaire instead of an interview for fieldwork data collection.
12. [2 marks] State two types of secondary data that could support a fieldwork project on urban heat islands in Singapore.
13. [3 marks]
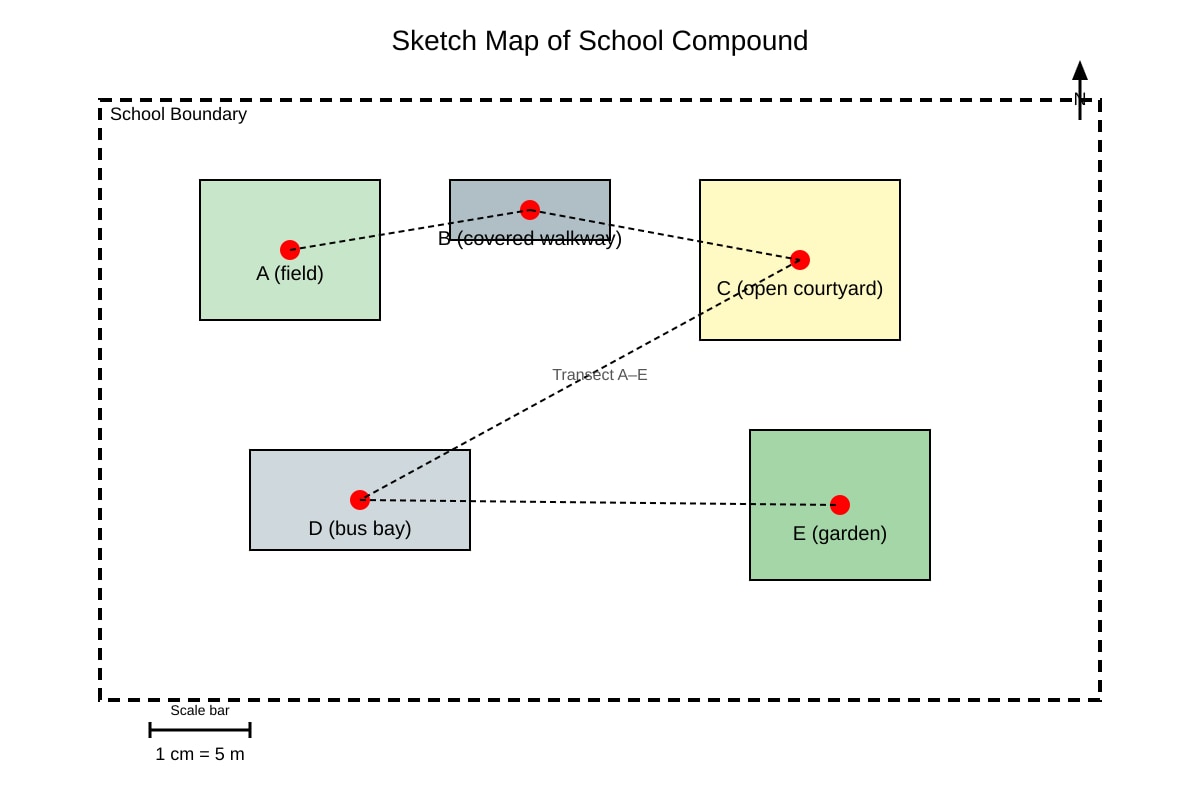
Generated map for Q13.
Using the map above, describe how systematic sampling along a transect from A to E could be carried out for surface temperature.
Section C: Structured Response and Evaluation (14–20)
14. [2 marks] Explain why documenting the exact time and weather during outdoor measurements improves data quality.
15. [3 marks] A hypothesis states: "Tree cover reduces ambient temperature in residential areas." Outline how a student could test this using fieldwork methods.
16. [3 marks] Evaluate whether using a mobile phone app for GPS tracking is reliable for mapping pedestrian routes. Give one strength and one limitation.
17. [3 marks] Study the bar chart description below.
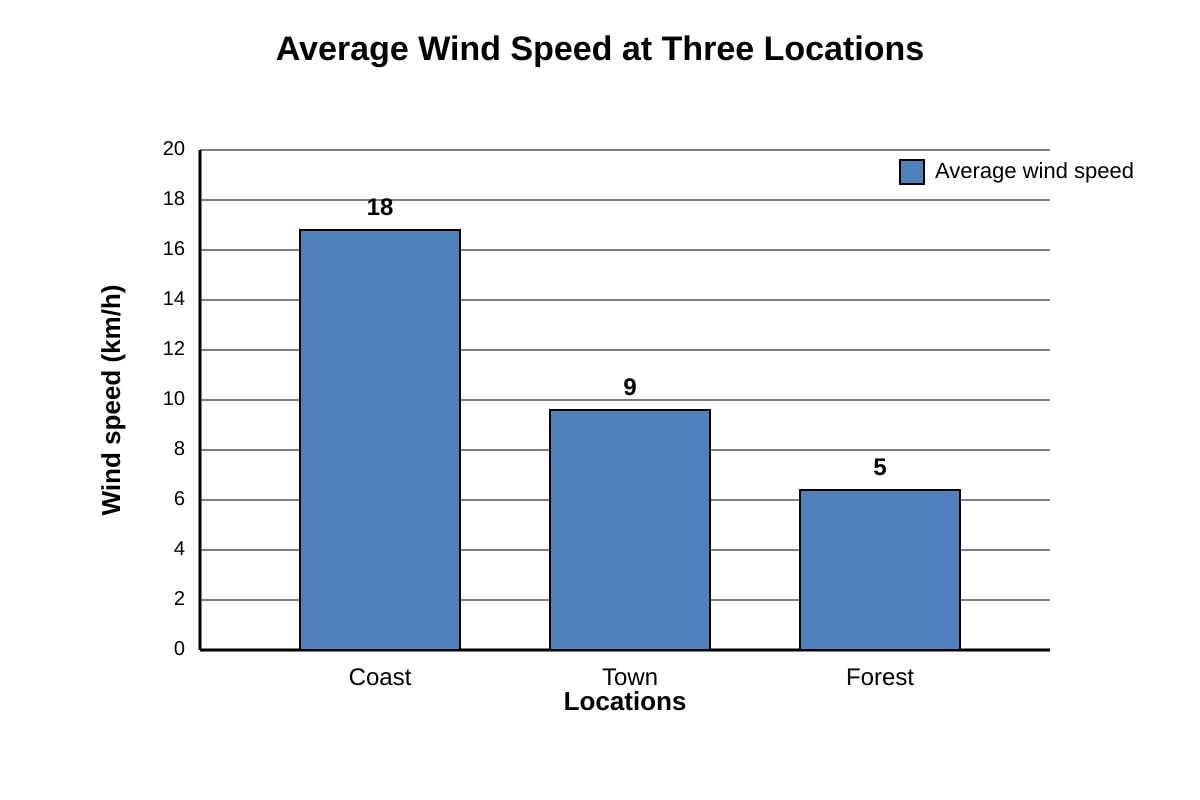
Generated chart for Q17.
Describe the pattern shown and suggest one reason for the difference between Coast and Forest.
18. [4 marks] For a fieldwork study on litter in a park, students collected 20 photographs and counted items in each. Evaluate whether this method gives reliable data. Use evidence from the method.
19. [4 marks] A group assessed sense of place by asking 50 residents to score attachment from 1 (low) to 5 (high). They reported a mean of 4.1. Explain how the students should present and interpret this result in their conclusion.
20. [4 marks] "Fieldwork conclusions are only valid if the sample is large." To what extent do you agree with this statement? Use geographical enquiry concepts.