AI Generated Exam Paper
O Level Geography Practice Paper 2
Free O Level Geography Practice Paper 2, HY3 AI version, with questions, answers, and O Level-style practice for Singapore students.
These static practice materials are generated from the site's syllabus and paper-generation workflow, with source and model context shown so students and parents can evaluate the material before use.
Questions
TuitionGoWhere Practice Paper - Geography O-Level
TuitionGoWhere Practice Paper (AI) — Version 2 of 5
Subject: Geography
Level: O-Level
Paper: Practice Paper (Map Graph Data Skills Focus)
Duration: 1 hour 15 minutes
Total Marks: 50
Name: ________________________
Class: ____________
Date: ____________
Instructions:
- This practice paper tests geographical map, graph, and data skills based on the O-Level syllabus (2279).
- Answer all questions in the spaces provided.
- Calculators are permitted.
- Show your working where calculation is required.
- Section marks and question marks add up to 50.
Section A: Data Representation and Basic Interpretation (Questions 1–6) [12 marks]
1. The students collected the average monthly temperature at four weather stations in Singapore. Suggest how the average monthly temperature at the four stations could be shown on one graph. [3]
2. Study the table below showing visitor numbers to a park.
| Month | Visitors |
|---|---|
| Jan | 1200 |
| Feb | 1500 |
| Mar | 1800 |
Calculate the mean number of visitors for the three months. [2]
Mean = __________
3. A map shows the location of five hawker centres using dots. State one advantage of showing this information on a map rather than in a table. [1]
4. The students measured noise level (dB) at three sites: A = 65, B = 72, C = 58. Suggest a suitable graph to compare these three sites and give one labelling requirement. [2]
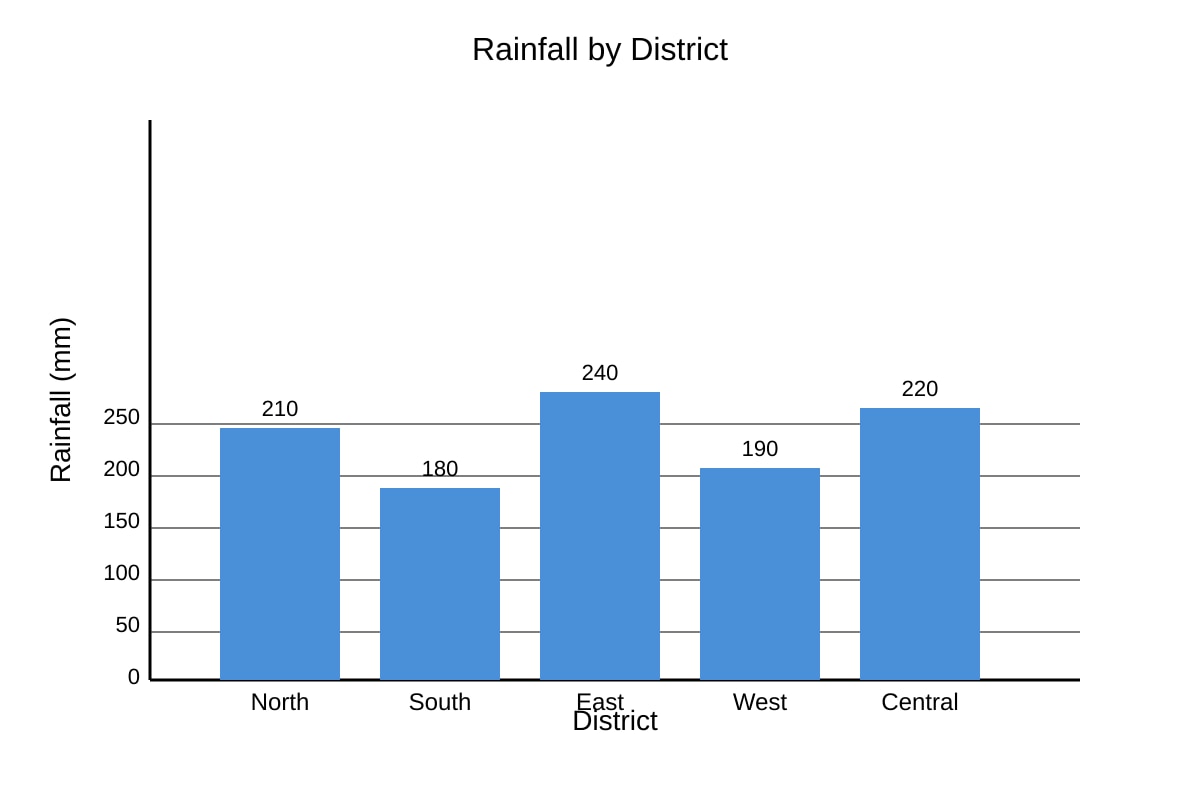
5. Study the bar chart described below.
Image pending generation: chart for 5.
State which district had the highest rainfall. [1]
6. Describe how the students could calculate a positive and negative score for park amenities using a Likert scale where Strongly Agree = +2, Agree = +1, Disagree = –1, Strongly Disagree = –2, given the response frequencies in Table 3. [3]
Table 3: Responses for "Clean toilets"
- Strongly Agree: 10
- Agree: 5
- Disagree: 3
- Strongly Disagree: 2
Section B: Graph and Map Analysis (Questions 7–13) [20 marks]
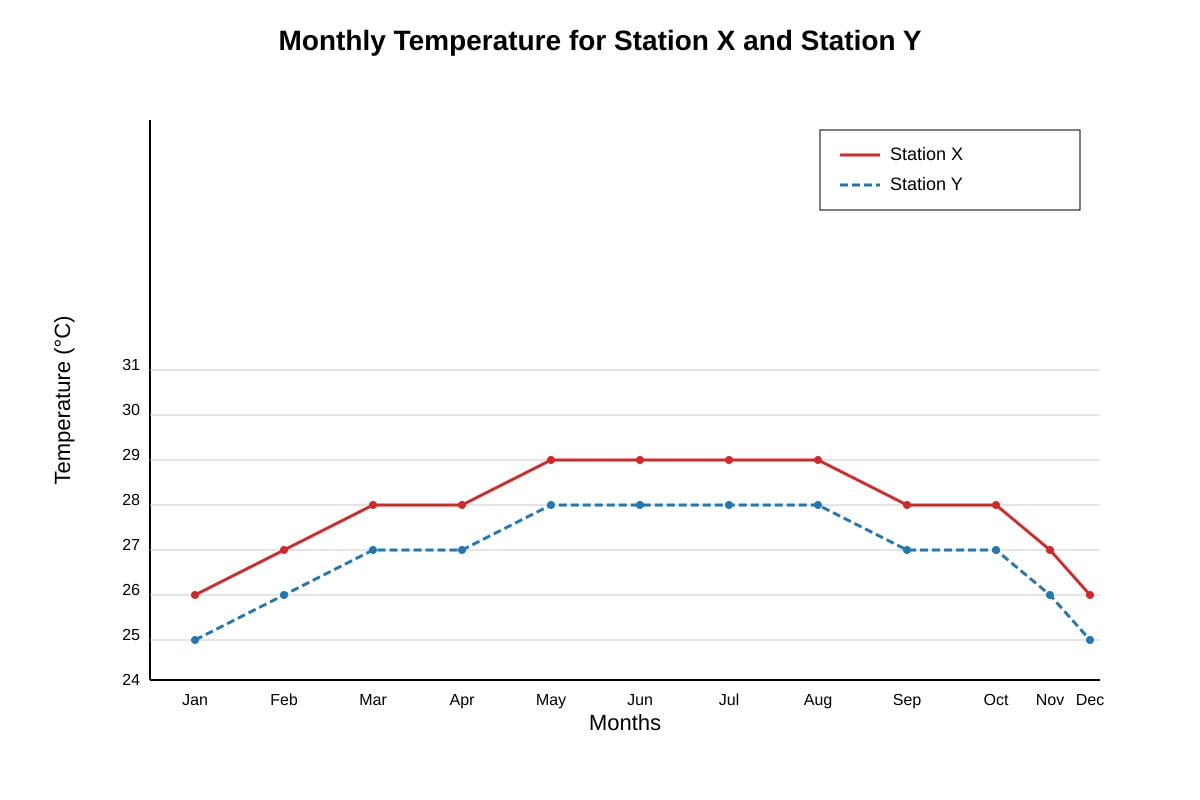
7. Study the line graph described below.
Image pending generation: graph for 7.
Describe the temperature trend for Station X from January to July. [2]
8. Using the graph in Q7, calculate the difference in mean temperature between Station X and Station Y for the year. [3]
Difference = __________ °C
9. A student drew a pie chart to show land use: Housing 50%, Industry 30%, Green space 20%. State one rule for drawing a correct pie chart. [1]
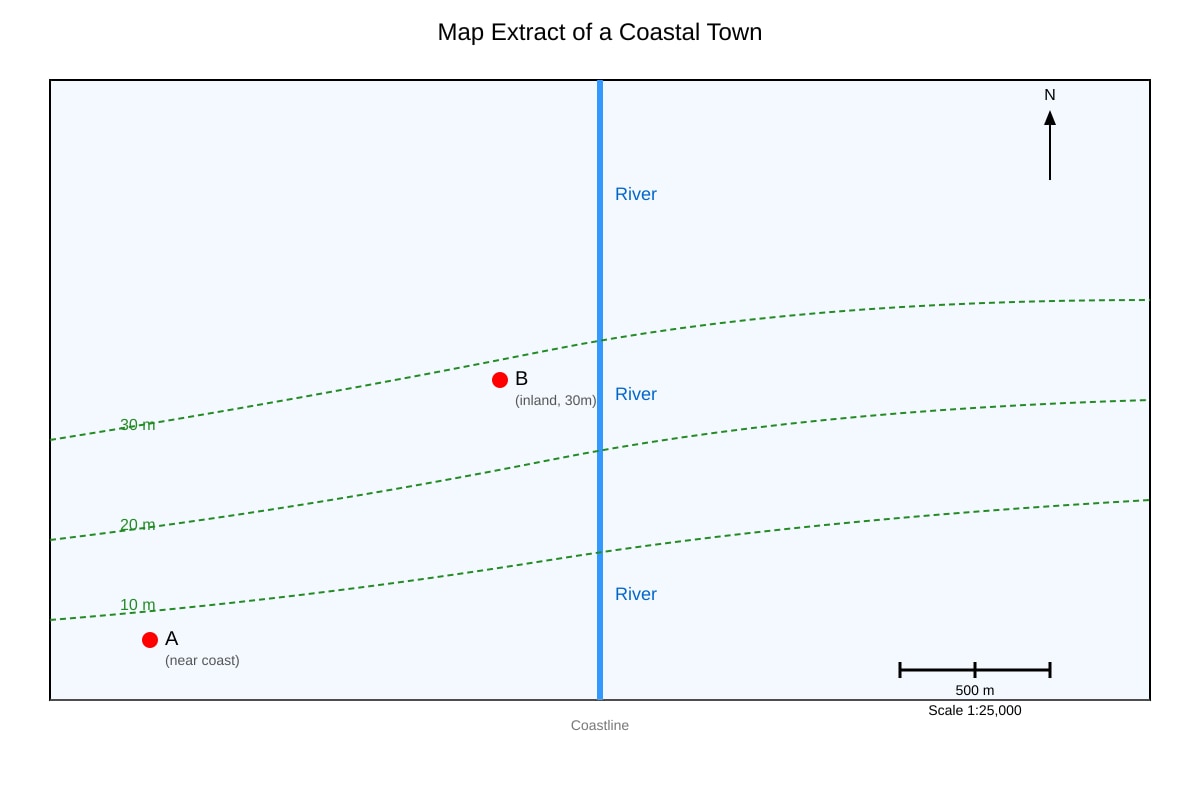
10. Study the map extract described below.
Image pending generation: map for 10.
State the compass direction of B from A. [1]
11. Using the map in Q10, explain one way contour lines help a geographer understand the terrain. [2]
12. Study Table 4 showing population density (people/km²) of three regions.
| Region | Density |
|---|---|
| R1 | 4000 |
| R2 | 2500 |
| R3 | 1000 |
Calculate the range of population density. [2]
Range = __________
13. A scatter graph shows a positive correlation between distance from city and air quality index. Explain what this suggests geographically. [3]
Section C: Evaluation and Higher-Order Data Skills (Questions 14–20) [18 marks]
14. For the study described in Q6 (amenity scores), evaluate whether the data collection using a Likert survey of 20 students is reliable. [4]
15. A geography class tested the hypothesis: "Traffic volume decreases with distance from the MRT station." They counted vehicles at 10m, 50m, 100m, 200m using hand tally for 10 minutes each. Evaluate the effectiveness of their methodology. [6]
16. Explain how GIS could be used to investigate urban heat islands in Singapore. Discuss one advantage and one limitation. [5]
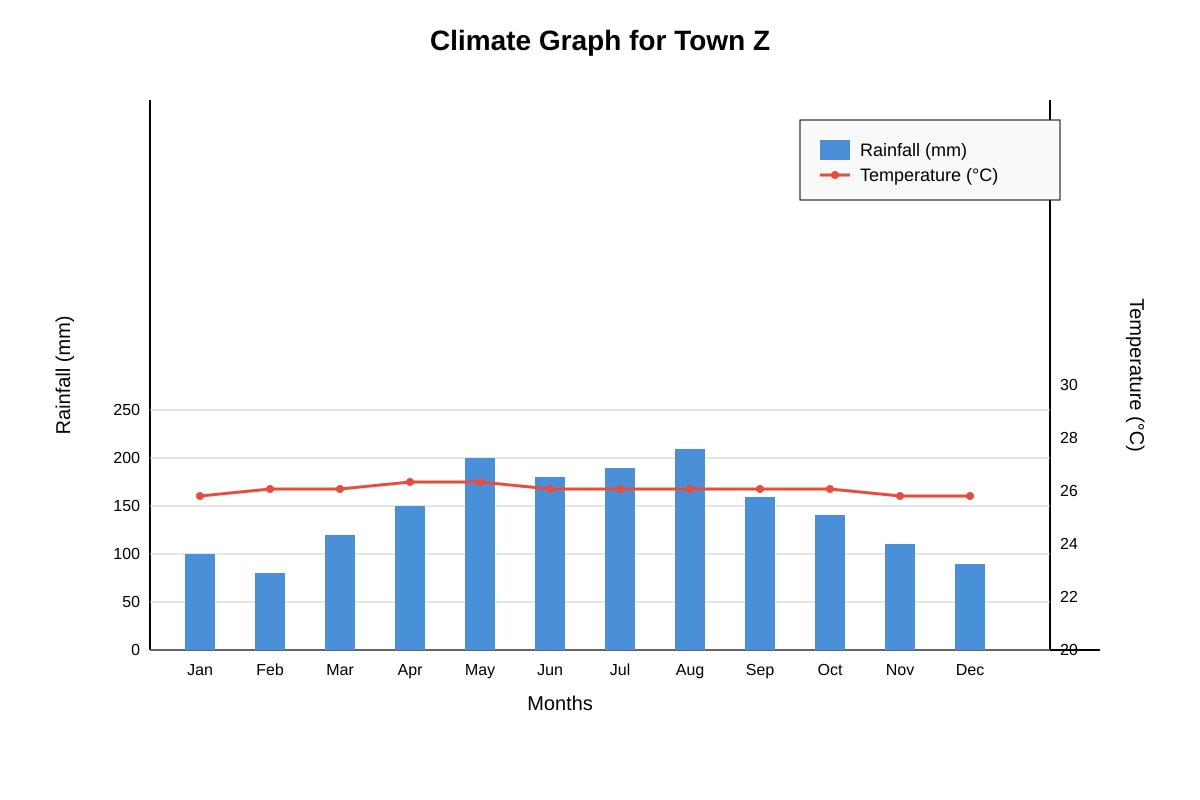
17. Study the climate graph described below.
Image pending generation: graph for 17.
Calculate the total annual rainfall and describe the temperature pattern. [4]
Total rainfall = __________ mm
Description: ___________________________________________________
18. A newspaper claims: "The bar chart proves that East district is always wetter than West." Using the data from Q5, explain why this conclusion may be weak. [3]
19. Students used a mobile app to record GPS locations of litter. Suggest two ways they could present this data on a map. [2]
20. Study the table of wind speed (km/h) at 3 sites over 2 days.
| Site | Day 1 | Day 2 |
|---|---|---|
| S1 | 12 | 15 |
| S2 | 9 | 11 |
| S3 | 14 | 13 |
Calculate the mean wind speed for Site S1 and suggest a graph to show all sites across both days. [4]
Mean S1 = __________ km/h
Graph suggestion: ___________________________________________________
End of Practice Paper
Answers
TuitionGoWhere Practice Paper Answer Key — Geography O-Level (Version 2)
Subject: Geography
Level: O-Level
Paper: Practice Paper (Map Graph Data Skills)
Total Marks: 50
Section A Answers (12 marks)
Q1 [3 marks]
- Suggestion: Use a line graph or grouped bar chart with months on x-axis and temperature on y-axis, one line/bar group per station. [1]
- Justification: Allows direct comparison of trends across four stations on one graph. [1]
- Requirement: Label axes (months, °C), include legend for stations. [1]
Teaching note: Continuous data over time → line graph; categorical comparison → bar. Avoid separate graphs (common trap).
Q2 [2 marks]
Mean = (1200 + 1500 + 1800) ÷ 3 = 4500 ÷ 3 = 1500 visitors. [2 for correct calc]
Working: Sum = 4500; ÷3 = 1500.
Q3 [1 mark]
Advantage: Shows spatial pattern/location at a glance (e.g., clustering, distribution) which table cannot. [1]
Q4 [2 marks]
- Suitable graph: Bar chart. [1]
- Labelling: Title, x-axis "Site", y-axis "Noise level (dB)", bars labelled A/B/C. [1]
Q5 [1 mark]
East (240 mm). [1]
Q6 [3 marks]
Positive score = (10×2) + (5×1) = 20 + 5 = 25. [1]
Negative score = (3×1) + (2×2) = 3 + 4 = 7. [1]
Net method: Multiply frequency by weight, sum positives and negatives separately. [1]
Section B Answers (20 marks)
Q7 [2 marks]
Temperature rises from 26°C (Jan) to 29°C (Jul) [1]; generally increasing trend with peak mid-year. [1]
Q8 [3 marks]
Station X mean = (26+27+28+28+29+29+29+29+28+28+27+26)÷12 = 336÷12 = 28.0°C. [1]
Station Y mean = (25+26+27+27+28+28+28+28+27+27+26+25)÷12 = 318÷12 = 26.5°C. [1]
Difference = 28.0 – 26.5 = 1.5°C. [1]
Q9 [1 mark]
Slices must sum to 100% (or 360°) of circle. [1]
Q10 [1 mark]
B is west (or northwest) of A (inland from coast, contour implies inland direction). [1]
Q11 [2 marks]
Contour lines show elevation and slope steepness [1]; closer lines = steeper slope, helping identify highlands/valleys. [1]
Q12 [2 marks]
Range = 4000 – 1000 = 3000 people/km². [2]
Q13 [3 marks]
Suggests air quality improves (index better) farther from city [1]; likely due to less traffic/industry [1]; spatial association between urban core and pollution. [1]
Section C Answers (18 marks)
Q14 [4 marks]
Position: Partially reliable. [1]
Evidence: Small sample (20 students) limits representativeness. [1]
Method: Likert scale gives quantifiable scores, structured. [1]
Qualification: Could be reliable for that school but not generalisable. [1]
Q15 [6 marks]
Effective: Systematic distances reduce bias. [1] Tally is simple, low cost. [1]
Limitations: 10 min may miss peak hours. [1] No repeat days. [1] Only one road? [1]
Conclusion: Partially effective; improve with longer count, multiple days. [1]
Q16 [5 marks]
GIS overlays land cover, built-up, temperature sensors. [2]
Adv: Visualises hotspots, processes data fast. [1]
Limit: Needs accurate input, training. [1]
(Structure: use+adv+limit = 5)
Q17 [4 marks]
Total rain = 100+80+120+150+200+180+190+210+160+140+110+90 = 1730 mm. [2]
Temp: Stable around 26–28°C, small variation. [2]
Q18 [3 marks]
Only one period shown [1]; "always" needs long-term data [1]; West may vary seasonally. [1]
Q19 [2 marks]
Dot map of litter locations [1]; heat map of density. [1]
Q20 [4 marks]
Mean S1 = (12+15)÷2 = 13.5 km/h. [2]
Graph: Grouped bar chart (sites on x, days as groups) or line graph. [2]
Total marks awarded max = 50. Matches paper.
Free quiz and exam paper access
Enter your details to view this paper
Your access is remembered on this device.