From Real Exams Exam Paper
O Level Geography Practice Paper 3
Free O Level Geography Practice Paper 3, HY3 Exam version, with questions, answers, and O Level-style practice for Singapore students.
These static practice materials are generated from the site's syllabus and paper-generation workflow, with source and model context shown so students and parents can evaluate the material before use.
Questions
TuitionGoWhere Exam Practice (AI) - Geography O-Level
Practice Paper: Map, Graph & Data Skills (Version 3)
School: TuitionGoWhere Secondary School (AI)
Subject: Geography
Level: O-Level
Paper: Practice Paper (Map Graph Data Skills)
Version: 3 of 5
Duration: 60 minutes
Total Marks: 60
Name: ___________________________
Class: ______________
Date: ______________
Instructions:
- Answer all questions in the spaces provided.
- This paper tests map, graph, and data skills based on O-Level Geography exam patterns.
- Use the data, maps, and figures provided to support your answers.
- Calculators are allowed.
Section A: Data Representation and Graph Interpretation (Questions 1–7) [21 marks]
1. The students collected the average monthly rainfall at four weather stations (A, B, C, D) in a river basin. Suggest how the average monthly rainfall at the four stations could be shown on one graph. [3]
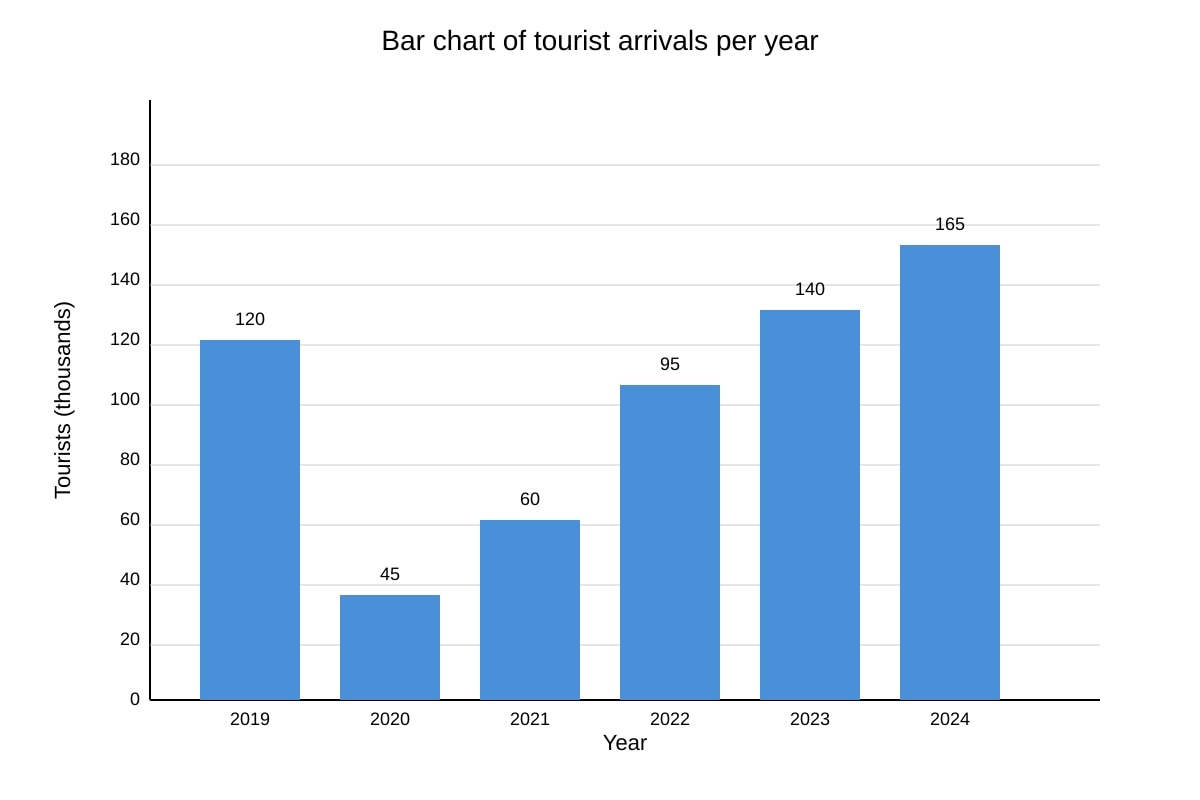
2. Study the bar chart below showing the number of tourists visiting a heritage site from 2019 to 2024.
Image pending generation: graph for Q2.
State the trend in tourist numbers from 2019 to 2024. [2]
3. A field study recorded the temperature (°C) at 2-hour intervals from 06:00 to 18:00 at one location. Suggest a suitable graph to display the data and give one reason. [2]
4. The table below shows the land use (%) in three districts.
| District | Residential | Commercial | Industrial | Green |
|---|---|---|---|---|
| X | 45 | 20 | 15 | 20 |
| Y | 30 | 35 | 10 | 25 |
| Z | 55 | 10 | 20 | 15 |
Suggest how this data could be presented on one graph. [3]
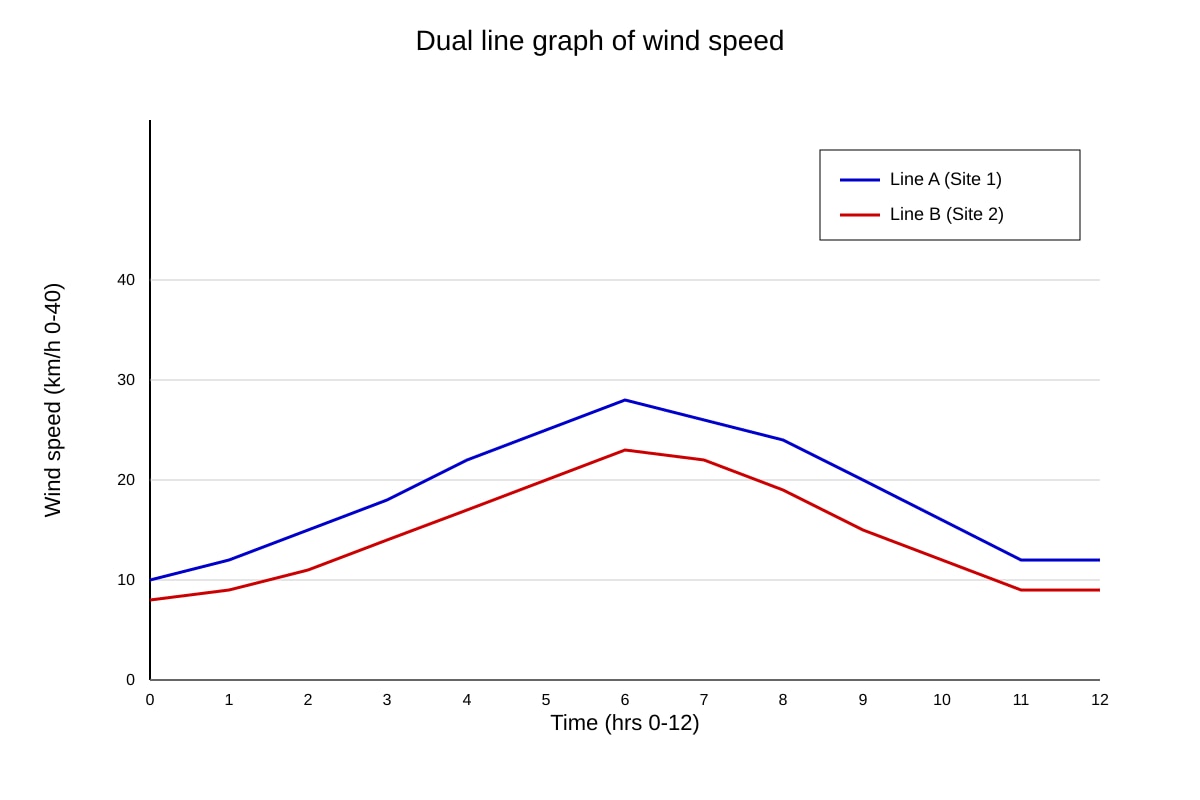
5. Study the line graph of wind speed (km/h) at two coastal sites over 12 hours.
Image pending generation: graph for Q5.
At what time did Site 1 reach its maximum wind speed? [1]
6. Describe one advantage of using a pie chart instead of a bar chart for showing the proportion of household waste types. [2]
7. The students measured pedestrian count at five street corners. Suggest how they could show both the count and the location on a single map. [3]
Section B: Data Calculation and Reliability (Questions 8–14) [21 marks]
8. A survey used a Likert scale: Strongly Agree = +2, Agree = +1, Disagree = −1, Strongly Disagree = −2. For amenity P, the responses were: Strongly Agree 10, Agree 5, Disagree 3, Strongly Disagree 2. Calculate the net score. [2]
Working: ___________________________________________________
Answer: ___________________________________________________
9. Using the table below, describe how the students could calculate positive and negative scores for each amenity. [2]
| Amenity | Strongly Agree | Agree | Disagree | Strongly Disagree |
|---|---|---|---|---|
| Park | 12 | 8 | 4 | 1 |
| Library | 9 | 10 | 5 | 3 |
10. The students collected water pH at 3 sites, each tested 2 times: Site A (6.8, 7.0), Site B (7.2, 7.1), Site C (6.5, 6.7). Calculate the mean pH for Site A. [1]
Working: ___________________________________________________
Answer: ___________________________________________________
11. For the study in Q10, evaluate whether the data collection is reliable. [4]
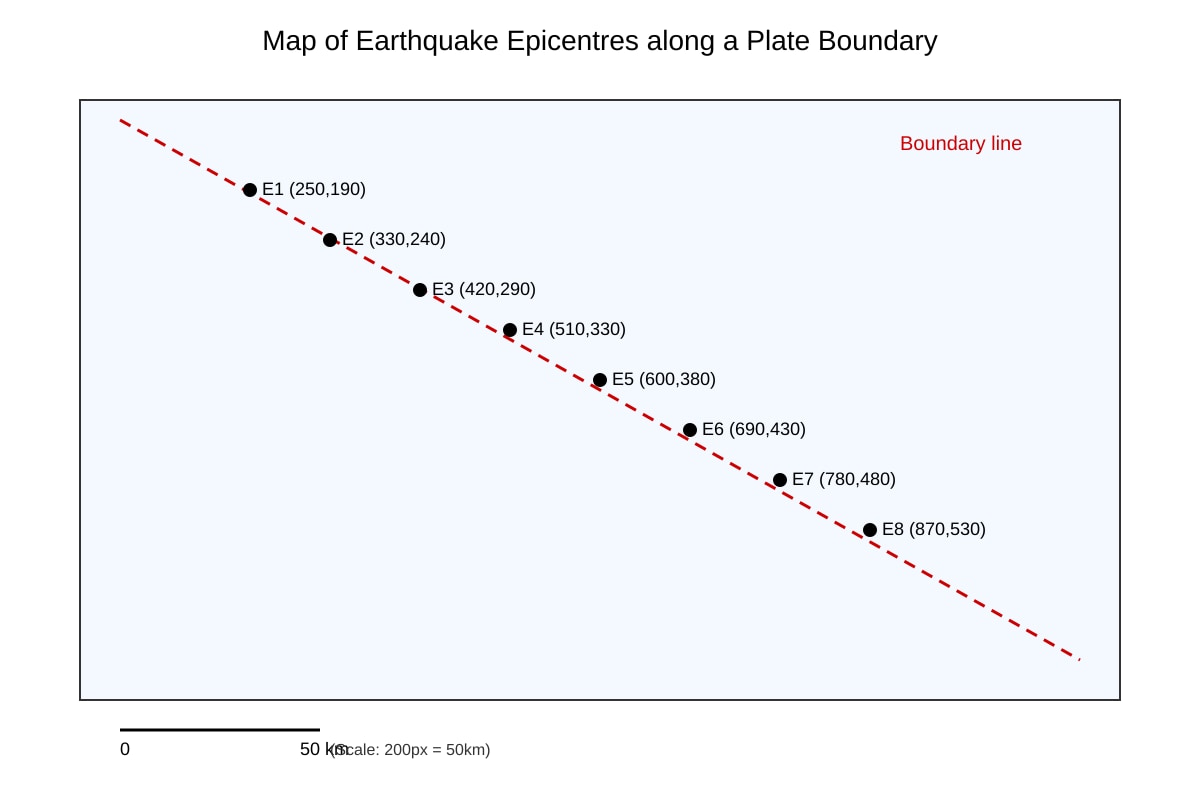
12. A map shows earthquake epicentres along a plate boundary.
Image pending generation: map for Q12.
State the spatial pattern of the earthquakes. [2]
13. Given the rainfall data (mm) for 5 days: 0, 5, 12, 5, 0. Calculate the total weekly rainfall and the mean daily rainfall. [2]
Working: ___________________________________________________
Answer: ___________________________________________________
14. A student says: "The sample of 5 households is reliable for estimating recycling habits of the town." Evaluate this statement. [3]
Section C: Map and Figure Analysis (Questions 15–20) [18 marks]
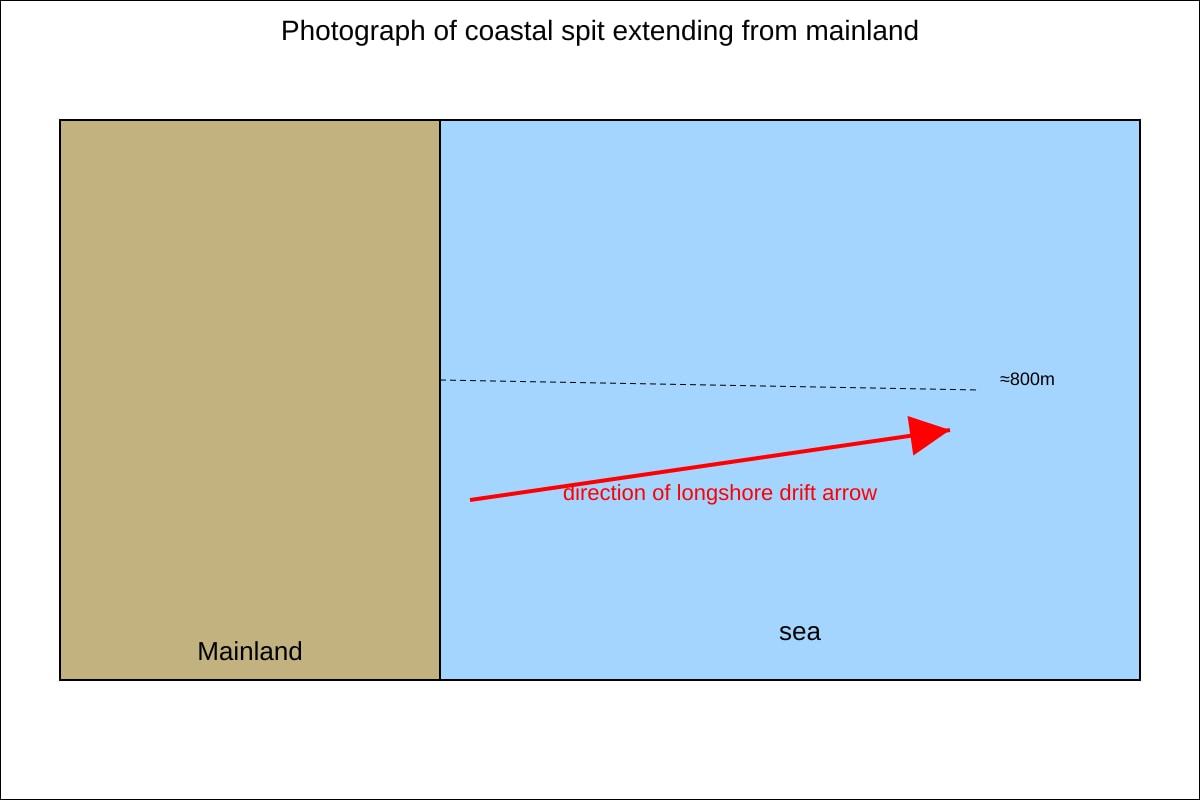
15. Study the photograph of a coastal spit.
Image pending generation: figure for Q15.
Describe two features of the spit visible in the photograph. [2]
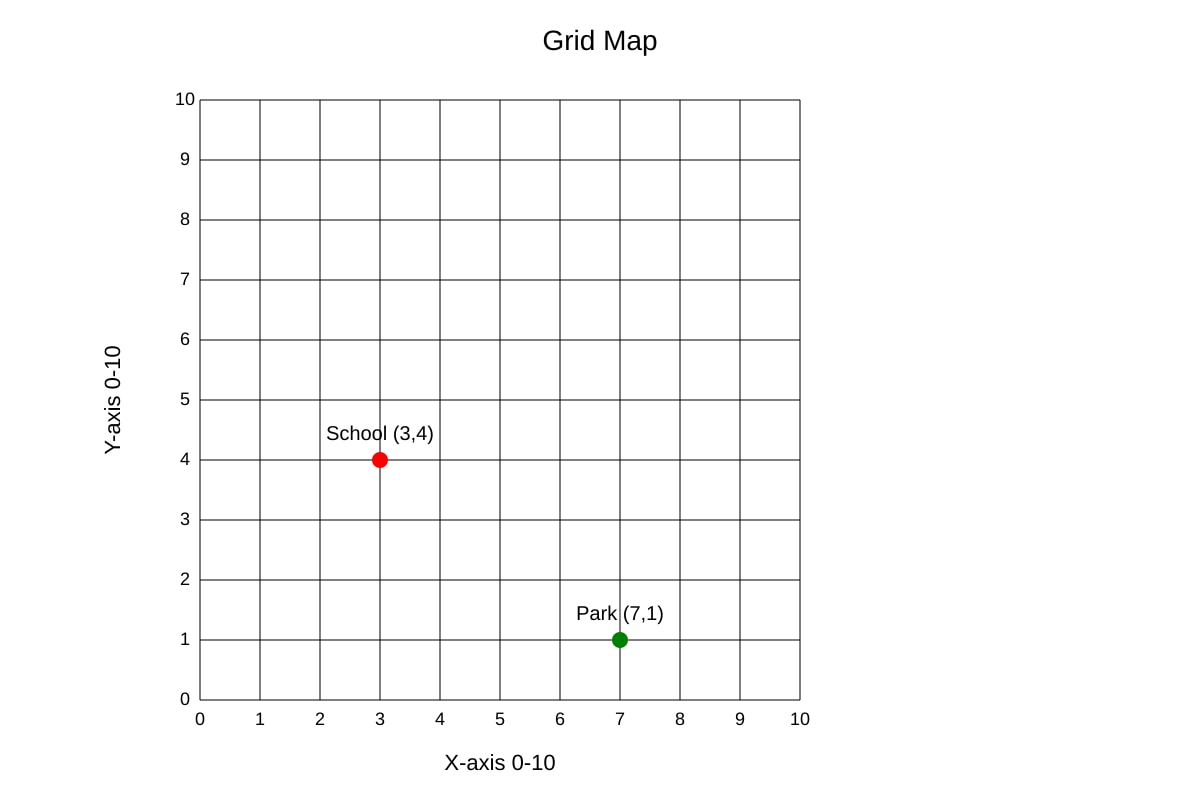
16. On the grid map below, the school is at (3,4) and the park at (7,1). Calculate the straight-line distance if each grid square = 100 m. [2]
Image pending generation: map for Q16.
Working: ___________________________________________________
Answer: ___________________________________________________
17. The graph shows population growth of two towns.
Image pending generation: graph for Q17.
Compare the growth trend of Town A and Town B. [3]
18. A table lists temperature and rainfall for 4 months. Suggest how to show the relationship between temperature and rainfall on one graph. [3]
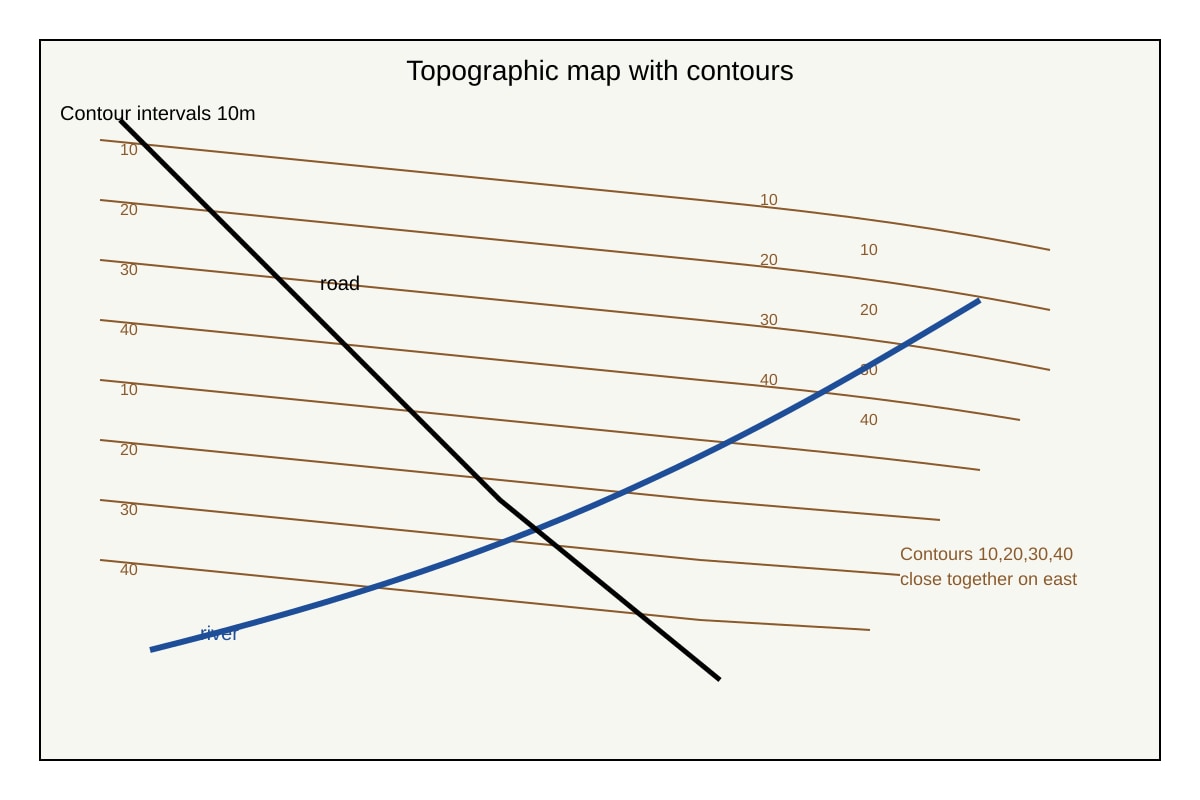
19. Study the OS map extract with contour lines.
Image pending generation: map for Q19.
State the direction of the river flow and one evidence from contours. [2]
20. The students recorded noise level (dB) at 3 locations: Near road 75, Park 50, Market 80. Suggest how to display this for comparison. [3]
Total Marks: 60
Answers
TuitionGoWhere Exam Practice (AI) - Geography O-Level
Practice Paper: Map, Graph & Data Skills (Version 3) - Answer Key
Section A: Data Representation and Graph Interpretation (21 marks)
1. [3 marks]
Answer: Use a single line graph with months on x-axis and rainfall (mm) on y-axis; plot four lines (one per station) with a clear legend (A, B, C, D).
Teaching: A line graph compares trends over time for multiple sites. Marks: 1 for graph type, 1 for axes/labeling, 1 for legend/multiple lines. Common mistake: separate graphs.
2. [2 marks]
Answer: Tourist numbers fell sharply in 2020 (to 45k), then rose steadily to 165k in 2024, exceeding 2019 level.
Teaching: Read bars: 2019=120, 2020=45 (drop), 2021=60, 2022=95, 2023=140, 2024=165. Marks: 1 for decline noted, 1 for recovery/increase.
3. [2 marks]
Answer: Line graph; reason: shows continuous change over time (2-hour intervals).
Teaching: Time-series data → line graph. Marks: 1 type, 1 reason.
4. [3 marks]
Answer: Stacked bar chart (or grouped bar) with districts on x-axis, % on y-axis, categories as segments/colors with legend.
Teaching: Compares composition. Marks: 1 graph choice, 1 axes, 1 legend/categories.
5. [1 mark]
Answer: 08:00 (hour 8) where value 28 km/h peak.
Teaching: Line A peaks at 28 at 8th interval.
6. [2 marks]
Answer: Pie chart shows proportion of whole directly (e.g., 40% plastic). Marks: 1 advantage, 1 elaboration.
7. [3 marks]
Answer: Use a base map with dots/circles sized by count at each corner; or choropleth if zones. Marks: 1 map base, 1 symbol size, 1 location label.
Section B: Data Calculation and Reliability (21 marks)
8. [2 marks]
Working: (+2×10)+(+1×5)+(-1×3)+(-2×2)=20+5-3-4=18.
Answer: 18.
Teaching: Weighted sum. Marks: 1 working, 1 answer.
9. [2 marks]
Answer: Positive = (SA×2)+(A×1); Negative = (D×1)+(SD×2); net = positive - negative per amenity.
Teaching: Same as template 3.
10. [1 mark]
Working: (6.8+7.0)/2=6.9. Answer: 6.9.
11. [4 marks]
Answer: Partially reliable. Evidence: only 2 tests per site, small sample. But consistent (close values). Counter: more repeats needed.
Marks: 1 position, 2 evidence, 1 qualification.
12. [2 marks]
Answer: Earthquakes clustered along plate boundary within 50 km.
Marks: 1 cluster, 1 boundary link.
13. [2 marks]
Working: Total=0+5+12+5+0=22 mm; Mean=22/5=4.4 mm. Answer: 22 mm, 4.4 mm/day.
14. [3 marks]
Answer: Not reliable; sample size 5 too small for town; bias likely. But cheap. Marks: 1 reject, 2 reason.
Section C: Map and Figure Analysis (18 marks)
15. [2 marks]
Answer: Narrow elongated landform; attached to mainland, extends into sea. Marks: 1 each.
16. [2 marks]
Working: Δx=4, Δy=3, dist=√(4²+3²)=5 squares ×100 m=500 m. Answer: 500 m.
17. [3 marks]
Answer: Both increase; B grows faster after 2010, catches up. Marks: 1 both rise, 2 comparison.
18. [3 marks]
Answer: Dual-axis line graph (temp left, rain right) or scatter. Marks: 1 type, 1 axes, 1 label.
19. [2 marks]
Answer: River flows downhill; contours close = steep east. Marks: 1 direction, 1 evidence.
20. [3 marks]
Answer: Bar chart with locations on x, dB on y. Marks: 1 type, 1 axes, 1 labels.
Total: 60 marks
Free quiz and exam paper access
Enter your details to view this paper
Your access is remembered on this device.