AI Generated Quiz
O Level Biology Ecology Quiz
Free O Level Biology Ecology quiz, HY3 AI version, with questions, answers, and O Level-style practice for Singapore students.
These static practice materials are generated from the site's syllabus and paper-generation workflow, with source and model context shown so students and parents can evaluate the material before use.
Questions
Free quiz and exam paper access
Enter your details to view this paper
Your access is remembered on this device.
Answers
O-Level Biology Quiz - Ecology (Answer Key)
Total Marks: 40
Syllabus-first practice content from LLM-inferred templates. Not past-year derived.
1. B [1]
Teaching note: An ecosystem includes all living (biotic) and non-living (abiotic) things in an area and their interactions. A is a population; C is only abiotic; D is a simplified food chain.
2. B [1]
Teaching note: Biotic = living. Climate, rock are abiotic (non-living).
3. B [1]
Teaching note: Biomass pyramid shows less biomass at higher trophic levels due to energy loss (~10% transfer).
4. C [1]
Teaching note: Photosynthesis uses CO₂ + H₂O → glucose + O₂, removing CO₂. Respiration and combustion release CO₂.
5. B [1]
Teaching note: Population = same species in a habitat. Community = all species.
6. [2] Any two: temperature, light intensity, soil pH, rainfall, wind.
(1 mark each)
Teaching note: Abiotic factors are non-living physical/chemical factors.
7. [2] Food chain = single linear sequence of feeding; food web = many interconnected food chains. (1+1)
Teaching note: Web shows complexity and alternative food sources.
8. [2] Decomposers break down dead organisms/waste, releasing minerals (e.g., nitrates) back to soil for plants.
Teaching note: Without decomposers, nutrients locked in dead matter.
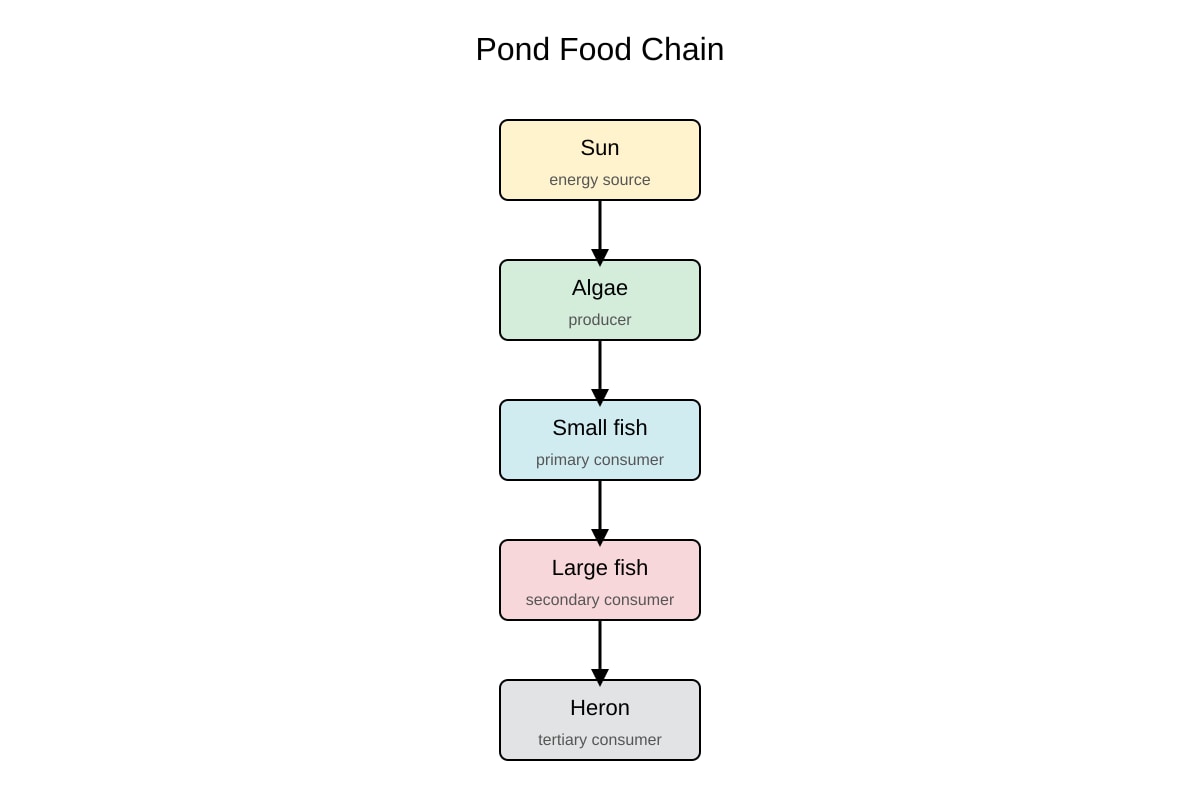
9. [1+1] Small fish = primary consumer. Heron = tertiary consumer.
Teaching note: Algae(producer)→small fish(1° consumer)→large fish(2° consumer)→heron(3°).
10. [2] (any two) heat loss from respiration, undigested material, movement energy, not all eaten. (1 each)
Teaching note: ~90% energy lost per level, only ~10% stored as biomass.
11. [2] Habitat = place where an organism lives / environment providing food, shelter, conditions.
Teaching note: Define with organism-environment link.
12. [3] Fertiliser runoff → nitrates in lake → algal bloom → algae die → decomposers respire using O₂ → fish die (eutrophication). (1 mark each stage)
Teaching note: Mark for nitrate entry, bloom, oxygen depletion via decomposition.
13. [2] Deforestation, urbanisation, pollution, overfishing. (1 each)
Teaching note: These reduce species habitats / numbers.
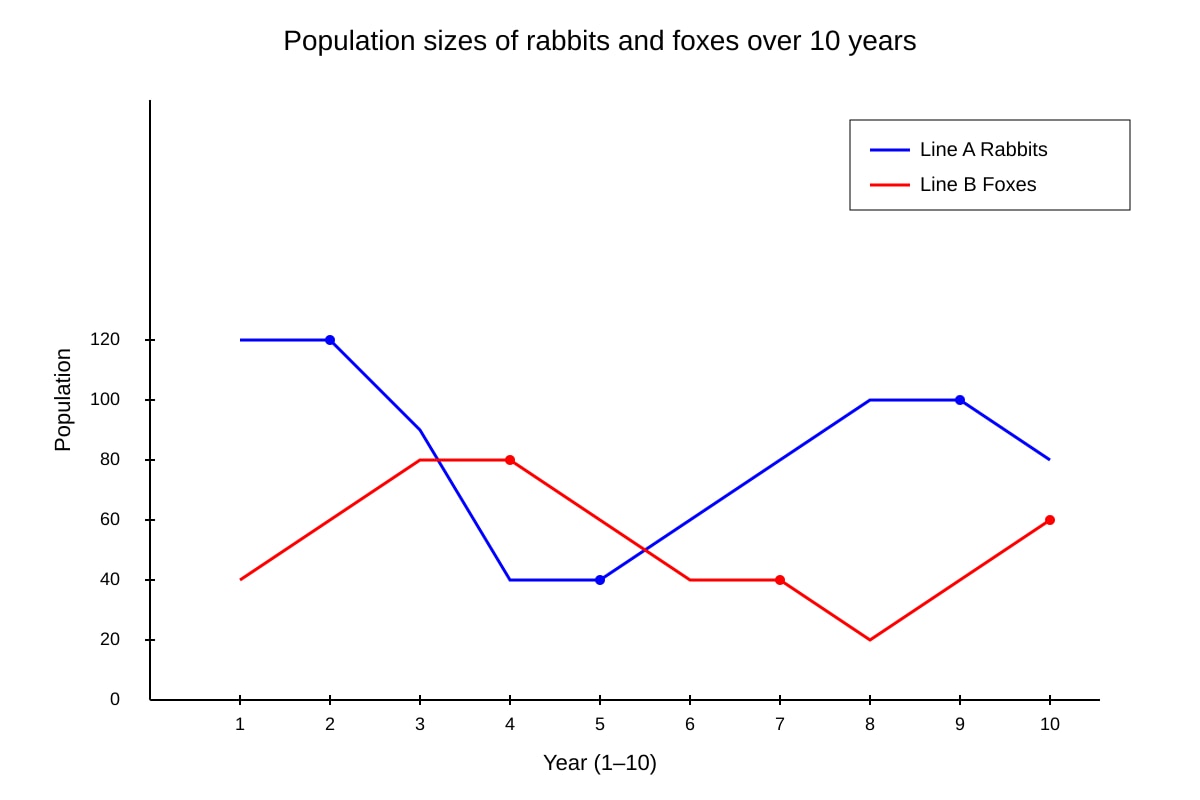
14. [3] Rabbit population rises first, then fox follows (lag); when rabbits fall, foxes fall later; cycles repeat. (1 for lag, 1 for inverse follow, 1 for cycle)
Teaching note: Predator-prey relationship; foxes depend on rabbits.
15. [2] Site W (biotic index 8). Reason: high mayfly count indicates clean, oxygenated water; mayflies sensitive to pollution. (1+1)
Teaching note: Biotic index higher = cleaner.
16. [4] Nitrogen fixation by bacteria (e.g., Rhizobium) converts N₂ → ammonia/nitrates [1]; nitrifying bacteria convert ammonia → nitrites → nitrates [1]; plants absorb nitrates [1]; decomposers return N to soil [1]. (or denitrifying bacteria mentioned)
Teaching note: Two bacteria groups required: e.g., Rhizobium, Nitrosomonas.
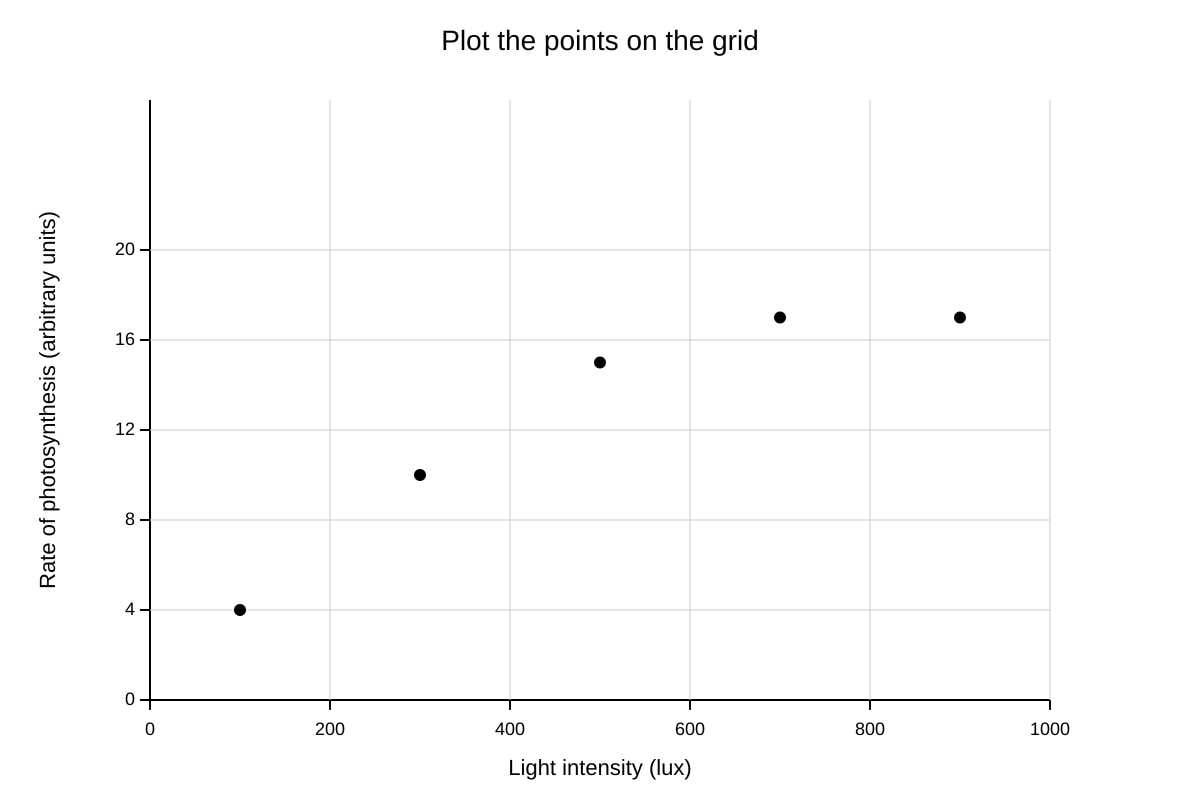
17. [3] Plot 5 points correctly [1]; rate increases with light then plateaus [1]; light saturates at 700 lux [1].
Teaching note: Show on provided grid; plateau = light no longer limiting.
18. [3] Biodiversity = variety of species / genes / habitats [1]; stability via varied roles, resilience to change [2].
Teaching note: More diverse = better functioning after disturbance.
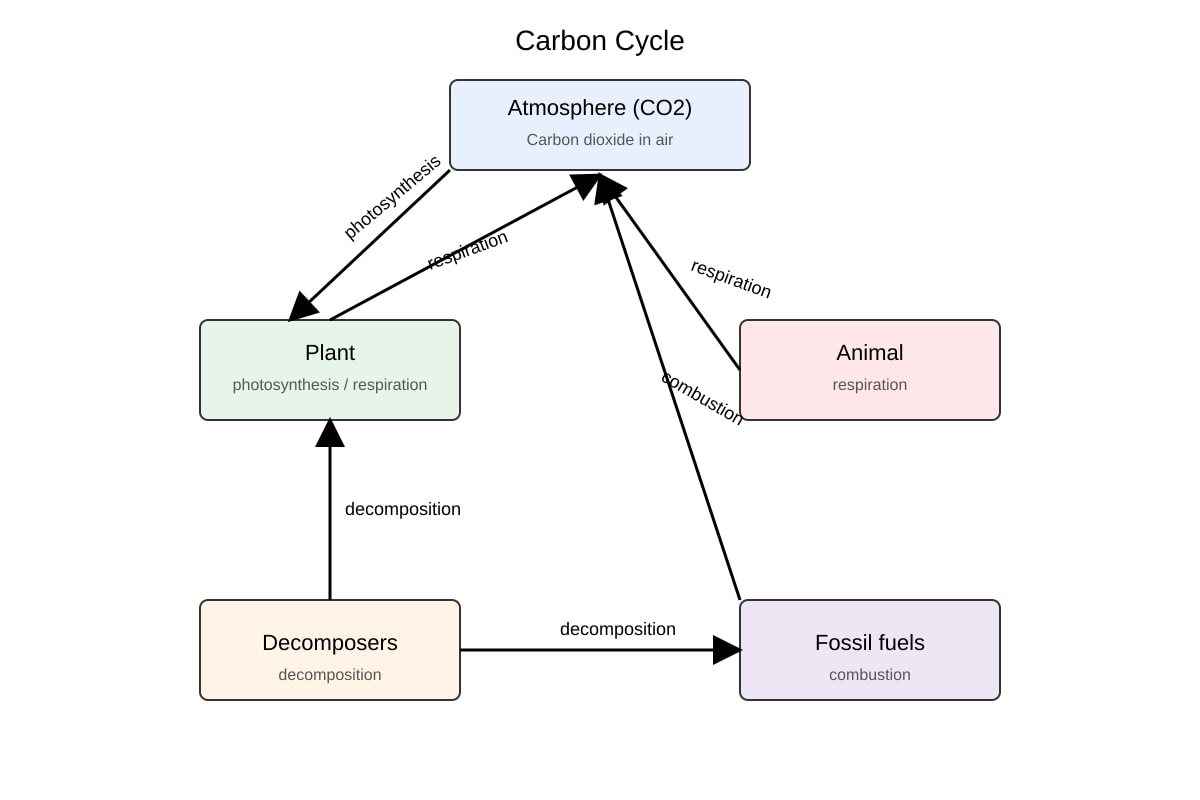
19. [2] Respiration, combustion (also decomposition). (1 each)
Teaching note: From diagram arrows to atmosphere.
20. [4] Effects: loss of habitat, reduced biodiversity, soil erosion, CO₂ rise. Explain one: e.g., clearing removes producer base → animals lose food/shelter. (2 for effects, 2 for explanation)
Teaching note: Link to ecosystem structure.