From Real Exams Quiz
O Level Biology Ecology Quiz
Free O Level Biology Ecology quiz, HY3 Exam version, with questions, answers, and O Level-style practice for Singapore students.
These static practice materials are generated from the site's syllabus and paper-generation workflow, with source and model context shown so students and parents can evaluate the material before use.
Questions
Free quiz and exam paper access
Enter your details to view this paper
Your access is remembered on this device.
Answers
O-Level Biology Quiz - Ecology: Answer Key
Total Marks: 40
Topic: Ecology (O-Level 6093, Theme III: Organisms and their Environment)
Section A: Multiple Choice
1. B [1]
A community is all the living organisms of different species living in a habitat. A is the environment, C is a population, D is abiotic surroundings.
Teaching note: Remember habitat = place, population = one species, community = many species together.
2. C [1]
Photosynthesis by plants/algae uses CO₂ + H₂O → glucose + O₂, removing CO₂. Respiration, combustion, decomposition release CO₂.
Teaching note: Carbon cycle: photosynthesis is the main removal process.
3. B [1]
Herbivore feeds only on plants. Carnivore eats animals, omnivore both, decomposer breaks down dead matter.
4. C [1]
Biotic = living. Fungal infection is caused by a living organism. Others are abiotic (non-living).
5. B [1]
Arrows show energy flow from producer → consumer. Not animal movement.
Section B: Structured
6. [2]
Definition: The natural environment where an organism lives. [1]
It provides food, shelter, and conditions for survival. [1]
Marking: 1 for "place where organism lives", 1 for mention of resources/conditions.
7. [2]
Any two: (i) salinity of water [1] (ii) oxygen level in soil [1] (also accepted: temperature, tidal range, soil type).
Note: Must be abiotic (non-living).
8. [2]
Decomposers break down dead organisms and waste. [1] They release nutrients (e.g., nitrates) back into soil for plants. [1]
Teaching note: Without decomposers, nutrients locked in dead matter.
9. [2]
Phytoplankton → zooplankton → small fish → large fish. [2 for full chain, 1 if partial]
Marking: Correct order of all four = 2 marks.
10. [2]
Any two: (i) stability against environmental change [1] (ii) provides variety of resources/food webs [1] (also: medicinal sources, ecological balance).
Section C: Data Interpretation
11. [3]
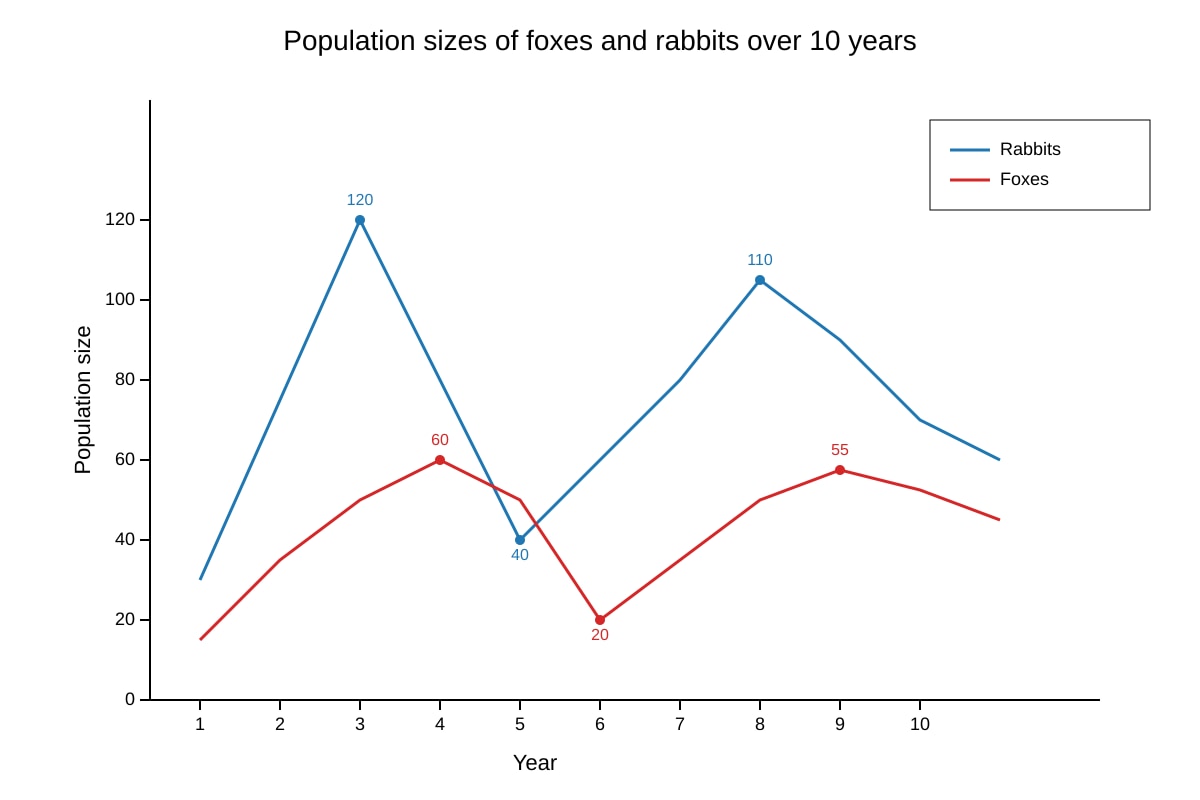
- Rabbit population increases first, then fox population follows after a delay. [1]
- When foxes increase, they eat more rabbits so rabbit numbers fall. [1]
- Then fox numbers fall due to less food, allowing rabbits to recover. [1]
Marking descriptors: Predator-prey cycle with lag = 3 marks.
12. [3]
- Not all ingested food is absorbed; some lost as faeces. [1]
- Energy lost as heat from respiration. [1]
- Some used for life processes, not passed on. [1]
Teaching note: ~10% transferred, rest lost (second law of thermodynamics).
13. [3]
- Decomposers (bacteria/fungi) respire and break down waste. [1]
- Carbon released as CO₂, mass reduces. [1]
- Water also lost by evaporation/transpiration of microbes. [1]
14. [3]
Working: Efficiency = (energy at grasshopper / energy at grass) × 100 [1]
= (1000 / 10000) × 100 [1]
= 10% [1]
Answer: 10%
15. [4]
- Nitrogen gas (N₂) fixed by lightning or bacteria (Rhizobium in roots, Azotobacter in soil). [1+1]
- Converted to ammonia/nitrates. [1]
- Plants absorb nitrates via roots for proteins. [1]
Marking: 4 points = 4 marks.
16. [4]
(i) Loss of habitat → species decline/displacement. [2: statement + explain]
(ii) Soil erosion / reduced water retention → downstream flooding. [2]
Accepted alternatives: reduced biodiversity, carbon release.
17. [4]
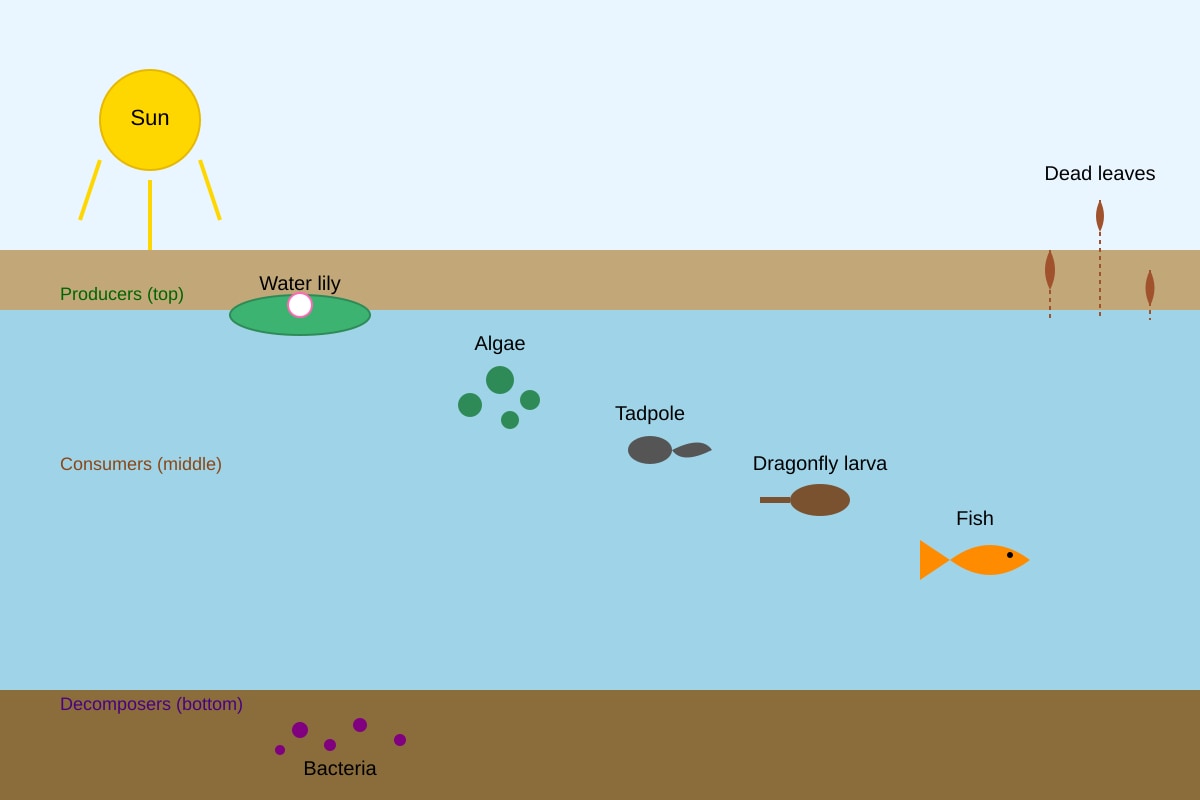
Example web: Algae → tadpole → dragonfly larva; Water lily → tadpole → fish; Dead leaves → bacteria (decomposer). [1 per correct link, max 4]
Must use diagram labels.
18. [3]
- Population: one species in area, e.g., all rattan palms. [1+1 example]
- Community: all species, e.g., palms + monkeys + insects. [1]
Marking: Definition diff + example each.
19. [4]
(i) Global warming → habitat shift / coral bleaching. [2]
(ii) Ocean acidification → shellfish decline. [2]
Any two consequences with explanation.
20. [5]
Why increasing: [2] protected area, more prey, anti-poaching.
Evaluate healthy: [3] rising count suggests good habitat & breeding; but need other species data; single species not full ecosystem health.
Marking: 2 for reasons, 3 for balanced evaluation with caveat.