From Real Exams Exam Paper
O Level Principles of Accounts Practice Paper 2
Free O Level POA Practice Paper 2, HY3 Exam version, with questions, answers, and O Level-style practice for Singapore students.
These static practice materials are generated from the site's syllabus and paper-generation workflow, with source and model context shown so students and parents can evaluate the material before use.
Questions
Free quiz and exam paper access
Enter your details to view this paper
Your access is remembered on this device.
Answers
TuitionGoWhere Exam Practice (AI) - Principles of Accounts O-Level
Practice Paper: Inventory Costing (Version 2 of 5) - Answer Key
Total Marks: 60
Section A: Basic Inventory Calculations
1. [2 marks]
- Working: Cost of Sales = Opening Inventory + Purchases − Closing Inventory
- = 18,500 − 19,900
- Mark breakdown: 1 mark for formula, 1 mark for correct answer.
- Teaching note: Cost of sales is the cost of inventory actually sold. Always use cost, not selling price.
2. [1 mark]
- Answer: Closing Inventory = Opening Inventory + Purchases − Cost of Sales (periodic system).
- Teaching note: This is the basic inventory identity. Some write it as Physical Count + Adjustments.
3. [3 marks]
- Goods in warehouse: $12,000 (include)
- Goods in transit (FOB shipping point): $2,500 (include – risk passed to buyer)
- Goods on consignment: $1,800 (exclude – not owned)
- Damaged goods: report at lower of cost (300) → $300
- Ending inventory = 12,000 + 2,500 + 300 = $14,800
- Mark breakdown: 1 mark for inclusions/exclusions, 2 marks for correct total.
- Common mistake: Including consignment goods or using cost for damaged.
4. [2 marks]
Inventory Account
Dr                              Cr
Opening b/d  5,000
Purchases   22,000    Cost of sales 20,000
                          Bal c/d     7,000
Total       27,000    Total          27,000
Bal b/d      7,000
- Mark: 1 for correct T-format and entries, 1 for balance.
5. [4 marks]
- Concept: Inventory is valued at lower of cost and net realisable value (LCNRV). [2 marks]
- Explanation: Cost is what was paid; NRV is expected selling price less costs to sell. If NRV < cost, write down to avoid overstating assets/profit (prudence). [2 marks]
Section B: FIFO and AVCO Methods
6. [3 marks]
- FIFO: first 100 @ 500; next 150 @ 810; next 50 @ 290. Total COGS = $1,600.
- Mark: 3 marks for correct layered calc.
7. [3 marks]
- Remaining: 70 units @ 406. Closing inventory = $406.
- Mark: 3 marks.
8. [4 marks]
- (a) Total cost = (100×5)+(150×5.40)+(120×5.80)=500+810+696=5.4216 ≈ $5.42. [2]
- (b) Closing 70 units × 379.51. [2]
9. [3 marks]
- In rising prices, FIFO uses older lower costs for COGS, so COGS lower, gross profit higher than AVCO which averages in newer higher costs. [3]
10. [3 marks]
- FIFO: COGS = 50@10 + 70@12 = 500+840=1,400. [3]
11. [4 marks]
- Open 200@4 = 800. Buy [email protected]=1350. Total 500 units, $2,150, avg=4.30.
- Sell 350 → COGS 350×4.30=1505, left 150 units @4.30=645.
- Buy 100@5=500 → total 250 units, $1,145, new avg=4.58.
- Closing inv = 250×4.58 = $1,145. [4 marks]
Section C: Analysis and Interpretation
12. [2 marks]
- ITR = 120,000 / 24,000 = 5 times. [2]
13. [2 marks]
- DSI = 365 / 5 = 73 days. [2]
14. [4 marks]
- 2023: ITR=90k/30k=3; DSI=365/3=121.67 days.
- 2024: ITR=120k/24k=5; DSI=73 days.
- 2024 better cash flow: inventory sold faster, less cash tied up. [4]
15. [4 marks]
- Avg inv = (8k+10k)/2=9k. ITR=50k/9k=5.56. DSI=365/5.56=65.65 days.
- Action: reduce ordering quantities / improve demand forecasting. [4]
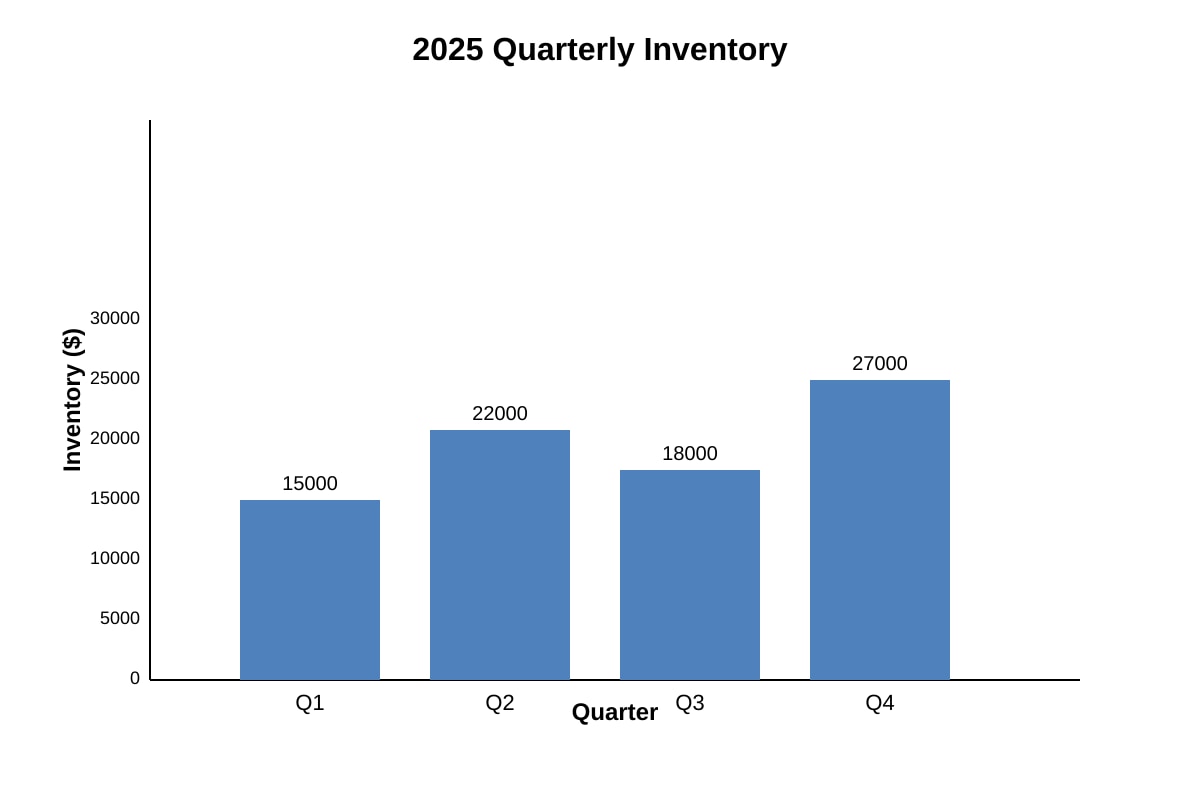
16. [4 marks]
- From chart: Q2 and Q4 peaks (27k); overall rising trend.
- Measure: review Q4 buying to avoid overstock; use just-in-time.
- Mark: 2 for correct reading of values/trend, 2 for sensible measure.
Section D: Integrated Scenario and Evaluation
17. [3 marks]
- Falling prices: FIFO uses older higher costs → COGS higher → net profit lower than AVCO. [3]
18. [3 marks]
- (1) Ignores inventory composition/obsolescence; (2) Averages hide seasonal spikes. [3, 1.5 each]
19. [3 marks]
- Closing inv overstated by 2k → gross profit overstated 2k (inventory asset inflated). [3]
20. [3 marks]
- (1) Implement tighter reorder levels – reduces excess stock; (2) Negotiate faster supplier delivery – lower safety stock. [3, 1.5 each]