AI Generated Quiz
A Level H1 Mathematics Statistics Probability Quiz
Free A Level H1 Maths Statistics quiz, HY3 AI version, with questions, answers, and A Level-style practice for Singapore students.
These static practice materials are generated from the site's syllabus and paper-generation workflow, with source and model context shown so students and parents can evaluate the material before use.
Questions
A-Level Maths H1 Quiz - Statistics Probability
Name: ______________________
Class: ______________________
Date: ______________________
Score: _______ / 50
Duration: 60 minutes
Total Marks: 50
Instructions: Answer all 20 questions. Show your working clearly. Calculators are allowed. Section A: Counting & Probability (Q1–7). Section B: Distributions (Q8–13). Section C: Sampling, Correlation & Regression (Q14–20).
Section A: Counting & Probability (Questions 1–7)
1. [2 marks] A committee of 3 students is to be formed from a class of 10 students. Find the number of possible committees.
2. [2 marks] A password consists of 2 distinct letters followed by 3 distinct digits. How many such passwords can be formed? (Letters: A–Z, Digits: 0–9)
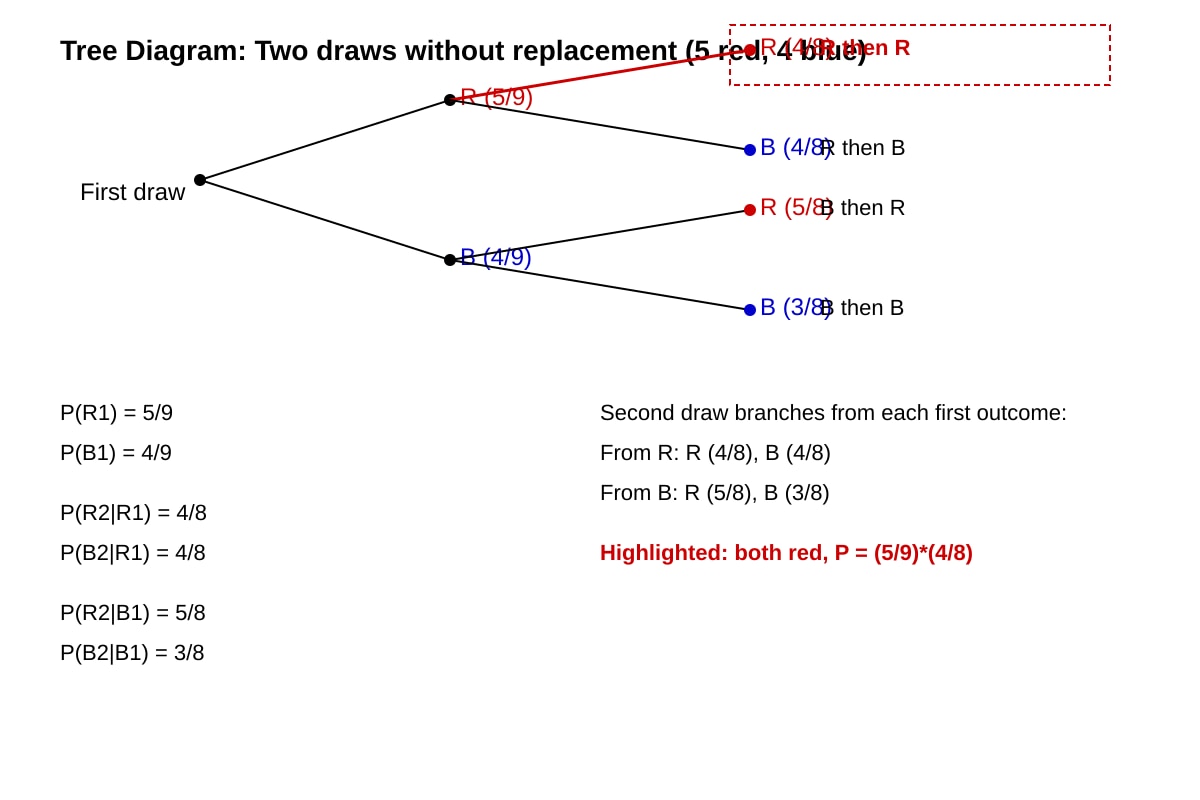
3. [3 marks] In a bag there are 5 red and 4 blue balls. Two balls are drawn without replacement. Draw a tree diagram and find the probability that both balls are red.
Image pending generation: diagram for Q3.
4. [2 marks] Events A and B are such that P(A) = 0.4, P(B) = 0.5, and P(A ∩ B) = 0.2. Find P(A ∪ B).
5. [2 marks] Given P(C) = 0.6 and P(D|C) = 0.3, find P(C ∩ D).
6. [3 marks] A survey shows 30% of students use public transport. Of those, 20% are late. Of those who do not use public transport, 10% are late. A student is chosen at random and is late. Find the probability that the student uses public transport.
7. [2 marks] Two events E and F are independent with P(E) = 0.7 and P(F) = 0.4. Find P(E ∩ F).
Section B: Distributions (Questions 8–13)
8. [2 marks] State the conditions under which a binomial distribution B(n, p) is a suitable probability model.
9. [3 marks] Let X ~ B(20, 0.3). Find P(X > 13).
10. [2 marks] For X ~ B(15, 0.4), find the mean and variance of X.
11. [3 marks] The mass of a watermelon is normally distributed with mean 5 kg and standard deviation 0.6 kg. Find the probability that a randomly chosen watermelon has mass between 4.5 kg and 6 kg.
12. [3 marks] The height of plants follows N(μ, σ²). Given P(X < 30) = 0.1 and P(X < 40) = 0.9, find μ and σ.
13. [3 marks] Let X ~ N(10, 4) and Y ~ N(5, 1) be independent. Find E(2X – 3Y) and Var(2X – 3Y).
Section C: Sampling, Correlation & Regression (Questions 14–20)
14. [2 marks] A sample of 25 gives Σx = 200 and Σx² = 1800. Find the unbiased estimates of the population mean and variance.
15. [2 marks] Explain, with reference to the Central Limit Theorem, why the sample mean from a population with n = 50 can be treated as normal even if the population is not normal.
16. [2 marks] The product moment correlation coefficient for 8 pairs of data is r = –0.85. Comment on the strength and direction of the relationship.
17. [3 marks] Given the data below, find the equation of the least squares regression line of y on x in the form y = mx + c.
| x | 1 | 2 | 3 | 4 | 5 | | y | 2 | 3 | 5 | 4 | 7 |
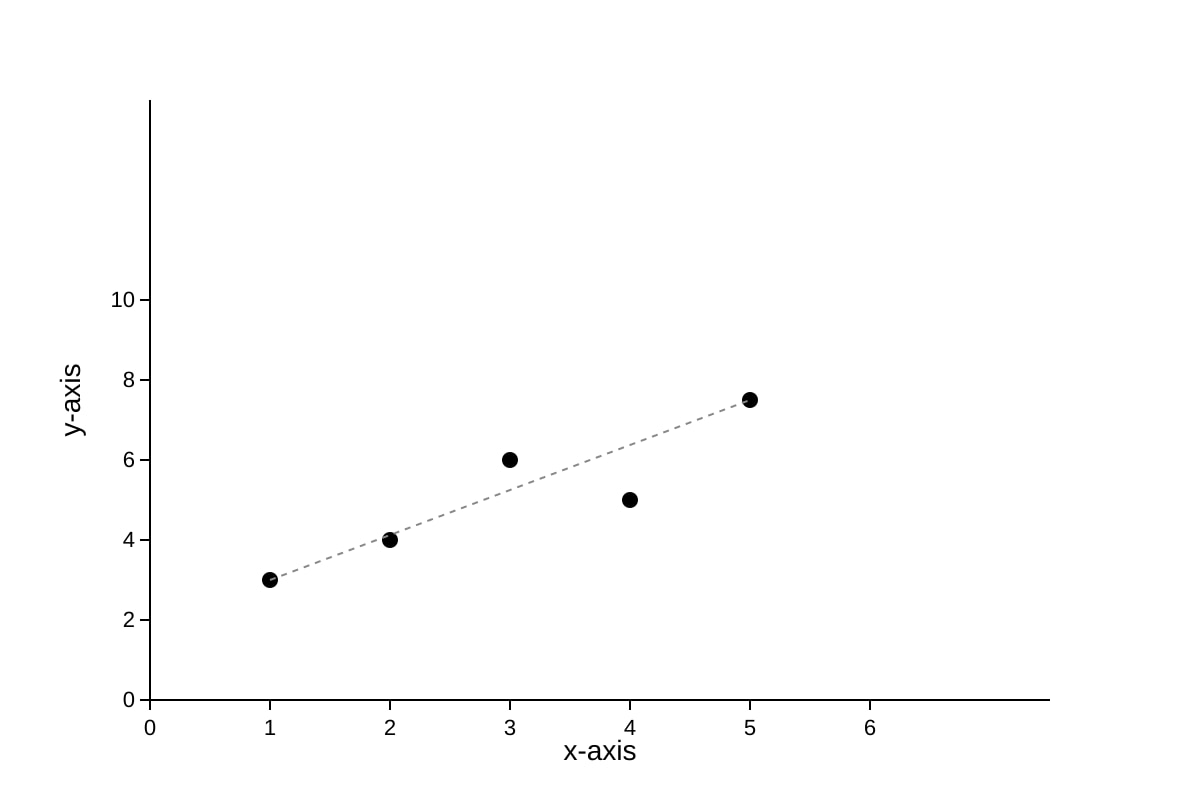
18. [2 marks] A scatter diagram of (x, y) shows points trending upward from left to right. Sketch the diagram with axes labelled.
Image pending generation: graph for Q18.
19. [3 marks] A researcher claims the mean reaction time is 0.3 s. A sample of 35 gives mean 0.33 s, s = 0.05 s. Test at 5% whether there is evidence the mean differs from 0.3 s.
20. [2 marks] Why does a correlation of 0.9 between ice cream sales and drowning incidents not imply ice cream causes drowning?
Answers
A-Level Maths H1 Quiz - Statistics Probability (Answer Key)
Total Marks: 50
Section A: Counting & Probability
Q1 [2 marks]
Number of committees = ¹⁰C₃ = 10! / (3!7!) = 120.
Teaching note: Order does not matter in a committee, so use combinations not permutations.
Common mistake: using ¹⁰P₃ = 720 (counts order).
Q2 [2 marks]
Letters: ²⁶P₂ = 26×25 = 650. Digits: ¹⁰P₃ = 10×9×8 = 720. Total = 650 × 720 = 468 000.
Teaching note: Distinct means no repetition; choose and arrange.
Q3 [3 marks]
Tree: P(RR) = (5/9)×(4/8) = 20/72 = 5/18.
Marks: 1 for tree, 2 for correct probability.
Teaching note: Without replacement reduces denominator from 9 to 8.
Q4 [2 marks]
P(A ∪ B) = P(A)+P(B)–P(A∩B) = 0.4+0.5–0.2 = 0.7.
Q5 [2 marks]
P(C ∩ D) = P(D|C)P(C) = 0.3×0.6 = 0.18.
Q6 [3 marks]
Let U = uses public transport, L = late.
P(U)=0.3, P(L|U)=0.2, P(L|U')=0.1.
P(L) = 0.3×0.2 + 0.7×0.1 = 0.06+0.07 = 0.13.
P(U|L) = 0.06/0.13 = 6/13 ≈ 0.462.
Marks: 1 setup, 1 total prob, 1 conditional.
Q7 [2 marks]
Independent ⇒ P(E∩F) = P(E)P(F) = 0.7×0.4 = 0.28.
Section B: Distributions
Q8 [2 marks]
Conditions: fixed number n of trials; each trial independent; constant probability p of success; outcomes success/failure.
(2 marks for listing all)
Q9 [3 marks]
P(X>13) = 1 – P(X≤13) using binomCDF(20,0.3,13) ≈ 1 – 0.994 = 0.006.
Teaching: ">" excludes 13.
Q10 [2 marks]
Mean = np = 15×0.4 = 6. Variance = np(1–p) = 15×0.4×0.6 = 3.6.
Q11 [3 marks]
Z1 = (4.5–5)/0.6 = –0.833, Z2 = (6–5)/0.6 = 1.667.
P(–0.833 < Z < 1.667) = Φ(1.667)–Φ(–0.833) ≈ 0.952–0.202 = 0.750.
Q12 [3 marks]
Z for 0.1 = –1.282, for 0.9 = 1.282.
(30–μ)/σ = –1.282, (40–μ)/σ = 1.282.
Subtract: 10/σ = 2.564 ⇒ σ ≈ 3.90, μ = 30+1.282×3.90 ≈ 35.0.
Q13 [3 marks]
E(2X–3Y)=2E(X)–3E(Y)=2×10–3×5=5.
Var(2X–3Y)=4Var(X)+9Var(Y)=4×4+9×1=25.
(Independent ⇒ no covariance)
Section C: Sampling, Correlation & Regression
Q14 [2 marks]
x̄ = 200/25 = 8. s² = (1800 – 200²/25)/24 = (1800–1600)/24 = 200/24 ≈ 8.33.
Q15 [2 marks]
CLT: for n≥30, sample mean approximately N(μ, σ²/n) regardless of population shape. n=50 sufficient.
Q16 [2 marks]
r = –0.85: strong negative linear relationship; as x increases y decreases.
Q17 [3 marks]
Σx=15, Σy=21, Σx²=55, Σxy=1×2+2×3+3×5+4×4+5×7=2+6+15+16+35=74.
m = (5×74 – 15×21)/(5×55 – 15²) = (370–315)/(275–225)=55/50=1.1.
c = (21 – 1.1×15)/5 = (21–16.5)/5 = 0.9.
y = 1.1x + 0.9.
Q18 [2 marks]
Sketch: x-axis labelled, y-axis labelled, points (1,2),(2,3),(3,5),(4,4),(5,7) showing upward trend.
Q19 [3 marks]
H₀: μ=0.3, H₁: μ≠0.3.
Test stat: (0.33–0.3)/(0.05/√35)=0.03/0.00846=3.55.
Critical z at 5% two-tail = ±1.96. Reject H₀. Evidence mean differs.
Q20 [2 marks]
Correlation ≠ causation; likely confounding (temperature) increases both; not causal.
Free quiz and exam paper access
Enter your details to view this paper
Your access is remembered on this device.