From Real Exams Quiz
A Level H1 Mathematics Statistics Probability Quiz
Free A Level H1 Maths Statistics quiz, HY3 Exam version, with questions, answers, and A Level-style practice for Singapore students.
These static practice materials are generated from the site's syllabus and paper-generation workflow, with source and model context shown so students and parents can evaluate the material before use.
Questions
A-Level Maths H1 Quiz - Statistics Probability
Name: ________________________
Class: ________________________
Date: ________________________
Score: ________________________
Duration: 70 minutes
Total Marks: 40
Instructions:
- Answer all 20 questions.
- Show your working clearly where required.
- Use your graphing calculator where appropriate.
- Write your answers in the spaces provided.
Section A: Probability (Questions 1–7)
1. [2 marks] A bag contains 5 red balls and 3 blue balls. Two balls are drawn at random without replacement. Draw a tree diagram to represent the possible outcomes and their probabilities.
2. [1 mark] Using the tree diagram from Question 1, write down the probability of drawing a red ball followed by a blue ball.
3. [2 marks] Events A and B are such that P(A)=0.4, P(B)=0.5, and P(A∩B)=0.2. Find P(A∪B).
4. [2 marks] A fair die is rolled. Let E be the event "an even number is obtained" and F be the event "a number greater than 4 is obtained". Determine whether E and F are independent.
5. [2 marks] In a survey of 200 residents, 120 use public transport and 80 do not. Of those using public transport, 30 are late at least once a week. Given that a randomly chosen resident is late at least once a week, the probability that they use public transport is 0.6. Find the total number of residents who are late at least once a week.
6. [2 marks] A box contains 4 green and 6 yellow cards. Three cards are selected at random without replacement. Find the probability that exactly two are green.
7. [2 marks] The probability that a student passes a test is 0.7. Two students are selected at random. Find the probability that at least one passes.
Section B: Distributions (Questions 8–13)
8. [2 marks] The random variable X∼B(20,0.3). Find P(X>8).
9. [2 marks] The random variable Y∼B(15,0.4). State the mean and variance of Y.
10. [2 marks] The mass of a certain fruit is normally distributed with mean 120 g and standard deviation 15 g. Find the probability that a randomly chosen fruit has mass less than 100 g.
11. [2 marks] Let X∼N(50,82). Find P(40<X<60).
12. [2 marks] The random variable X∼N(μ,σ2). Given that P(X<30)=0.1 and P(X<50)=0.9, find the value of μ and σ.
13. [2 marks] Given X∼N(10,4) and Y∼N(20,9) are independent, find E(2X−Y+3) and Var(2X−Y+3).
Section C: Sampling and Statistics (Questions 14–20)
14. [1 mark] Describe a method to select a simple random sample of 25 students from a school of 300 students.
15. [2 marks] A sample of 40 observations is taken from a normal population with variance 16. State the distribution of the sample mean Xˉ and give its mean and variance.
16. [2 marks] The following data are the number of books read by 8 students in a month: 3, 5, 2, 7, 4, 6, 3, 5. Find the unbiased estimates of the population mean and variance.
17. [2 marks] A summary of a sample gives ∑x=240 and ∑x2=5800 for n=10. Find the unbiased estimates of the population mean and variance.
18. [2 marks] The following data show the number of hours studied (x) and test score (y) for 6 students:
| x | 2 | 3 | 5 | 6 | 8 | 9 |
|---|---|---|---|---|---|---|
| y | 50 | 55 | 65 | 70 | 80 | 85 |
Find the product moment correlation coefficient r. Comment briefly on its value.
19. [2 marks] Using the data in Question 18, find the equation of the least squares regression line of y on x in the form y=ax+b.
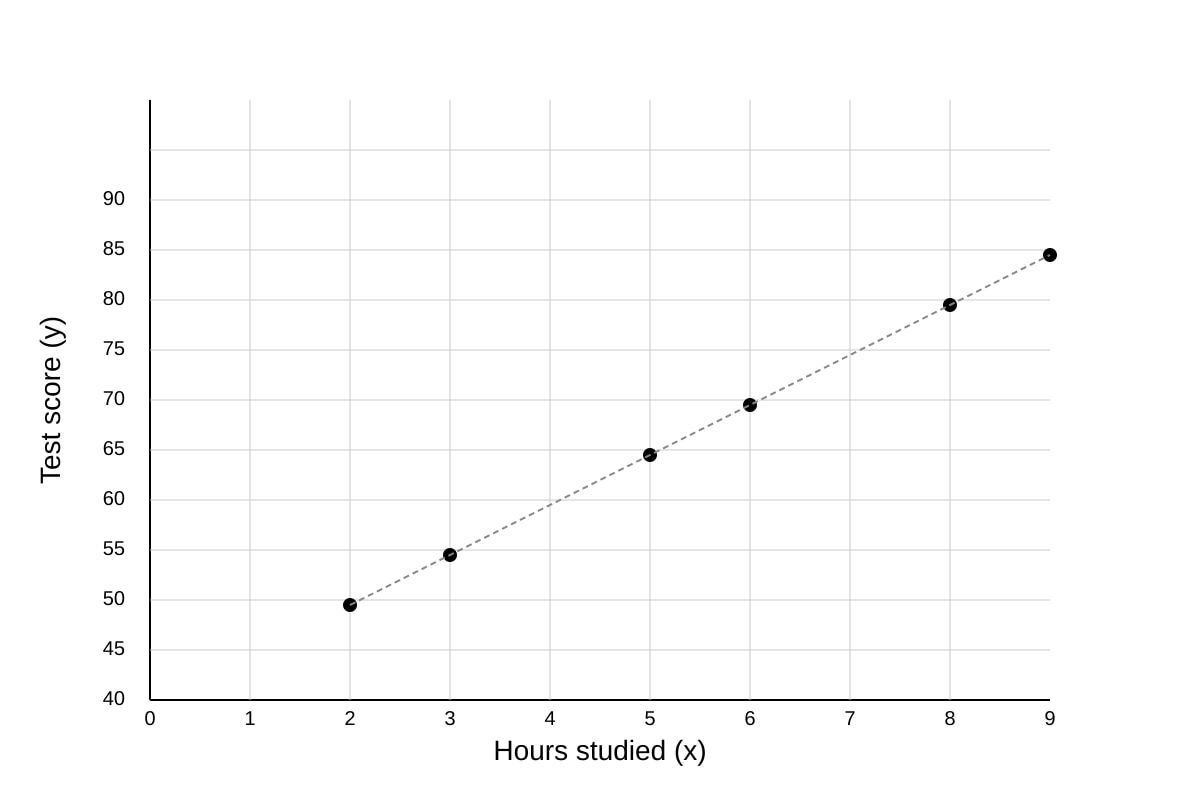
20. [2 marks] Sketch the scatter diagram for the data in Question 18, labelling axes clearly.
Image pending generation: scatter_diagram for Q20.
Answers
A-Level Maths H1 Quiz - Statistics Probability (Answer Key)
Total Marks: 40
Section A: Probability
Q1 [2 marks]
Tree diagram:
- Stage 1: Red (5/8), Blue (3/8)
- Stage 2 after Red: Red (4/7), Blue (3/7)
- Stage 2 after Blue: Red (5/7), Blue (2/7)
Marking: 1 mark for correct first branches, 1 mark for correct second branches with updated probabilities.
Q2 [1 mark]
P(Red then Blue)=85×73=5615≈0.268
Accept 15/56 or 0.268.
Q3 [2 marks]
P(A∪B)=P(A)+P(B)−P(A∩B)=0.4+0.5−0.2=0.7
1 mark for formula, 1 mark for correct value.
Q4 [2 marks]
E={2,4,6},P(E)=3/6=0.5
F={5,6},P(F)=2/6=1/3
E∩F={6},P(E∩F)=1/6
Check: P(E)P(F)=0.5×1/3=1/6=P(E∩F) → independent.
1 mark for probabilities, 1 mark for conclusion.
Q5 [2 marks]
Let L = late at least once a week.
P(PT∣L)=0.6=Total late30 → Total late = 30 / 0.6 = 50.
1 mark for setting up equation, 1 mark for answer 50.
Q6 [2 marks]
P(exactly 2 green)=(310)(24)(16)=1206×6=12036=0.3
1 mark for combinations, 1 mark for final answer.
Q7 [2 marks]
P(at least one passes)=1−P(both fail)=1−(0.3)2=1−0.09=0.91
1 mark for complement method, 1 mark for answer.
Section B: Distributions
Q8 [2 marks]
X∼B(20,0.3), P(X>8)=1−P(X≤8)≈1−0.8867=0.1133 (GC).
1 mark for correct setup, 1 mark for value.
Q9 [2 marks]
Mean = np=15×0.4=6
Variance = np(1−p)=15×0.4×0.6=3.6
1 mark each.
Q10 [2 marks]
Z=15100−120=−1.333, P(Z<−1.333)≈0.0912
1 mark for z, 1 mark for probability.
Q11 [2 marks]
Z1=(40−50)/8=−1.25, Z2=(60−50)/8=1.25
P(−1.25<Z<1.25)=0.8944−0.1056=0.7888
1 mark each.
Q12 [2 marks]
Symmetry: μ=(30+50)/2=40.
P(X<30)=0.1⇒Z=−1.2816=(30−40)/σ⇒σ=10/1.2816≈7.80
1 mark for μ, 1 mark for σ.
Q13 [2 marks]
E(2X−Y+3)=2(10)−20+3=3
Var=22(4)+(−1)2(9)=16+9=25
1 mark each.
Section C: Sampling and Statistics
Q14 [1 mark]
Assign numbers 1–300 to students. Use a random number generator to pick 25 distinct numbers; select corresponding students. (1 mark for valid random method)
Q15 [2 marks]
Xˉ∼N(50,16/40)=N(50,0.4). Mean = 50, Variance = 0.4.
1 mark for distribution, 1 mark for parameters.
Q16 [2 marks]
xˉ=(3+5+2+7+4+6+3+5)/8=35/8=4.375
s2=71[(3−4.375)2+⋯+(5−4.375)2]=71(21.875)=3.125
1 mark mean, 1 mark variance.
Q17 [2 marks]
xˉ=240/10=24
s2=91[5800−10(24)2]=91(5800−5760)=40/9≈4.44
1 mark each.
Q18 [2 marks]
Using GC: r≈0.997. Strong positive linear correlation between hours studied and score.
1 mark calc, 1 mark comment.
Q19 [2 marks]
From GC: y=4.41x+41.2 (approx).
1 mark gradient, 1 mark intercept.
Q20 [2 marks]
Scatter diagram: x-axis 0–10, y-axis 40–90, points plotted as per placeholder. Upward trend.
1 mark axes/labels, 1 mark points/trend.
Free quiz and exam paper access
Enter your details to view this paper
Your access is remembered on this device.