AI Generated Exam Paper
A Level H1 Mathematics Practice Paper 4
Free A Level H1 Maths Practice Paper 4, HY3 AI version, with questions, answers, and A Level-style practice for Singapore students.
These static practice materials are generated from the site's syllabus and paper-generation workflow, with source and model context shown so students and parents can evaluate the material before use.
Questions
TuitionGoWhere Practice Paper - Maths H1 A-Level
TuitionGoWhere Practice Paper (AI) — Version 4 of 5
Subject: Maths H1
Level: A-Level
Paper: Practice Paper (Statistics & Probability Focus)
Duration: 1 hour 30 minutes
Total Marks: 60
Name: ________________________
Class: ________________________
Date: ________________________
Instructions:
- Answer all questions.
- Show all working clearly.
- Use a graphing calculator where appropriate.
- Write answers in the spaces provided.
Section A: Probability and Counting (16 marks)
1. A committee of 4 students is to be formed from 7 boys and 5 girls. Find the number of ways to form the committee if it must contain exactly 2 girls. [2]
2. Events A and B are such that P(A)=0.45, P(B)=0.30, and P(A∩B)=0.12. Find P(A∪B). [2]
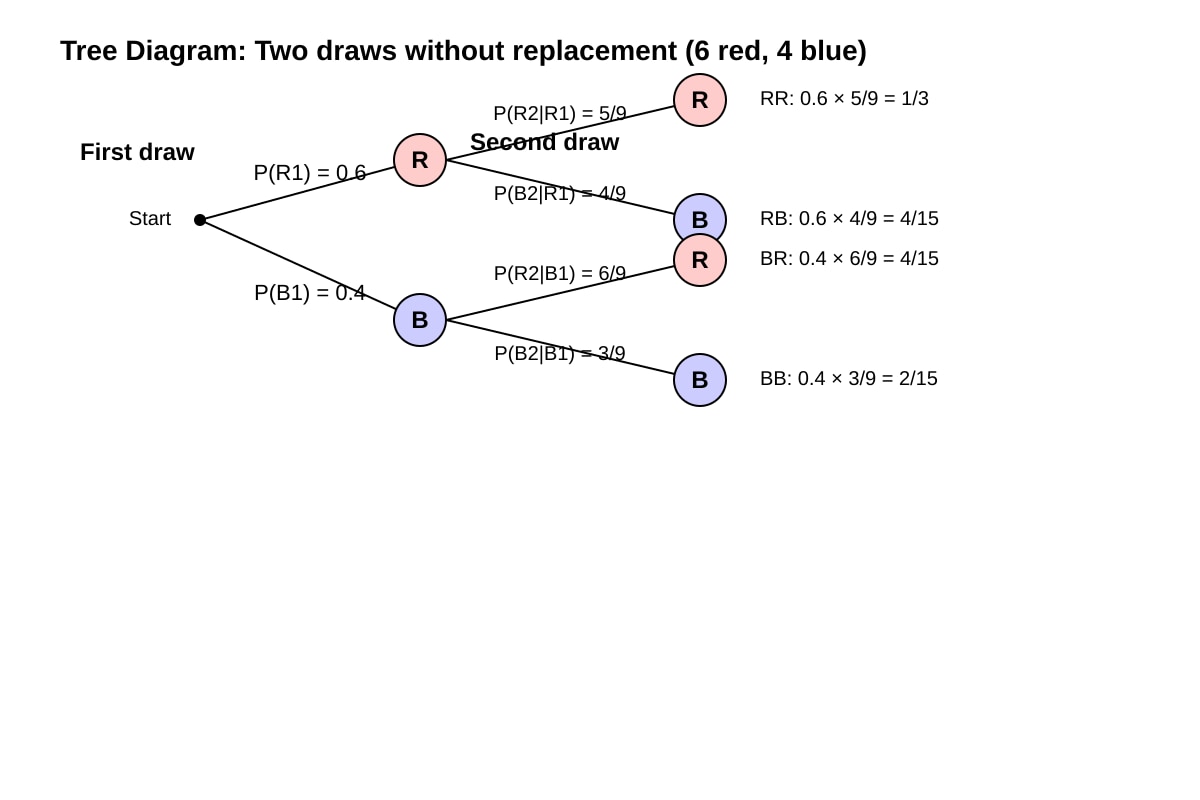
3. A bag contains 6 red and 4 blue marbles. Two marbles are drawn without replacement. Draw a tree diagram to show the probabilities of the colour outcomes. [3]
Image pending generation: diagram for Q3.
4. Given that P(C)=0.6 and P(D∣C)=0.25, find P(C∩D). [2]
5. In a survey, 70% of residents use public transport. Of those, 40% are late at least once a week. Find the probability that a randomly chosen resident uses public transport and is late at least once a week. [2]
6. A random variable X∼B(20,0.35). Find P(X>10). [3]
7. Explain why the binomial model is appropriate for the number of defective items in a sample of 15 taken from a large batch where 8% are known to be defective. [2]
Section B: Distributions and Sampling (22 marks)
8. The mass of a species of fish follows a normal distribution with mean 420 g and standard deviation 60 g. Find the probability that a randomly caught fish has mass between 380 g and 450 g. [3]
9. The waiting time at a clinic, in minutes, is T∼N(μ,122). Given that P(T>45)=0.10, find μ. [3]
10. Two independent normal variables: X∼N(50,42) and Y∼N(30,32). Find E(2X−Y) and Var(2X−Y). [3]
11. A sample of 36 observations from a normal population has ∑x=2124 and ∑x2=128900. Find the unbiased estimates of the population mean and variance. [3]
12. A random sample of 50 values is taken from a non-normal population with mean 100 and variance 64. State the approximate distribution of the sample mean and give its mean and variance. [2]
13. The number of daily customers at a café is X∼B(40,0.2). Find the mean and variance of X. [2]
14. The heights of 25 plants (cm) are summarised by ∑x=437.5, ∑x2=7890. Find the unbiased estimate of the population variance. [3]
Section C: Correlation, Regression and Hypothesis Testing (22 marks)
15. A student records the number of hours studied (x) and test score (y) for 8 friends:
| x | 2 | 3 | 4 | 5 | 6 | 7 | 8 | 9 |
|---|---|---|---|---|---|---|---|---|
| y | 55 | 60 | 65 | 68 | 72 | 75 | 80 | 85 |
Given ∑x=44, ∑y=560, ∑x2=284, ∑y2=40268, ∑xy=3326, find the product moment correlation coefficient r. Comment on the result. [4]
16. Using the data in Q15, find the equation of the least squares regression line of y on x in the form y=a+bx. [3]
17. A researcher claims the mean reaction time of drivers is 0.4 s. A sample of 35 drivers gives mean 0.43 s and standard deviation 0.08 s. Test at 5% significance whether the mean differs from 0.4 s. [5]
18. The correlation between ice cream sales and sunburn cases is 0.88. Explain why this does not prove ice cream causes sunburn. [2]
19. A sample of 42 students has mean screen time 5.2 h and unbiased variance 1.44 h². A teacher claims mean screen time exceeds 4.8 h. Test at 1% significance. [4]
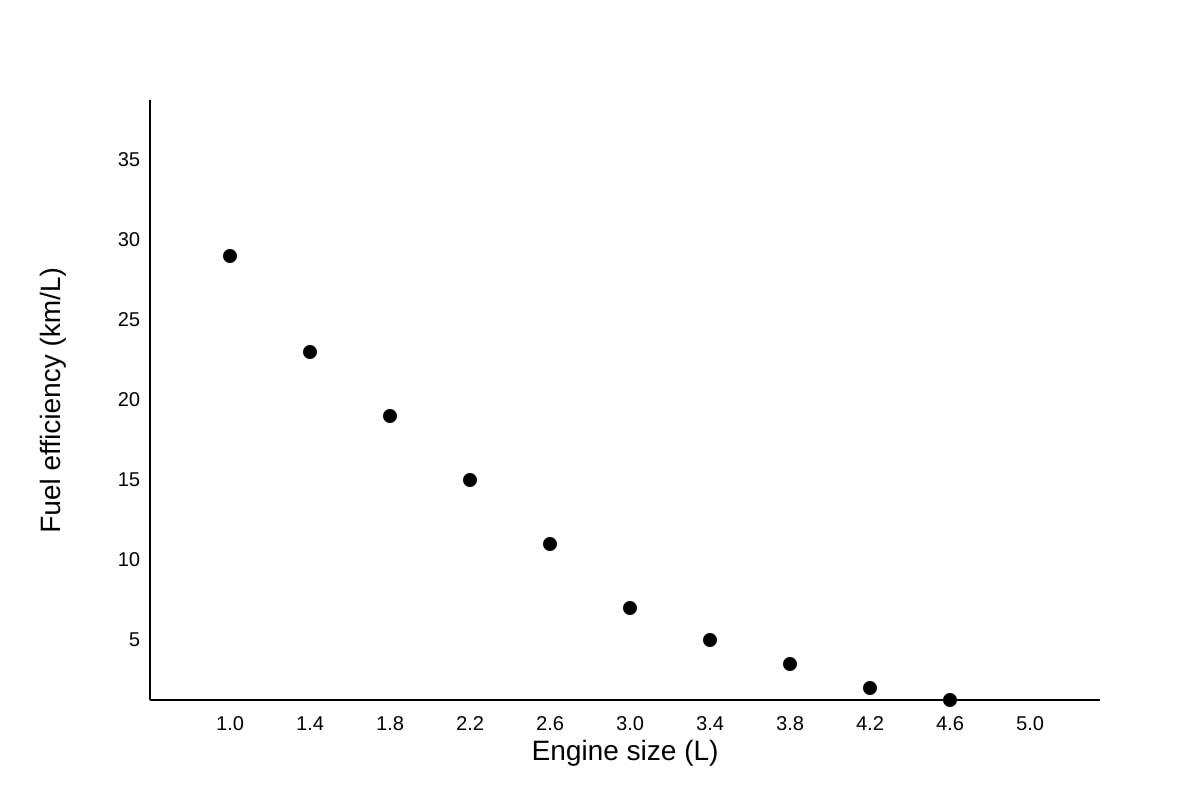
20. The table shows part of a scatter plot of engine size (x litres) and fuel efficiency (y km/L) for 10 cars.
| x | 1.0 | 1.4 | 1.8 | 2.2 | 2.6 |
|---|---|---|---|---|---|
| y | 18 | 15 | 13 | 11 | 9 |
Sketch the scatter diagram as seen on a calculator. [2]
Image pending generation: graph for Q20.
Answers
TuitionGoWhere Practice Paper - Maths H1 A-Level (Answers)
Version 4 of 5 — Answer Key
Section A: Probability and Counting
1. [2 marks]
Choose 2 girls from 5: (25)=10. Choose 2 boys from 7: (27)=21.
Total = 10×21=210.
Teaching note: Use combinations because order does not matter. Common mistake: using permutations.
2. [2 marks]
P(A∪B)=P(A)+P(B)−P(A∩B)=0.45+0.30−0.12=0.63.
Teaching note: Addition rule prevents double-counting intersection.
3. [3 marks]
Tree: First branch R (0.6), B (0.4). From R: R (5/9), B (4/9). From B: R (6/9), B (3/9).
Outcome probs: RR = 0.6×5/9=1/3, RB=0.6×4/9=4/15, BR=0.4×6/9=4/15, BB=0.4×3/9=2/15.
Marking: 1 for structure, 1 for correct conditionals, 1 for labelled probabilities.
4. [2 marks]
P(C∩D)=P(C)×P(D∣C)=0.6×0.25=0.15.
Teaching note: Conditional probability formula.
5. [2 marks]
P(PT and late)=0.70×0.40=0.28.
Teaching note: Multiply marginal and conditional.
6. [3 marks]
X∼B(20,0.35). P(X>10)=1−P(X≤10). Using GC: 1−0.8724=0.1276.
Marking: 1 for setup, 2 for correct value.
7. [2 marks]
Fixed n=15 independent trials; constant p=0.08; two outcomes (defective/not); batch large so independence approx holds.
Teaching note: Binomial conditions.
Section B: Distributions and Sampling
8. [3 marks]
Z1=(380−420)/60=−0.667, Z2=(450−420)/60=0.5.
P(−0.667<Z<0.5)=Φ(0.5)−Φ(−0.667)=0.6915−0.2525=0.439.
Marking: 1 each for z-scores, 1 for final prob.
9. [3 marks]
P(T>45)=0.10⇒P(Z>(45−μ)/12)=0.10⇒(45−μ)/12=1.282.
μ=45−12(1.282)=29.6 min.
Marking: 1 for inverse normal, 2 for solve.
10. [3 marks]
E(2X−Y)=2(50)−30=70. Var(2X−Y)=4(16)+9=73.
Teaching note: Independent so variances add with squares of coefficients.
11. [3 marks]
xˉ=2124/36=59.0.
s2=[∑x2−(∑x)2/n]/(n−1)=[128900−21242/36]/35=[128900−125316]/35=3584/35=102.4.
Marking: 1 mean, 2 variance.
12. [2 marks]
By CLT, Xˉ≈N(100,64/50)=N(100,1.28).
Teaching note: n=50 ≥ 30.
13. [2 marks]
Mean = np=40(0.2)=8. Variance = np(1−p)=40(0.2)(0.8)=6.4.
14. [3 marks]
s2=[7890−437.52/25]/24=[7890−7656.25]/24=233.75/24=9.74 cm².
Section C: Correlation, Regression and Hypothesis Testing
15. [4 marks]
r=(n∑x2−(∑x)2)(n∑y2−(∑y)2)n∑xy−∑x∑y
=(8(284)−442)(8(40268)−5602)8(3326)−44(560)=(2272−1936)(322144−313600)26608−24640=336×85441968=28707841968=0.989.
Strong positive linear correlation.
Marking: 2 formula/substitution, 2 value+comment.
16. [3 marks]
b=8(284)−4428(3326)−44(560)=1968/336=5.857.
a=560/8−5.857(44/8)=70−32.21=37.79.
y=37.8+5.86x.
17. [5 marks]
H0:μ=0.4, H1:μ=0.4 (2-tail).
Test stat: Z=(0.43−0.4)/(0.08/35)=0.03/0.0135=2.22.
Critical z at 5% two-tail = ±1.96. Since 2.22 > 1.96, reject H0.
Evidence mean differs.
Marking: 1 H's, 2 calc, 2 conclusion.
18. [2 marks]
Correlation not causation; likely confounding (temperature) increases both.
19. [4 marks]
H0:μ=4.8, H1:μ>4.8.
Z=(5.2−4.8)/1.44/42=0.4/0.185=2.16.
Critical 1% one-tail = 2.33. Not reject. Insufficient evidence.
Marking: 1 H's, 2 calc, 1 concl.
20. [2 marks]
Scatter shows clear negative linear trend; axes labelled; points as given.
Marking: 1 axes/labels, 1 points/trend.
Free quiz and exam paper access
Enter your details to view this paper
Your access is remembered on this device.