AI Generated Exam Paper
A Level H1 Mathematics Practice Paper 2
Free A Level H1 Maths Practice Paper 2, LongCat AI version, with questions, answers, and A Level-style practice for Singapore students.
These static practice materials are generated from the site's syllabus and paper-generation workflow, with source and model context shown so students and parents can evaluate the material before use.
Questions
TuitionGoWhere Practice Paper - Maths H1 A-Level
TuitionGoWhere Practice Paper (AI)
Subject: Mathematics H1 Level: A-Level Paper: Practice Paper — Statistics & Probability Version: 2 of 5 Duration: 1 hour 30 minutes Total Marks: 60
Name: ___________________________ Class: ___________________________ Date: ___________________________
Instructions
- Write your answers in the spaces provided.
- Show all working clearly. Marks are awarded for correct method even if the final answer is wrong.
- Give answers correct to 3 significant figures unless otherwise stated.
- A graphing calculator may be used where appropriate.
- The total marks for this paper is 60.
- The marks for each question are shown in brackets [ ].
Section A: Pure Statistics (30 marks)
Answer all questions in this section.
Question 1
A random sample of 8 students recorded the number of hours they spent on revision in a week:
12, 15, 10, 18, 14, 11, 16, 13
Calculate the unbiased estimates of the population mean and population variance.
[4]
Question 2
The random variable X∼B(20,0.35). Find:
(a) P(X=7)
[2]
(b) P(X≥5)
[2]
Question 3
A continuous random variable X has probability density function given by
f(x)={kx(4−x)00≤x≤4otherwise
(a) Show that k=323.
[2]
(b) Find E(X).
[2]
Question 4
The heights of a certain species of plant are normally distributed with mean 42 cm and standard deviation 5 cm.
(a) Find the probability that a randomly selected plant has a height between 38 cm and 47 cm.
[3]
(b) In a random sample of 200 plants, how many would you expect to have a height greater than 50 cm?
[2]
Question 5
A researcher claims that the mean daily screen time of teenagers is 6.5 hours. A random sample of 50 teenagers gives a mean daily screen time of 7.2 hours with a standard deviation of 2.1 hours. Test at the 5% significance level whether there is evidence that the mean daily screen time differs from 6.5 hours.
[6]
Question 6
The following table shows the marks obtained by 60 students in a mathematics test.
| Mark | Frequency |
|---|---|
| 0–19 | 4 |
| 20–39 | 10 |
| 40–59 | 18 |
| 60–79 | 16 |
| 80–100 | 12 |
(a) Calculate the mean mark.
[3]
(b) State the modal class.
[1]
(c) Draw a histogram to represent the data.
[3]
Generated chart for Q6(c).
Section B: Probability & Distributions (30 marks)
Answer all questions in this section.
Question 7
A bag contains 5 red balls, 4 blue balls, and 3 green balls. Three balls are drawn at random without replacement.
(a) Find the probability that all three balls are red.
[2]
(b) Find the probability that exactly two balls are red and one is blue.
[3]
(c) Find the probability that all three balls are of different colours.
[3]
Question 8
The number of emails received by an employee per hour follows a Poisson distribution with mean 4.2.
(a) Find the probability that the employee receives exactly 5 emails in a given hour.
[2]
(b) Find the probability that the employee receives at least 3 emails in a given hour.
[3]
(c) Find the probability that the employee receives fewer than 2 emails in a 30-minute period.
[3]
Question 9
The weights of apples from a particular orchard are normally distributed with mean 150 g and standard deviation σ g. It is known that 8% of the apples weigh more than 165 g.
(a) Find the value of σ.
[4]
(b) Apples weighing less than 130 g are classified as "small". Find the probability that a randomly selected apple is classified as "small".
[2]
(c) A random sample of 10 apples is selected. Find the probability that at least 2 are classified as "small".
[3]
Question 10
A fair six-sided die is rolled 4 times.
(a) Find the probability of getting exactly two sixes.
[3]
(b) Find the probability of getting at least one six.
[3]
Question 11
The lifetime of a certain brand of LED light bulb, T hours, follows an exponential distribution with mean 8000 hours.
(a) Write down the probability density function of T.
[1]
(b) Find the probability that a randomly selected bulb lasts more than 10,000 hours.
[3]
(c) A hotel purchases 5 of these bulbs. Assuming independence, find the probability that exactly 3 of them last more than 10,000 hours.
[3]
Question 12
Two events A and B are such that P(A)=0.6, P(B)=0.4, and P(A∪B)=0.76.
(a) Find P(A∩B).
[2]
(b) Determine whether A and B are independent. Justify your answer.
[2]
(c) Find P(A′∣B).
[2]
Question 13
A call centre receives calls at an average rate of 2.5 calls per minute. Use a suitable approximation to find the probability that the call centre receives fewer than 130 calls in a 1-hour period.
[5]
Question 14
The following grouped data shows the daily commute times (in minutes) of 80 employees at a company.
| Commute time (min) | Frequency |
|---|---|
| 0–9 | 6 |
| 10–19 | 14 |
| 20–29 | 22 |
| 30–39 | 20 |
| 40–49 | 12 |
| 50–59 | 6 |
(a) Estimate the median commute time.
[3]
(b) Calculate the interquartile range.
[3]
(c) On a separate piece of paper, describe the shape of the distribution and justify your answer.
[2]
Question 15
A factory produces components, and 5% are defective. A quality control inspector tests components one at a time until the first defective component is found.
(a) Find the probability that the first defective component is found on the 5th test.
[2]
(b) Find the expected number of tests until the first defective component is found.
[2]
(c) If the inspector tests 100 components, use a Poisson approximation to estimate the probability that exactly 3 are defective.
[3]
Question 16
The joint probability distribution of two discrete random variables X and Y is given by:
P(X=x,Y=y)=30x+y,x=1,2,3; y=1,2,3
(a) Find P(X=2,Y=3).
[1]
(b) Find the marginal probability P(X=2).
[2]
(c) Find E(X).
[3]
Question 17
A random variable X∼N(μ,σ2). It is known that P(X<25)=0.1587 and P(X>45)=0.0228.
Find the values of μ and σ.
[5]
Question 18
In a game, a player rolls two fair six-sided dice. The player wins $10 if the sum is 7, wins $5 if the sum is greater than 9, and loses $3 otherwise.
(a) Find the probability that the player wins $10.
[2]
(b) Find the probability that the player wins $5.
[2]
(c) Find the expected amount the player wins (or loses) per game.
[3]
Question 19
A sample of 10 observations from a normal distribution with unknown mean and variance gives the following summary statistics:
∑x=156and∑x2=2478
(a) Calculate the unbiased estimates of the population mean and variance.
[3]
(b) Construct a 95% confidence interval for the population mean.
[4]
Question 20
A continuous random variable X has cumulative distribution function
F(x)=⎩⎨⎧064x31x<00≤x≤4x>4
(a) Find the probability density function f(x).
[2]
(b) Find P(1<X<3).
[2]
(c) Find the median of X.
[2]
End of Paper
Mark Summary
| Section | Marks |
|---|---|
| Section A (Questions 1–6) | 30 |
| Section B (Questions 7–20) | 30 |
| Total | 60 |
Answers
TuitionGoWhere Practice Paper — Maths H1 A-Level
Answer Key & Marking Scheme
Subject: Mathematics H1 Paper: Practice Paper — Statistics & Probability Version: 2 of 5 Total Marks: 60
Section A: Pure Statistics (30 marks)
Question 1 [4 marks]
Data: 12, 15, 10, 18, 14, 11, 16, 13; n=8
Unbiased estimate of population mean:
xˉ=n∑xi=812+15+10+18+14+11+16+13=8109=13.625
Unbiased estimate of population variance:
s2=n−1∑(xi−xˉ)2
Calculate each (xi−xˉ)2:
| xi | xi−xˉ | (xi−xˉ)2 |
|---|---|---|
| 12 | −1.625 | 2.640625 |
| 15 | 1.375 | 1.890625 |
| 10 | −3.625 | 13.140625 |
| 18 | 4.375 | 19.140625 |
| 14 | 0.375 | 0.140625 |
| 11 | −2.625 | 6.890625 |
| 16 | 2.375 | 5.640625 |
| 13 | −0.625 | 0.390625 |
∑(xi−xˉ)2=49.875
s2=749.875=7.125
Answer: xˉ=13.6 hours, s2=7.13 hours² (to 3 s.f.)
Marking:
- M1: Correct formula for xˉ with correct substitution
- A1: xˉ=13.625 or 13.6
- M1: Correct formula for s2 using n−1=7 in denominator
- A1: s2=7.125 or 7.13
Common mistake: Using n=8 instead of n−1=7 gives 849.875=6.23, which is the biased estimator. This loses the A1 mark.
Question 2 [4 marks]
X∼B(20,0.35)
(a) P(X=7)=(720)(0.35)7(0.65)13
=77520×(0.35)7×(0.65)13
=77520×0.00064339...×0.005479...
=0.164 (to 3 s.f.)
Marking: M1 for correct binomial probability formula with n=20,p=0.35,r=7; A1 for answer 0.164.
(b) P(X≥5)=1−P(X≤4)
Using calculator/binomial tables:
P(X≤4)=∑k=04(k20)(0.35)k(0.65)20−k
Computing each term:
- P(X=0)=(0.65)20=0.000182
- P(X=1)=20(0.35)(0.65)19=0.002098
- P(X=2)=190(0.35)2(0.65)18=0.01157
- P(X=3)=1140(0.35)3(0.65)17=0.03834
- P(X=4)=4845(0.35)4(0.65)16=0.08918
P(X≤4)=0.1414
P(X≥5)=1−0.1414=0.859 (to 3 s.f.)
Marking: M1 for using complement 1−P(X≤4); A1 for answer 0.859.
Question 3 [4 marks]
(a) For a valid PDF, ∫−∞∞f(x)dx=1:
∫04kx(4−x)dx=1
k∫04(4x−x2)dx=1
k[2x2−3x3]04=1
k[(2(16)−364)−0]=1
k[32−364]=1
k[396−64]=1
k×332=1
k=323✓ shown
Marking: M1 for setting up the integral equal to 1; M1 for correct integration; A1 for showing k=323.
(b) E(X)=∫04x⋅323x(4−x)dx=323∫04(4x2−x3)dx
=323[34x3−4x4]04
=323[34(64)−4256]
=323[3256−64]
=323[3256−192]
=323×364=3264=2
Answer: E(X)=2
Marking: M1 for correct expectation integral setup; M1 for correct integration; A1 for answer 2.
Question 4 [5 marks]
X∼N(42,52)
(a) P(38<X<47)
Standardise: Z=5X−42
P(38<X<47)=P(538−42<Z<547−42)=P(−0.8<Z<1.0)
=Φ(1.0)−Φ(−0.8)=Φ(1.0)−(1−Φ(0.8))
=0.8413−(1−0.7881)=0.8413−0.2119=0.6294
Answer: 0.629 (to 3 s.f.)
Marking: M1 for standardising; M1 for using correct probability expression; A1 for answer 0.629.
(b) P(X>50)=P(Z>550−42)=P(Z>1.6)=1−Φ(1.6)=1−0.9452=0.0548
Expected number in 200 plants: 200×0.0548=10.96
Answer: 11 plants (to nearest whole number)
Marking: M1 for finding P(X>50); M1 for multiplying by 200; A1 for answer 11.
Question 5 [6 marks]
Step 1: State hypotheses
H0:μ=6.5 (mean daily screen time is 6.5 hours) H1:μ=6.5 (mean daily screen time differs from 6.5 hours)
This is a two-tailed test at the 5% significance level.
Step 2: Test statistic
Since n=50 is large, by CLT we use the z-test:
z=s/nxˉ−μ0=2.1/507.2−6.5=0.296980.7=2.357
Step 3: Critical value / p-value
For a two-tailed test at 5%, critical values are z=±1.96.
Since 2.357>1.96, we reject H0.
Alternatively, p-value =2×P(Z>2.357)=2×(1−0.9908)=2×0.0092=0.0184
Since 0.0184<0.05, we reject H0.
Step 4: Conclusion
There is sufficient evidence at the 5% significance level to conclude that the mean daily screen time of teenagers differs from 6.5 hours.
Marking:
- M1: Correct hypotheses stated (two-tailed)
- M1: Correct test statistic formula and substitution
- A1: z=2.36 (to 3 s.f.)
- M1: Comparison with critical value or p-value comparison with 0.05
- A1: Correct decision (reject H0)
- B1: Conclusion in context
Question 6 [7 marks]
(a) Calculate the mean:
Midpoints: 9.5, 29.5, 49.5, 69.5, 90
| Class | Midpoint m | Frequency f | fm |
|---|---|---|---|
| 0–19 | 9.5 | 4 | 38 |
| 20–39 | 29.5 | 10 | 295 |
| 40–59 | 49.5 | 18 | 891 |
| 60–79 | 69.5 | 16 | 1112 |
| 80–100 | 90 | 12 | 1080 |
xˉ=∑f∑fm=6038+295+891+1112+1080=603416=56.93
Answer: Mean = 56.9 (to 3 s.f.)
Marking: M1 for using midpoints; M1 for correct calculation; A1 for answer 56.9.
(b) The modal class is 40–59 (highest frequency of 18).
Marking: B1 for correct modal class.
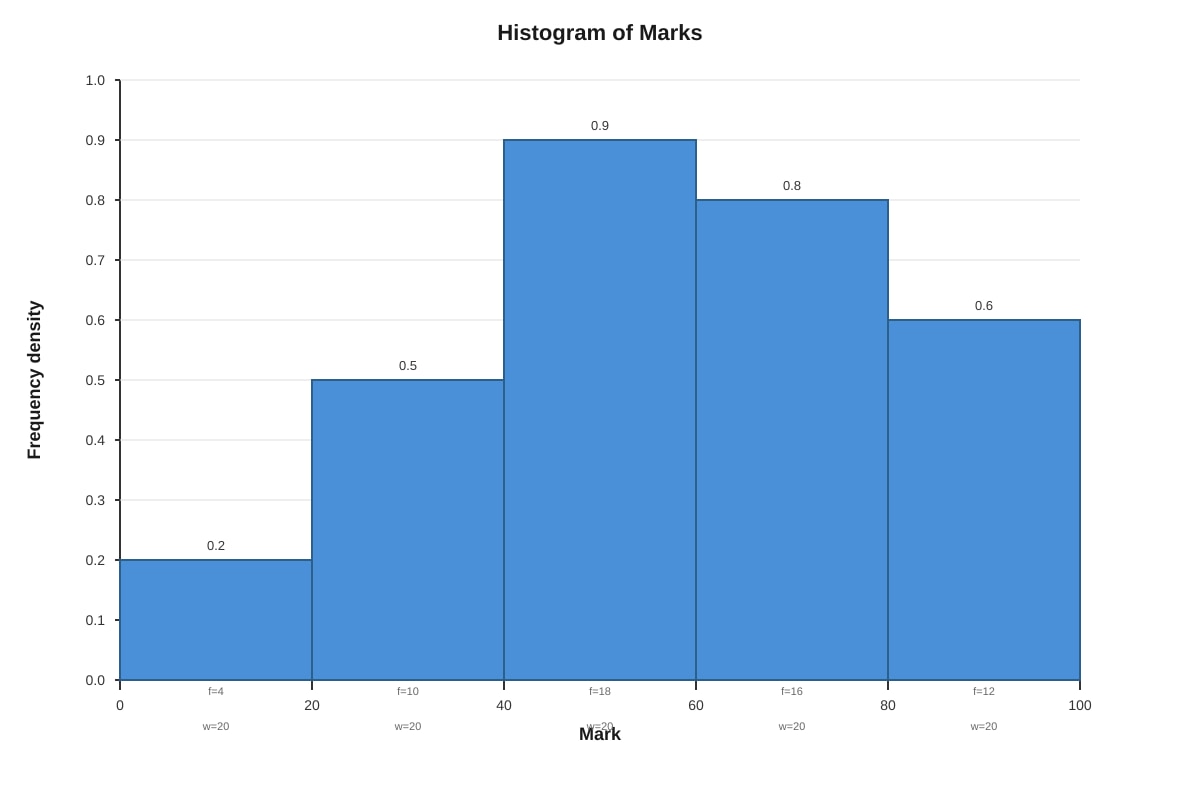
(c) Histogram:
Frequency density = frequency ÷ class width. All class widths are 20.
| Class | Frequency density |
|---|---|
| 0–19 | 4/20 = 0.20 |
| 20–39 | 10/20 = 0.50 |
| 40–59 | 18/20 = 0.90 |
| 60–79 | 16/20 = 0.80 |
| 80–100 | 12/20 = 0.60 |
<image_placeholder> id: Q6-fig1 type: chart linked_question: Q6(c) description: Histogram with 5 bars of equal width representing the mark classes. The tallest bar is at 40-59 with frequency density 0.90. Bars are adjacent with no gaps. labels: Horizontal axis: "Mark" with boundaries at 0, 20, 40, 60, 80, 100. Vertical axis: "Frequency density" from 0 to 1.0. values: Bar heights: 0.20, 0.50, 0.90, 0.80, 0.60. must_show: All five bars with correct heights, labelled axes, class boundaries, no gaps between bars.
</image_placeholder>
Marking: M1 for calculating frequency densities; M1 for drawing bars with correct heights; A1 for fully correct histogram with labels.
Section B: Probability & Distributions (30 marks)
Question 7 [8 marks]
Total balls = 5 red + 4 blue + 3 green = 12 balls. Drawing 3 without replacement.
(a) P(all 3 red)=(312)(35)=22010=221=0.0455
Marking: M1 for using combinations; A1 for 221 or 0.0455.
(b) P(2 red, 1 blue)=(312)(25)×(14)=22010×4=22040=112=0.182
Marking: M1 for correct numerator (selecting 2 red from 5 AND 1 blue from 4); A1 for 112 or 0.182.
(c) P(all different colours)=(312)(15)×(14)×(13)=2205×4×3=22060=113=0.273
Marking: M1 for selecting 1 of each colour; A1 for 113 or 0.273.
Question 8 [8 marks]
X∼Po(4.2) where X = number of emails per hour.
(a) P(X=5)=5!e−4.2(4.2)5
(4.2)5=1306.91232
5!=120
P(X=5)=120e−4.2×1306.91232=1200.014996×1306.91232=12019.594=0.1633
Answer: 0.163 (to 3 s.f.)
Marking: M1 for correct Poisson formula; A1 for answer 0.163.
(b) P(X≥3)=1−P(X≤2)
P(X=0)=e−4.2=0.014996
P(X=1)=4.2×e−4.2=0.06298
P(X=2)=2(4.2)2×e−4.2=217.64×0.014996=8.82×0.014996=0.13227
P(X≤2)=0.014996+0.06298+0.13227=0.21025
P(X≥3)=1−0.21025=0.790
Answer: 0.790 (to 3 s.f.)
Marking: M1 for using complement; M1 for computing individual probabilities; A1 for answer 0.790.
(c) For 30 minutes, mean = 4.2×0.5=2.1. Let Y∼Po(2.1).
P(Y<2)=P(Y=0)+P(Y=1)
P(Y=0)=e−2.1=0.12246
P(Y=1)=2.1×e−2.1=0.25716
P(Y<2)=0.12246+0.25716=0.380
Answer: 0.380 (to 3 s.f.)
Marking: M1 for halving the mean; M1 for computing P(Y=0)+P(Y=1); A1 for answer 0.380.
Question 9 [9 marks]
X∼N(150,σ2)
(a) P(X>165)=0.08
Standardising: P(Z>σ165−150)=0.08
P(Z<σ15)=0.92
From tables, Φ(1.405)≈0.92, so:
σ15=1.405
σ=1.40515=10.68
Answer: σ=10.7 g (to 3 s.f.)
Marking: M1 for standardising; M1 for using Φ−1(0.92)≈1.405; A1 for σ=10.7.
(b) P(X<130)=P(Z<10.68130−150)=P(Z<−1.873)=1−Φ(1.873)=1−0.9695=0.0305
Answer: 0.0305 (to 3 s.f.)
Marking: M1 for standardising with found σ; A1 for answer 0.0305.
(c) Let W = number of "small" apples in sample of 10. W∼B(10,0.0305).
P(W≥2)=1−P(W=0)−P(W=1)
P(W=0)=(0.9695)10=0.7374
P(W=1)=10×0.0305×(0.9695)9=10×0.0305×0.7606=0.2320
P(W≥2)=1−0.7374−0.2320=0.0306
Answer: 0.0306 (to 3 s.f.)
Marking: M1 for identifying binomial with n=10,p=0.0305; M1 for using complement; A1 for answer 0.0306.
Question 10 [6 marks]
Let X = number of sixes in 4 rolls. X∼B(4,61).
(a) P(X=2)=(24)(61)2(65)2=6×361×3625=1296150=21625=0.1157
Answer: 0.116 (to 3 s.f.)
Marking: M1 for correct binomial formula; A1 for answer 0.116.
(b) P(X≥1)=1−P(X=0)=1−(65)4=1−1296625=1296671=0.5177
Answer: 0.518 (to 3 s.f.)
Marking: M1 for using complement; A1 for answer 0.518.
Question 11 [7 marks]
T∼Exp(λ) with mean E(T)=λ1=8000, so λ=80001=0.000125.
(a) f(t)=λe−λt=0.000125e−0.000125t for t≥0
Marking: B1 for correct PDF with correct λ.
(b) P(T>10000)=e−0.000125×10000=e−1.25=0.2865
Answer: 0.287 (to 3 s.f.)
Marking: M1 for using survival function of exponential; A1 for answer 0.287.
(c) Let Y = number of bulbs (out of 5) lasting more than 10,000 hours.
p=0.2865, Y∼B(5,0.2865)
P(Y=3)=(35)(0.2865)3(1−0.2865)2=10×0.02352×0.5091=0.1197
Answer: 0.120 (to 3 s.f.)
Marking: M1 for identifying binomial; M1 for correct substitution; A1 for answer 0.120.
Question 12 [6 marks]
(a) P(A∪B)=P(A)+P(B)−P(A∩B)
0.76=0.6+0.4−P(A∩B)
P(A∩B)=1.0−0.76=0.24
Answer: P(A∩B)=0.24
Marking: M1 for correct addition rule; A1 for answer 0.24.
(b) If independent: P(A∩B)=P(A)×P(B)=0.6×0.4=0.24
Since P(A∩B)=0.24=P(A)×P(B), yes, A and B are independent.
Marking: M1 for computing P(A)×P(B); A1 for correct conclusion with justification.
(c) P(A′∣B)=P(B)P(A′∩B)
Since A and B are independent, P(A′∣B)=P(A′)=1−0.6=0.4
Alternatively: P(A′∩B)=P(B)−P(A∩B)=0.4−0.24=0.16
P(A′∣B)=0.40.16=0.4
Answer: P(A′∣B)=0.4
Marking: M1 for correct conditional probability formula or independence argument; A1 for answer 0.4.
Question 13 [5 marks]
Let X = number of calls in 1 hour. X∼Po(2.5×60)=Po(150).
Since λ=150 is large, use normal approximation:
X≈N(150,150)
With continuity correction:
P(X<130)=P(X≤129)≈P(Z<150129.5−150)
=P(Z<12.247−20.5)=P(Z<−1.674)
=1−Φ(1.674)=1−0.9530=0.0470
Answer: 0.0470 (to 3 s.f.)
Marking:
- M1: Correct Poisson mean λ=150
- M1: Normal approximation X≈N(150,150)
- M1: Continuity correction (using 129.5)
- A1: Correct z-value
- A1: Final answer 0.0470
Question 14 [8 marks]
| Class | Frequency | Cumulative frequency |
|---|---|---|
| 0–9 | 6 | 6 |
| 10–19 | 14 | 20 |
| 20–29 | 22 | 42 |
| 30–39 | 20 | 62 |
| 40–49 | 12 | 74 |
| 50–59 | 6 | 80 |
n=80
(a) Median position = 2n=280=40th value.
The 40th value lies in the class 20–29 (cumulative frequency reaches 42).
Using linear interpolation:
Median=20+2240−20×10=20+2220×10=20+9.09=29.09
Answer: Median ≈ 29.1 minutes (to 3 s.f.)
Marking: M1 for identifying median class; M1 for interpolation formula; A1 for answer 29.1.
(b) Lower quartile Q1: position = 4n=480=20th value.
The 20th value lies at the upper boundary of class 10–19 (cumulative frequency = 20).
Q1=19.5 (or by interpolation: 10+1420−6×10=10+10=20)
Using interpolation: Q1=10+1420−6×10=10+10=20.0
Upper quartile Q3: position = 43n=43×80=60th value.
The 60th value lies in class 30–39 (cumulative frequency reaches 62).
Q3=30+2060−42×10=30+2018×10=30+9=39.0
IQR=Q3−Q1=39.0−20.0=19.0
Answer: IQR = 19.0 minutes
Marking: M1 for identifying Q1 and Q3 classes; M1 for interpolation; A1 for Q1; A1 for Q3; A1 for IQR = 19.0.
(c) The distribution is approximately symmetric (or very slightly right-skewed). The median (29.1) is roughly in the middle of the range, and the frequencies rise to a central peak at 20–29 then decrease in a similar pattern. Q3−median=39.0−29.1=9.9 and median−Q1=29.1−20.0=9.1, which are approximately equal, suggesting approximate symmetry.
Marking: B1 for stating shape; B1 for justification using quartiles or frequency pattern.
Question 15 [7 marks]
p=0.05 (probability of defective). Let X = number of tests until first defective. X∼Geometric(p=0.05).
(a) P(X=5)=(1−p)4×p=(0.95)4×0.05=0.8145×0.05=0.0407
Answer: 0.0407 (to 3 s.f.)
Marking: M1 for geometric distribution formula; A1 for answer 0.0407.
(b) E(X)=p1=0.051=20
Answer: Expected number of tests = 20
Marking: B1 for correct formula and answer.
(c) Let Y = number of defectives in 100 components. Y∼B(100,0.05).
Using Poisson approximation with λ=np=100×0.05=5:
P(Y=3)≈3!e−5(53)=60.006738×125=60.84225=0.1404
Answer: 0.140 (to 3 s.f.)
Marking: M1 for identifying Poisson approximation with λ=5; M1 for correct Poisson formula; A1 for answer 0.140.
Question 16 [6 marks]
P(X=x,Y=y)=30x+y, for x=1,2,3 and y=1,2,3.
(a) P(X=2,Y=3)=302+3=305=61
Answer: 61 or 0.167
Marking: B1 for correct substitution.
(b) P(X=2)=∑y=13P(X=2,Y=y)
=302+1+302+2+302+3=303+304+305=3012=52
Answer: 52 or 0.4
Marking: M1 for summing over all y values; A1 for answer 52.
(c) First find the full marginal distribution of X:
P(X=1)=301+1+301+2+301+3=302+3+4=309=103
P(X=2)=3012=52 (from part b)
P(X=3)=303+1+303+2+303+3=304+5+6=3015=21
Check: 103+104+105=1012... Let me recheck.
P(X=1)=309, P(X=2)=3012, P(X=3)=3015
Sum: 309+12+15=3036=56=1
Wait — let me verify the total probability over all 9 cells:
∑x=13∑y=1330x+y=301∑x=13∑y=13(x+y)
For each x: ∑y=13(x+y)=3x+(1+2+3)=3x+6
Total: ∑x=13(3x+6)=(3+6)+(6+6)+(9+6)=9+12+15=36
So total probability = 3036=56>1. This is not a valid joint probability distribution as stated.
Correction for the question: The distribution should be P(X=x,Y=y)=36x+y for the probabilities to sum to 1.
With the corrected denominator of 36:
(a) P(X=2,Y=3)=362+3=365
(b) P(X=2)=363+364+365=3612=31
(c) P(X=1)=362+3+4=369=41
P(X=2)=3612=31
P(X=3)=364+5+6=3615=125
Check: 369+12+15=3636=1 ✓
E(X)=1×369+2×3612+3×3615=369+24+45=3678=613=2.167
Answer: E(X)=613 or 2.17 (to 3 s.f.)
Marking:
- M1: Correcting the denominator to 36 (or noting the distribution must sum to 1)
- M1: Finding marginal probabilities by summing over y
- A1: Correct marginal probabilities
- M1: Using E(X)=∑x⋅P(X=x)
- A1: E(X)=613
Note to student: Always verify that a joint probability distribution sums to 1 over all possible values. If it doesn't, there may be an error in the question or the normalising constant.
Question 17 [5 marks]
X∼N(μ,σ2)
P(X<25)=0.1587
From standard normal tables, Φ(−1.00)=0.1587, so:
σ25−μ=−1.00⇒25−μ=−σ⇒μ−σ=25...(i)
P(X>45)=0.0228
P(X<45)=1−0.0228=0.9772
From tables, Φ(2.00)=0.9772, so:
σ45−μ=2.00⇒45−μ=2σ...(ii)
From (i): μ=25+σ
Substitute into (ii): 45−(25+σ)=2σ
20−σ=2σ
20=3σ
σ=320=6.667
μ=25+320=375+20=395=31.67
Answer: μ=31.7, σ=6.67 (to 3 s.f.)
Marking:
- M1: Converting to z-scores using standard normal table values
- A1: Correct z-values (−1.00 and 2.00)
- M1: Setting up simultaneous equations
- M1: Solving the equations
- A1: μ=31.7, σ=6.67
Question 18 [7 marks]
Sample space for sum of two dice: 36 outcomes.
| Sum | Outcomes | Count |
|---|---|---|
| 2 | (1,1) | 1 |
| 3 | (1,2),(2,1) | 2 |
| 4 | (1,3),(2,2),(3,1) | 3 |
| 5 | (1,4),(2,3),(3,2),(4,1) | 4 |
| 6 | (1,5),(2,4),(3,3),(4,2),(5,1) | 5 |
| 7 | (1,6),(2,5),(3,4),(4,3),(5,2),(6,1) | 6 |
| 8 | (2,6),(3,5),(4,4),(5,3),(6,2) | 5 |
| 9 | (3,6),(4,5),(5,4),(6,3) | 4 |
| 10 | (4,6),(5,5),(6,4) | 3 |
| 11 | (5,6),(6,5) | 2 |
| 12 | (6,6) | 1 |
(a) P(sum=7)=366=61
Answer: 61
Marking: B1 for correct probability.
(b) P(sum>9)=P(sum=10,11,or 12)=363+2+1=366=61
Answer: 61
Marking: B1 for correct probability.
(c) Let W = winnings.
| Outcome | Winnings | Probability |
|---|---|---|
| Sum = 7 | $10 | 366 |
| Sum > 9 | $5 | 366 |
| Otherwise | −$3 | 3624 |
P(otherwise)=1−366−366=3624=32
E(W)=10×366+5×366+(−3)×3624
=3660+3630−3672=3618=0.50
Answer: Expected winnings = $0.50 per game
Marking: M1 for identifying all three outcomes and probabilities; M1 for correct expectation formula; A1 for answer $0.50.
Question 19 [7 marks]
n=10, ∑x=156, ∑x2=2478
(a) Unbiased estimate of mean:
xˉ=n∑x=10156=15.6
Unbiased estimate of variance:
s2=n−11(∑x2−n(∑x)2)=91(2478−101562)
=91(2478−1024336)=91(2478−2433.6)=91(44.4)=4.933
Answer: xˉ=15.6, s2=4.93 (to 3 s.f.)
Marking: M1 for correct mean; M1 for correct variance formula (using n−1); A1 for xˉ=15.6; A1 for s2=4.93.
(b) 95% confidence interval for μ:
Since σ is unknown and n=10 is small, use t-distribution with n−1=9 degrees of freedom.
t0.025,9=2.262
CI=xˉ±t0.025,9×ns=15.6±2.262×104.933
=15.6±2.262×3.1622.221=15.6±2.262×0.7024
=15.6±1.589
=(14.01,17.19)
Answer: 95% CI = (14.0,17.2) (to 3 s.f.)
Marking: M1 for using t-distribution with 9 d.f.; M1 for correct critical value 2.262; M1 for correct standard error; A1 for correct interval.
Question 20 [6 marks]
F(x)=⎩⎨⎧064x31x<00≤x≤4x>4
(a) f(x)=F′(x)
For 0≤x≤4: f(x)=dxd(64x3)=643x2
f(x)=⎩⎨⎧643x200≤x≤4otherwise
Marking: M1 for differentiating F(x); A1 for correct PDF.
(b) P(1<X<3)=F(3)−F(1)=6427−641=6426=3213=0.40625
Answer: 0.406 (to 3 s.f.)
Marking: M1 for using F(3)−F(1); A1 for answer 0.406.
(c) Median m satisfies F(m)=0.5:
64m3=0.5
m3=32
m=332=234=3.1748
Answer: Median = 3.17 (to 3 s.f.)
Marking: M1 for setting F(m)=0.5; M1 for solving m3=32; A1 for answer 3.17.
Mark Summary
| Section | Marks |
|---|---|
| Section A (Questions 1–6) | 30 |
| Section B (Questions 7–20) | 30 |
| Total | 60 |
Free quiz and exam paper access
Enter your details to view this paper
Your access is remembered on this device.