AI Generated Exam Paper
A Level H1 Mathematics Practice Paper 2
Free A Level H1 Maths Practice Paper 2, HY3 AI version, with questions, answers, and A Level-style practice for Singapore students.
These static practice materials are generated from the site's syllabus and paper-generation workflow, with source and model context shown so students and parents can evaluate the material before use.
Questions
TuitionGoWhere Practice Paper - Maths H1 A-Level
TuitionGoWhere Practice Paper (AI) — Version 2
Subject: Maths H1
Level: A-Level
Paper: Practice Paper (Statistics Probability Focus)
Duration: 1 hour 30 minutes
Total Marks: 60
Name: ________________________
Class: ________________________
Date: ________________________
Instructions:
- This is a topic-based practice paper on Statistics & Probability (Syllabus 8865).
- Answer all questions.
- Show all working clearly. Calculator (non-CAS GC) is allowed.
- Marks for each question are shown in brackets.
- Section marks and total marks are given at the end of each section.
Section A: Probability and Counting (Questions 1–6) [15 marks]
1. A committee of 4 students is to be formed from 7 boys and 5 girls. Find the number of ways to form the committee if it must contain exactly 2 boys and 2 girls. [2]
2. A bag contains 6 red and 4 blue marbles. Two marbles are drawn at random without replacement.
(a) Draw a tree diagram to represent the possible outcomes and their probabilities. [2]
(b) Find the probability that both marbles are of the same colour. [2]
3. Events A and B are such that P(A)=0.55, P(B)=0.40, and P(A∩B)=0.20.
(a) Find P(A∪B). [1]
(b) Determine whether A and B are independent. Justify your answer. [2]
4. In a survey, 30% of residents use cycling as their main transport. A random sample of 15 residents is selected. Let X be the number who cycle as main transport. Assuming X ~ B(15, 0.30), find P(X≥6). [2]
5. A card is drawn from a standard pack of 52 cards. Find the probability that it is a heart given that it is a red card. [2]
6. The password of a system consists of 3 distinct letters chosen from A, B, C, D, E. Find the number of possible passwords. [2]
Section A Total: 15 marks
Section B: Distributions and Sampling (Questions 7–13) [22 marks]
7. The mass of a certain fruit follows a normal distribution with mean 120 g and standard deviation 15 g.
(a) Find the probability that a randomly chosen fruit has mass between 105 g and 135 g. [2]
(b) Find the 90th percentile of the mass. [2]
8. A discrete random variable X ~ B(20, 0.25). Find the mean and variance of X. [2]
9. A random sample of 12 students has the following weekly study hours:
14, 16, 15, 18, 12, 17, 15, 19, 13, 16, 15, 14.
Find the unbiased estimates of the population mean and variance. [3]
10. The weights of adult women are normally distributed with mean 62 kg and standard deviation 7 kg. A sample of 36 women is taken. By the Central Limit Theorem, state the distribution of the sample mean Xˉ and find P(Xˉ>64). [3]
11. The time taken to complete a task is normally distributed with mean 50 minutes and standard deviation 8 minutes. Find the probability that a randomly selected person takes less than 40 minutes. [2]
12. A factory produces bulbs with 4% defect rate. In a box of 50 bulbs, using X ~ B(50, 0.04), find the probability that at most 2 are defective. [2]
13. A population has mean μ=200 and variance σ2=64. Let Y=3X−10 where X is a random observation. Find E(Y) and Var(Y). [2]
Section B Total: 22 marks
Section C: Hypothesis Testing, Correlation and Regression (Questions 14–20) [23 marks]
14. A researcher claims that the mean daily screen time of teenagers is 5.0 hours. A random sample of 35 teenagers gives mean 5.4 hours and standard deviation 1.2 hours. Test at 5% significance whether the mean is greater than 5.0 hours. [5]
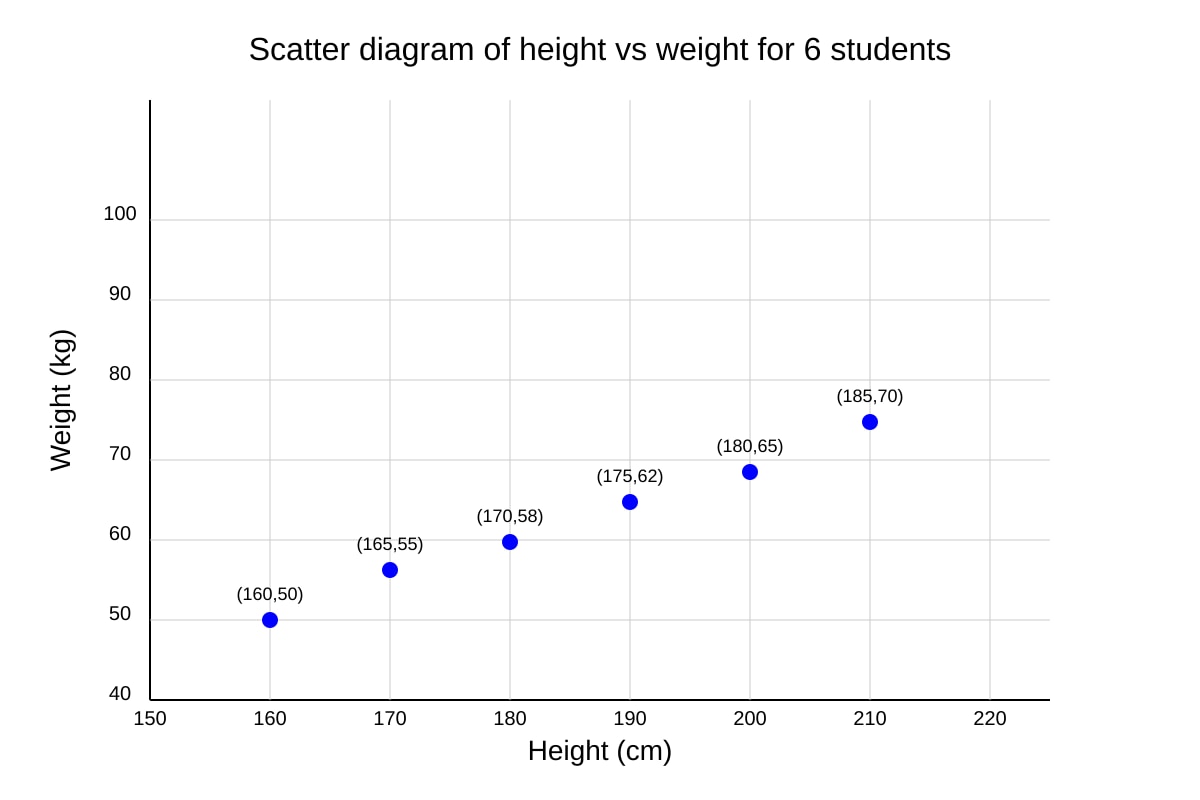
15. The heights (cm) and weights (kg) of 6 students are:
| Height (x) | 160 | 165 | 170 | 175 | 180 | 185 |
|---|---|---|---|---|---|---|
| Weight (y) | 50 | 55 | 58 | 62 | 65 | 70 |
(a) Give a sketch of the scatter diagram for the data. [2]
Image pending generation: scatter_diagram for Q15.
(b) The product moment correlation coefficient is r=0.98. Comment on the relationship. [2]
16. For the data in Q15, the regression line of y on x is y=0.75x−72. Estimate the weight of a student with height 172 cm. [2]
17. A study finds correlation r=−0.65 between hours of exercise and stress score. Explain why this does not prove exercise causes lower stress. [2]
18. A sample of 40 observations has ∑x=820, ∑x2=17200. Find unbiased estimates of mean and variance. [3]
19. Two independent normal variables: X∼N(10,4), Y∼N(20,9). Find E(2X−Y) and Var(2X−Y). [3]
20. A teacher claims students score above 70 on average. Sample of 32 students: mean 73, s.d. 8. Test at 1% if mean > 70. [3]
Section C Total: 23 marks
Paper Total: 60 marks
Answers
TuitionGoWhere Practice Paper - Maths H1 A-Level (Version 2) Answer Key
Subject: Maths H1
Level: A-Level
Total Marks: 60
Section A: Probability and Counting
1. [2]
Choose 2 boys from 7: (27)=21
Choose 2 girls from 5: (25)=10
Total = 21×10=210 ways.
Teaching note: Use combinations since order does not matter. Common mistake: using permutations.
2. [4]
(a) [2] Tree diagram:
First draw: R (6/10), B (4/10).
Second draw without replacement:
- After R: R (5/9), B (4/9)
- After B: R (6/9), B (3/9)
Marking: Correct branches and probabilities.
(b) [2] Same colour = RR or BB:
P(RR)=106×95=9030
P(BB)=104×93=9012
Total = 9042=157≈0.467
Note: Without replacement reduces denominator to 9.
3. [3]
(a) [1] P(A∪B)=0.55+0.40−0.20=0.75
(b) [2] Independent if P(A∩B)=P(A)P(B).
P(A)P(B)=0.55×0.40=0.22=0.20. Not independent.
Teaching: Compare product to intersection.
4. [2]
X∼B(15,0.30). P(X≥6)=1−P(X≤5).
Using GC/binomial CDF: P(X≤5)≈0.7216, so answer ≈0.278.
Note: Do not use normal approximation (excluded).
5. [2]
Red cards = 26, hearts = 13. Given red, P(heart)=13/26=0.5.
Formula: P(H∣R)=P(H∩R)/P(R)=(13/52)/(26/52)=0.5.
6. [2]
3 distinct letters from 5, order matters: 5P3=5×4×3=60.
Note: Password order matters → permutation.
Section A Total: 15 marks
Section B: Distributions and Sampling
7. [4]
(a) [2] X∼N(120,152).
Z1=(105−120)/15=−1, Z2=(135−120)/15=1.
P(−1<Z<1)=Φ(1)−Φ(−1)=0.8413−0.1587=0.6826.
(b) [2] 90th percentile: Z0.90=1.282, x=120+1.282(15)=139.23 g.
8. [2]
Mean = np=20×0.25=5.
Variance = np(1−p)=20×0.25×0.75=3.75.
9. [3]
n=12, ∑x=14+16+15+18+12+17+15+19+13+16+15+14=184.
xˉ=184/12=15.33 h.
∑x2=196+256+225+324+144+289+225+361+169+256+225+196=2866.
s2=112866−12(15.333)2=112866−2823.11=3.90 h².
Marking: 1 for mean, 2 for variance with unbiased denominator.
10. [3]
By CLT, Xˉ∼N(62,72/36)=N(62,1.361).
P(Xˉ>64)=P(Z>(64−62)/(7/6))=P(Z>1.714)=0.0433.
Note: CLT applies as n=36 ≥ 30.
11. [2]
Z=(40−50)/8=−1.25, P(Z<−1.25)=0.1056.
12. [2]
X∼B(50,0.04). P(X≤2)=P(0)+P(1)+P(2)≈0.1299+0.2706+0.2762=0.6767.
(GC CDF: 0.6767)
13. [2]
E(Y)=3E(X)−10=3(200)−10=590.
Var(Y)=32Var(X)=9×64=576.
Section B Total: 22 marks
Section C: Hypothesis Testing, Correlation and Regression
14. [5]
H0:μ=5.0, H1:μ>5.0 (1 mark)
Test stat: Z=1.2/355.4−5.0=0.20290.4=1.97 (2 marks)
Critical 5% one-tail: 1.645 (1 mark)
Since 1.97 > 1.645, reject H0 (0.5 mark)
There is evidence at 5% that mean daily screen time > 5.0 h (0.5 mark).
15. [4]
(a) [2] Scatter diagram: x-axis 160–185, y-axis 50–70, points plotted as per placeholder, upward trend.
(b) [2] r=0.98 → strong positive linear correlation between height and weight.
16. [2]
y=0.75(172)−72=129−72=57 kg.
17. [2]
Correlation ≠ causation; confounding variables (diet, sleep) may affect both; or reverse causality possible. (2 points)
18. [3]
n=40, xˉ=820/40=20.5.
s2=3917200−40(20.5)2=3917200−16810=9.97.
19. [3]
E(2X−Y)=2(10)−20=0.
Var(2X−Y)=4(4)+9=25 (independent → add variances with coefficients squared).
20. [3]
H0:μ=70, H1:μ>70.
Z=(73−70)/(8/32)=3/1.414=2.12.
1% crit = 2.326. Not reject; insufficient evidence mean > 70.
Section C Total: 23 marks
Paper Total: 60 marks
Free quiz and exam paper access
Enter your details to view this paper
Your access is remembered on this device.