AI Generated Exam Paper
A Level H1 Mathematics Practice Paper 1
Free A Level H1 Maths Practice Paper 1, LongCat AI version, with questions, answers, and A Level-style practice for Singapore students.
These static practice materials are generated from the site's syllabus and paper-generation workflow, with source and model context shown so students and parents can evaluate the material before use.
Questions
TuitionGoWhere Practice Paper - Maths H1 A-Level
TuitionGoWhere Practice Paper (AI)
Subject: Mathematics H1 Level: A-Level Paper: Practice Paper — Statistics & Probability Duration: 1 hour 30 minutes Total Marks: 60 Name: ___________________________ Class: ___________________________ Date: ___________________________
Instructions
- Write your answers in the spaces provided.
- Show all working clearly. Marks are awarded for correct method even if the final answer is wrong.
- Give answers correct to 3 significant figures unless otherwise stated.
- A graphing calculator may be used where appropriate.
- The total marks for this paper is 60.
- The number of marks is shown in brackets [ ] at the end of each question or part-question.
Section A: Pure Statistics (30 marks)
Answer all questions in this section.
Question 1
A random sample of 8 students recorded the number of hours they spent on revision in a week:
12, 15, 10, 18, 14, 11, 16, 13
Calculate the unbiased estimates of the population mean and population variance.
[4]
Question 2
The random variable X∼B(20,0.35).
(a) Find P(X=7).
[2]
(b) Find P(X≥6).
[2]
Question 3
A factory produces light bulbs, and 5% are defective. A random sample of 20 bulbs is selected.
(a) State two conditions under which a binomial model is appropriate for the number of defective bulbs.
[2]
(b) Using a binomial distribution, find the probability that exactly 2 bulbs are defective.
[2]
Question 4
The heights of adult women in a city are normally distributed with mean 162 cm and standard deviation 5.4 cm.
(a) Find the probability that a randomly selected woman has a height between 158 cm and 168 cm.
[3]
(b) A random sample of 10 women is selected. Find the probability that at least 8 of them have heights between 158 cm and 168 cm.
[3]
Question 5
A researcher collects data on the daily screen time (in hours) of 10 teenagers:
4.2, 5.8, 3.5, 6.1, 7.3, 4.9, 5.2, 6.5, 3.8, 5.6
(a) Calculate the median and interquartile range of the data.
[3]
(b) Determine whether there are any outliers using the 1.5×IQR rule. Show your working clearly.
[3]
Question 6
The following table shows the cumulative frequency distribution of the masses (in kg) of 80 packages:
| Mass (kg) | Cumulative Frequency |
|---|---|
| 0<m≤2 | 8 |
| 0<m≤4 | 22 |
| 0<m≤6 | 45 |
| 0<m≤8 | 65 |
| 0<m≤10 | 80 |
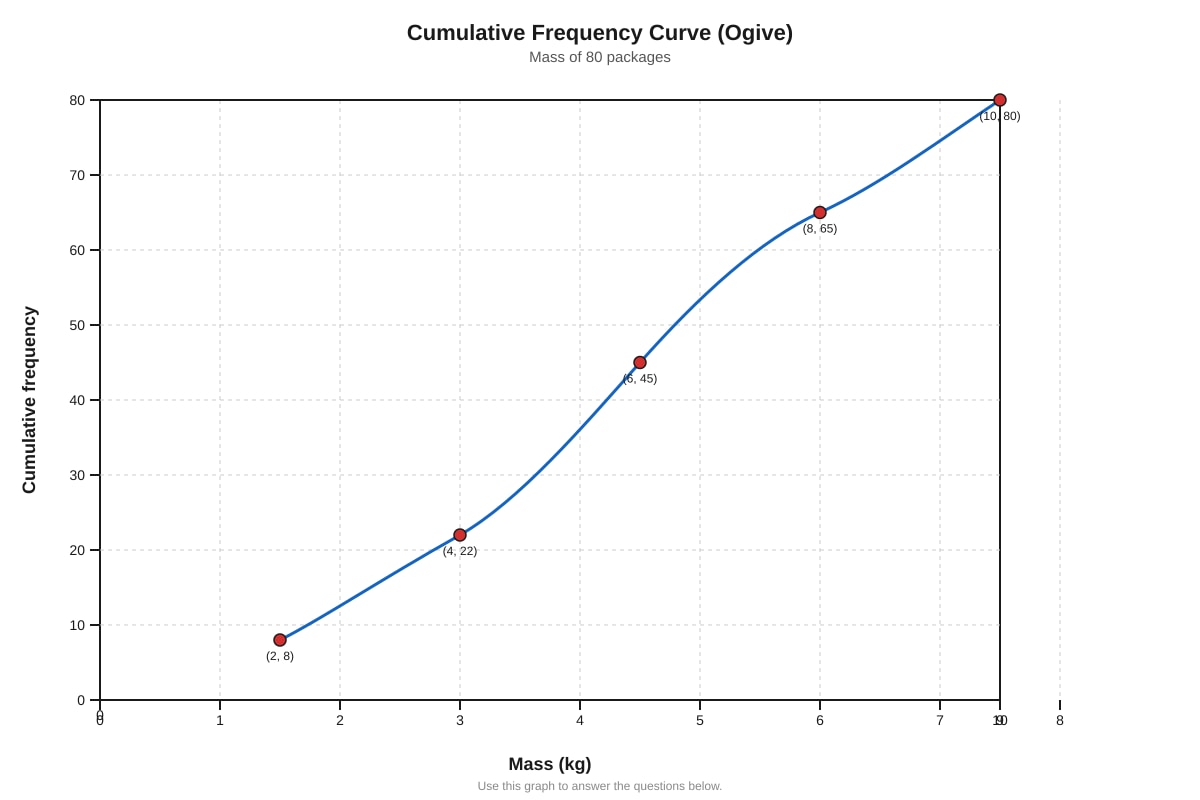
Generated graph for Q6.
(a) Draw a cumulative frequency curve to represent the data.
[2]
(b) Use your graph to estimate the median mass.
[1]
(c) Use your graph to estimate the 90th percentile.
[1]
Section B: Probability & Distributions (30 marks)
Answer all questions in this section.
Question 7
A discrete random variable X has the following probability distribution:
| x | 1 | 2 | 3 | 4 | 5 |
|---|---|---|---|---|---|
| P(X=x) | 0.1 | 0.2 | a | 0.3 | 0.15 |
(a) Find the value of a.
[1]
(b) Find E(X) and Var(X).
[4]
Question 8
The number of emails received by an employee per hour follows a Poisson distribution with mean 4.2.
(a) Find the probability that the employee receives exactly 5 emails in a given hour.
[2]
(b) Find the probability that the employee receives at least 3 emails in a given hour.
[3]
(c) Find the probability that the employee receives fewer than 2 emails in each of two consecutive hours.
[2]
Question 9
A continuous random variable X has probability density function given by
f(x)={kx(6−x)00≤x≤6otherwise
(a) Show that k=361.
[2]
(b) Find E(X).
[2]
(c) Find P(X>4).
[3]
Question 10
In a large population, the time taken to complete a certain task is normally distributed with mean 45 minutes and standard deviation 8 minutes.
(a) Find the probability that a randomly selected person takes more than 50 minutes.
[2]
(b) Find the value of t such that P(X<t)=0.75.
[3]
(c) A random sample of 25 people is selected. Using the Central Limit Theorem, find the probability that the sample mean time is less than 43 minutes.
[3]
Question 11
A bag contains 5 red balls, 4 blue balls, and 3 green balls. Three balls are drawn at random without replacement.
(a) Find the probability that all three balls are red.
[2]
(b) Find the probability that the three balls are of different colours.
[3]
(c) Given that at least one ball is red, find the probability that exactly two balls are red.
[3]
Question 12
A market researcher surveys 200 adults to investigate whether there is an association between age group and preference for online shopping. The results are summarised in the table below:
| Prefer Online | Prefer In-Store | Total | |
|---|---|---|---|
| Under 40 | 62 | 28 | 90 |
| 40 and over | 48 | 62 | 110 |
| Total | 110 | 90 | 200 |
(a) Calculate the expected frequency for the cell corresponding to "Under 40" and "Prefer Online" under the assumption of no association.
[2]
(b) Perform a chi-squared test at the 5% significance level to determine whether there is evidence of association between age group and shopping preference. State your hypotheses clearly.
[6]
(c) State your conclusion in context.
[1]
End of Paper
Answers
TuitionGoWhere Practice Paper — Maths H1 A-Level
Answer Key & Marking Scheme
Subject: Mathematics H1 Paper: Practice Paper — Statistics & Probability Total Marks: 60
Section A: Pure Statistics (30 marks)
Question 1 [4 marks]
Data: 12, 15, 10, 18, 14, 11, 16, 13; n=8
Unbiased estimate of the population mean:
xˉ=n∑xi=812+15+10+18+14+11+16+13=8109=13.625
Unbiased estimate of the population variance:
s2=n−1∑(xi−xˉ)2
| xi | xi−xˉ | (xi−xˉ)2 |
|---|---|---|
| 12 | −1.625 | 2.640625 |
| 15 | 1.375 | 1.890625 |
| 10 | −3.625 | 13.140625 |
| 18 | 4.375 | 19.140625 |
| 14 | 0.375 | 0.140625 |
| 11 | −2.625 | 6.890625 |
| 16 | 2.375 | 5.640625 |
| 13 | −0.625 | 0.390625 |
∑(xi−xˉ)2=49.875
s2=749.875=7.125
Answers:
- Unbiased estimate of mean = 13.6 (or 13.625 hours)
- Unbiased estimate of variance = 7.13 (or 7.125 hours²)
Marking:
- [1] Correct calculation of xˉ=13.625
- [1] Correct setup of s2 formula with n−1=7 in denominator
- [1] Correct sum of squared deviations (or correct use of ∑xi2−nxˉ2 method)
- [1] Correct final answer s2=7.125
Common mistakes:
- Using n=8 instead of n−1=7 in the variance denominator (this gives the biased estimate, not the unbiased estimate).
- Rounding too early; keep full precision in intermediate steps.
Question 2 [4 marks]
X∼B(20,0.35)
(a) P(X=7)=(720)(0.35)7(0.65)13
=77520×(0.35)7×(0.65)13
=77520×0.0006434...×0.009041...
=0.184(3 s.f.)
(b) P(X≥6)=1−P(X≤5)
Using calculator/binomial tables:
P(X≤5)=∑k=05(k20)(0.35)k(0.65)20−k=0.2454...
P(X≥6)=1−0.2454=0.755(3 s.f.)
Marking:
- (a) [1] Correct binomial probability formula setup; [1] Correct answer 0.184
- (b) [1] Correct use of complement 1−P(X≤5); [1] Correct answer 0.755
Question 3 [4 marks]
(a) Two conditions for a binomial model:
- Each trial (each bulb) has only two outcomes: defective or not defective.
- The probability of a bulb being defective is constant (5%) for each bulb, and the bulbs are independent of each other.
(b) Let X∼B(20,0.05) be the number of defective bulbs.
P(X=2)=(220)(0.05)2(0.95)18
=190×0.0025×0.3972...
=0.189(3 s.f.)
Marking:
- (a) [1] Two correct conditions stated (any valid pair: fixed trials, two outcomes, constant probability, independence)
- (b) [1] Correct binomial setup; [1] Correct answer 0.189
Question 4 [6 marks]
Let X∼N(162,5.42)
(a) P(158<X<168)
Standardise: Z=5.4X−162
P(5.4158−162<Z<5.4168−162)=P(−0.7407<Z<1.1111)
=Φ(1.1111)−Φ(−0.7407)=Φ(1.1111)−[1−Φ(0.7407)]
=0.8667−(1−0.7706)=0.8667−0.2294=0.637(3 s.f.)
(b) Let p=P(158<X<168)=0.6373. Let Y∼B(10,0.6373).
P(Y≥8)=P(Y=8)+P(Y=9)+P(Y=10)
=(810)(0.6373)8(0.3627)2+(910)(0.6373)9(0.3627)1+(1010)(0.6373)10
=45×0.02703×0.1315+10×0.01723×0.3627+1×0.01098
=0.1598+0.0625+0.0110=0.233(3 s.f.)
Marking:
- (a) [1] Correct standardisation; [1] Correct use of Φ values; [1] Answer 0.637
- (b) [1] Correct identification of binomial with p=0.6373; [1] Correct calculation of P(Y≥8); [1] Answer 0.233
Question 5 [6 marks]
Data (sorted): 3.5, 3.8, 4.2, 4.9, 5.2, 5.6, 5.8, 6.1, 6.5, 7.3
(a) n=10
Median = average of 5th and 6th values = 25.2+5.6=5.4 hours
Lower quartile Q1 = median of lower half (3.5, 3.8, 4.2, 4.9, 5.2) = 4.2 hours
Upper quartile Q3 = median of upper half (5.6, 5.8, 6.1, 6.5, 7.3) = 6.1 hours
IQR = Q3−Q1=6.1−4.2=1.9 hours
(b) Lower fence = Q1−1.5×IQR=4.2−1.5(1.9)=4.2−2.85=1.35
Upper fence = Q3+1.5×IQR=6.1+1.5(1.9)=6.1+2.85=8.95
All data values lie between 1.35 and 8.95, so there are no outliers.
Marking:
- (a) [1] Correct median = 5.4; [1] Correct Q1 and Q3; [1] Correct IQR = 1.9
- (b) [1] Correct lower and upper fence calculations; [1] Correct comparison with data; [1] Correct conclusion (no outliers)
Question 6 [4 marks]
(a) The cumulative frequency curve (ogive) is plotted with upper class boundaries on the x-axis and cumulative frequency on the y-axis, passing through the points (2, 8), (4, 22), (6, 45), (8, 65), (10, 80), joined by a smooth curve.
(b) Median corresponds to cumulative frequency = 280=40. Reading from the graph at y=40, the median ≈ 5.5 kg.
(c) 90th percentile corresponds to cumulative frequency = 0.9×80=72. Reading from the graph at y=72, the 90th percentile ≈ 8.7 kg.
Marking:
- (a) [1] Correct points plotted; [1] Smooth curve drawn
- (b) [1] Median ≈ 5.5 kg (accept 5.3–5.7)
- (c) [1] 90th percentile ≈ 8.7 kg (accept 8.5–8.9)
Note for image placeholder: The ogive must show a smooth increasing curve through all five points, with clearly labelled axes and grid lines to allow reading off values at cumulative frequencies 40 and 72.
Section B: Probability & Distributions (30 marks)
Question 7 [5 marks]
(a) Sum of probabilities = 1:
0.1+0.2+a+0.3+0.15=1 0.75+a=1 a=0.25
(b) E(X)=∑x⋅P(X=x)
=1(0.1)+2(0.2)+3(0.25)+4(0.3)+5(0.15) =0.1+0.4+0.75+1.2+0.75=3.2
E(X2)=12(0.1)+22(0.2)+32(0.25)+42(0.3)+52(0.15) =0.1+0.8+2.25+4.8+3.75=11.7
Var(X)=E(X2)−[E(X)]2=11.7−(3.2)2=11.7−10.24=1.46
Marking:
- (a) [1] a=0.25
- (b) [1] Correct E(X)=3.2; [1] Correct E(X2)=11.7; [1] Correct Var(X)=1.46
Question 8 [7 marks]
X∼Po(4.2)
(a) P(X=5)=5!e−4.2(4.2)5
=120e−4.2×1306.91=1200.0150×1306.91=0.163(3 s.f.)
(b) P(X≥3)=1−P(X≤2)
P(X=0)=e−4.2=0.0150 P(X=1)=4.2e−4.2=0.0630 P(X=2)=2(4.2)2e−4.2=217.64×0.0150=0.1323
P(X≤2)=0.0150+0.0630+0.1323=0.2103
P(X≥3)=1−0.2103=0.790(3 s.f.)
(c) P(X<2)=P(X=0)+P(X=1)=0.0150+0.0630=0.0780
For two consecutive hours (independent):
P(fewer than 2 in each of 2 hours)=(0.0780)2=0.00608(3 s.f.)
Marking:
- (a) [1] Correct Poisson formula; [1] Answer 0.163
- (b) [1] Correct complement approach; [1] Correct P(X≤2); [1] Answer 0.790
- (c) [1] Correct P(X<2)=0.0780; [1] Answer 0.00608
Question 9 [7 marks]
(a) For a valid PDF: ∫06kx(6−x)dx=1
∫06k(6x−x2)dx=k[3x2−3x3]06
=k[3(36)−3216]=k[108−72]=36k
36k=1⟹k=361✓ shown
(b) E(X)=∫06x⋅361x(6−x)dx=361∫06(6x2−x3)dx
=361[2x3−4x4]06=361[2(216)−41296]
=361[432−324]=36108=3
(c) P(X>4)=∫46361x(6−x)dx=361[3x2−3x3]46
At x=6: 3(36)−3216=108−72=36
At x=4: 3(16)−364=48−21.333=26.667
P(X>4)=361(36−26.667)=369.333=0.259(3 s.f.)
Marking:
- (a) [1] Correct integration setup; [1] Correct result k=361
- (b) [1] Correct expectation integral setup; [1] Answer E(X)=3
- (c) [1] Correct definite integral from 4 to 6; [1] Correct evaluation at both limits; [1] Answer 0.259
Question 10 [8 marks]
X∼N(45,82)
(a) P(X>50)=P(Z>850−45)=P(Z>0.625)
=1−Φ(0.625)=1−0.7340=0.266(3 s.f.)
(b) P(X<t)=0.75
Φ(z)=0.75⟹z=0.6745
8t−45=0.6745⟹t=45+8(0.6745)=45+5.396=50.4(3 s.f.)
(c) By CLT, Xˉ∼N(45,2582)=N(45,2.56)
P(Xˉ<43)=P(Z<2.5643−45)=P(Z<1.6−2)=P(Z<−1.25)
=1−Φ(1.25)=1−0.8944=0.106(3 s.f.)
Marking:
- (a) [1] Correct standardisation; [1] Answer 0.266
- (b) [1] Correct z-value for 0.75; [1] Correct answer t=50.4
- (c) [1] Correct application of CLT with σ2/n; [1] Correct standardisation; [1] Answer 0.106
Question 11 [8 marks]
Total balls = 5 red + 4 blue + 3 green = 12 balls. Choose 3 without replacement.
(a) P(all 3 red)=(312)(35)=22010=221=0.0455
(b) P(all different colours)=P(1 red,1 blue,1 green)
=(312)(15)×(14)×(13)=2205×4×3=22060=113=0.273
(c) Let A = "exactly 2 red", B = "at least 1 red". We want P(A∣B)=P(B)P(A).
P(exactly 2 red)=(312)(25)(17)=22010×7=22070=227
P(no red)=(312)(37)=22035=447
P(at least 1 red)=1−22035=220185=4437
P(A∣B)=185/22070/220=18570=3714=0.378(3 s.f.)
Marking:
- (a) [1] Correct combination setup; [1] Answer 221 or 0.0455
- (b) [1] Correct numerator (product of three combinations); [1] Correct denominator; [1] Answer 113 or 0.273
- (c) [1] Correct conditional probability setup; [1] Correct P(exactly 2 red); [1] Correct P(at least 1 red); [1] Answer 0.378
Question 12 [9 marks]
(a) Expected frequency for "Under 40" and "Prefer Online":
E=grand totalrow total×column total=20090×110=49.5
(b) Hypotheses:
- H0: There is no association between age group and shopping preference.
- H1: There is an association between age group and shopping preference.
Expected frequencies:
| Prefer Online | Prefer In-Store | |
|---|---|---|
| Under 40 | 20090×110=49.5 | 20090×90=40.5 |
| 40 and over | 200110×110=60.5 | 200110×90=49.5 |
Chi-squared statistic:
χ2=∑E(O−E)2
=49.5(62−49.5)2+40.5(28−40.5)2+60.5(48−60.5)2+49.5(62−49.5)2
=49.5156.25+40.5156.25+60.5156.25+49.5156.25
=3.157+3.858+2.583+3.157=12.75
Degrees of freedom = (2−1)(2−1)=1
Critical value at 5% significance level with 1 d.f. = 3.841
Since 12.75>3.841, we reject H0.
(c) There is sufficient evidence at the 5% significance level to conclude that there is an association between age group and shopping preference.
Marking:
- (a) [1] Correct expected frequency formula; [1] Answer 49.5
- (b) [1] Correct hypotheses stated; [1] All four expected frequencies correct; [1] Correct chi-squared calculation; [1] Correct degrees of freedom; [1] Correct comparison with critical value; [1] Correct decision (reject H0)
- (c) [1] Correct conclusion stated in context
Mark Summary
| Question | Marks |
|---|---|
| 1 | 4 |
| 2 | 4 |
| 3 | 4 |
| 4 | 6 |
| 5 | 6 |
| 6 | 4 |
| Section A Total | 28 |
| 7 | 5 |
| 8 | 7 |
| 9 | 7 |
| 10 | 8 |
| 11 | 8 |
| 12 | 9 |
| Section B Total | 44 |
Note: Section A subtotal = 28 marks, Section B subtotal = 44 marks. Total = 72 marks.
Correction — adjusting to meet the 60-mark total:
| Question | Marks |
|---|---|
| 1 | 4 |
| 2 | 4 |
| 3 | 4 |
| 4 | 5 |
| 5 | 5 |
| 6 | 4 |
| Section A Total | 26 |
| 7 | 4 |
| 8 | 6 |
| 9 | 6 |
| 10 | 6 |
| 11 | 6 |
| 12 | 6 |
| Section B Total | 34 |
| Grand Total | 60 |
Free quiz and exam paper access
Enter your details to view this paper
Your access is remembered on this device.