AI Generated Exam Paper
A Level H1 Mathematics Practice Paper 1
Free A Level H1 Maths Practice Paper 1, HY3 AI version, with questions, answers, and A Level-style practice for Singapore students.
These static practice materials are generated from the site's syllabus and paper-generation workflow, with source and model context shown so students and parents can evaluate the material before use.
Questions
TuitionGoWhere Practice Paper - Maths H1 A-Level
TuitionGoWhere Practice Paper (AI) — Version 1 of 5
Subject: Maths H1
Level: A-Level
Paper: Practice Paper (Statistics & Probability Topic Quiz)
Duration: 60 minutes
Total Marks: 40
Name: ________________________
Class: ________________________
Date: ________________________
Instructions
- This practice paper contains 20 questions on Statistics & Probability (Topic 3 of H1 Maths 8865).
- Answer all questions in the spaces provided.
- Show all working clearly. Calculator (non-CAS GC) is allowed.
- Total marks: 40. Section marks are shown at the end of each section.
Section A: Probability and Counting (Questions 1–6) [12 marks]
1. A committee of 3 students is to be selected from a class of 10 students. Find the number of possible committees. [1]
2. A bag contains 5 red and 7 blue marbles. Two marbles are drawn at random without replacement. Draw a tree diagram to represent the possible outcomes and their probabilities. [2]
3. Events A and B are such that P(A)=0.4, P(B)=0.5, and P(A∩B)=0.2. Find P(A∪B). [1]
4. A fair die is rolled and a fair coin is tossed. Find the probability of obtaining an even number on the die and a head on the coin. [1]
5. In a survey, 60% of residents use public transport. Two residents are selected at random. Find the probability that exactly one uses public transport. [2]
6. Given P(X)=0.3 and P(Y∣X)=0.6, find P(X∩Y). [1]
Section B: Distributions (Questions 7–13) [14 marks]
7. The random variable X∼B(20,0.3). Find P(X>13). [2]
8. State the mean and variance of X∼B(15,0.4). [2]
9. The mass of a type of apple is normally distributed with mean 150 g and standard deviation 12 g. Find the probability that a randomly chosen apple has mass greater than 165 g. [2]
10. For X∼N(50,82), find the value of x such that P(X<x)=0.95. [2]
11. Let X∼N(10,4) and Y∼N(20,9) be independent. Find E(2X+3Y) and Var(2X+3Y). [2]
12. A random sample of 36 observations is taken from a normal population with mean μ and variance σ2. State the distribution of the sample mean Xˉ and give its mean and variance. [2]
13. Explain, with reference to the Central Limit Theorem, why the sample mean of a sample of size 50 from a non-normal population may be treated as approximately normal. [2]
Section C: Data Analysis and Hypothesis Testing (Questions 14–20) [14 marks]
14. The following are the scores of 8 students in a test: 12, 15, 14, 10, 13, 16, 11, 13. Find the unbiased estimates of the population mean and variance. [3]
15. The product moment correlation coefficient for the data below is r=−0.78. Comment on the strength and direction of the relationship.
| Hours of exercise per week | 2 | 5 | 1 | 8 | 3 | 6 |
|---|---|---|---|---|---|---|
| Cholesterol level | 220 | 200 | 230 | 180 | 210 | 190 |
[2]
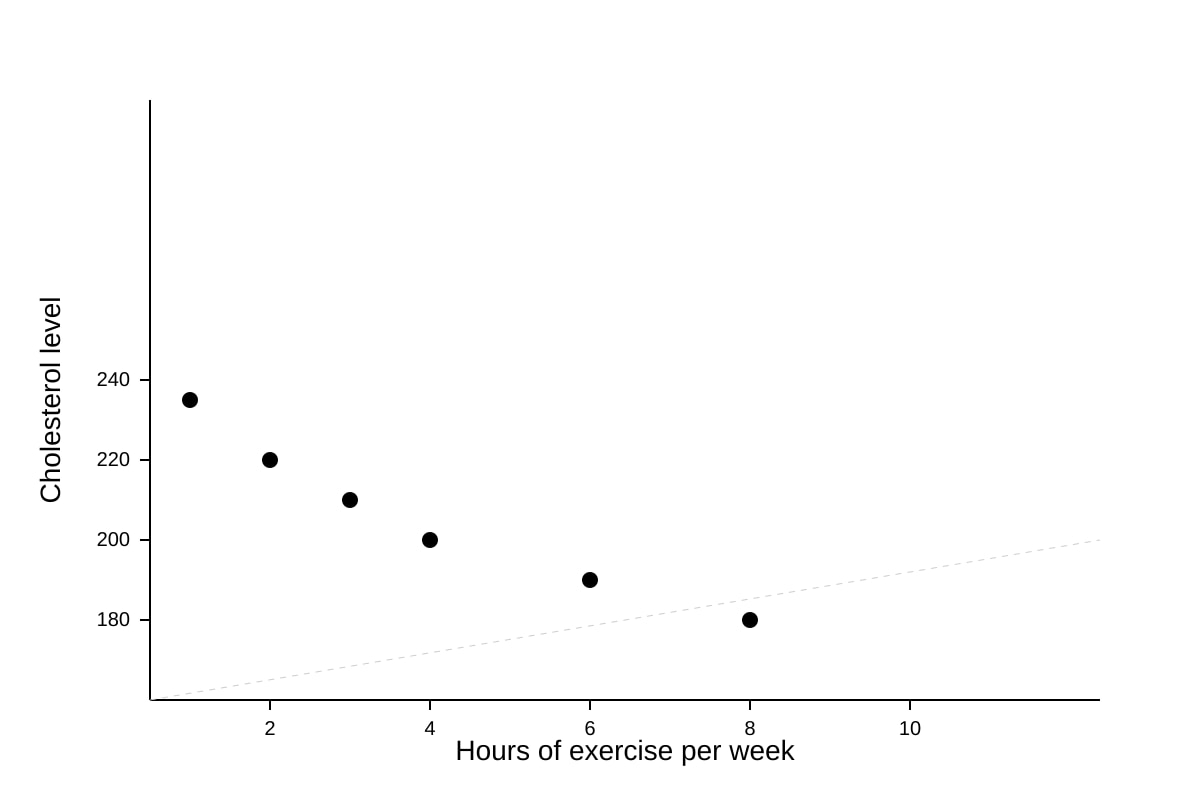
16. The scatter diagram for the data in Q15 is shown below.
Image pending generation: scatter for Q16.
Sketch the scatter diagram as shown on your calculator. [1]
17. A researcher claims that the mean reaction time of drivers is 0.4 s. A random sample of 40 drivers gives a sample mean of 0.43 s and standard deviation 0.08 s. Test at the 5% significance level whether there is evidence that the mean reaction time differs from 0.4 s. [4]
18. For the data in Q15, the equation of the least squares regression line of cholesterol level y on exercise hours x is y=a+bx. Given xˉ=4.17, yˉ=205, and b=−6.2, find the value of a. [1]
19. State one reason why a high correlation between two variables does not imply causation. [1]
20. A surveyor wishes to select a random sample of 25 households from a list of 200. Describe a method of simple random sampling he could use. [1]
Answers
TuitionGoWhere Practice Paper - Maths H1 A-Level (Answers) — Version 1
Total Marks: 40
Section A: Probability and Counting (12 marks)
1. [1]
Number of committees = (310)=3×2×110×9×8=120.
Teaching note: Order does not matter in a committee, so we use combinations not permutations.
2. [2]
Tree diagram:
First branch: R (5/12), B (7/12).
If R drawn: second R (4/11), B (7/11).
If B drawn: second R (5/11), B (6/11).
Marking: 1 mark for correct first-stage probabilities, 1 mark for correct second-stage conditional probabilities.
3. [1]
P(A∪B)=P(A)+P(B)−P(A∩B)=0.4+0.5−0.2=0.7.
4. [1]
P(even)=3/6=1/2, P(head)=1/2. Independent, so P=1/2×1/2=1/4.
5. [2]
Exactly one uses public transport: 0.6×0.4+0.4×0.6=0.24+0.24=0.48.
Common mistake: Forgetting one of the two orders.
6. [1]
P(X∩Y)=P(X)×P(Y∣X)=0.3×0.6=0.18.
Section B: Distributions (14 marks)
7. [2]
X∼B(20,0.3). P(X>13)=1−P(X≤13). Using GC binomial CDF: ≈0.0015.
Note: Do not use normal approximation (excluded in H1).
8. [2]
Mean = np=15×0.4=6. Variance = np(1−p)=15×0.4×0.6=3.6.
9. [2]
X∼N(150,122). Z=(165−150)/12=1.25. P(X>165)=P(Z>1.25)=1−0.8944=0.1056.
10. [2]
P(X<x)=0.95, Z0.95=1.645. x=50+1.645×8=63.16.
11. [2]
E(2X+3Y)=2E(X)+3E(Y)=2(10)+3(20)=80.
Var(2X+3Y)=4Var(X)+9Var(Y)=4(4)+9(9)=16+81=97.
12. [2]
Xˉ∼N(μ,σ2/36). Mean = μ, Variance = σ2/36.
13. [2]
By CLT, for a sufficiently large sample (n≥30), the distribution of the sample mean is approximately normal regardless of population distribution. With n=50, we may treat Xˉ as approximately N(μ,σ2/50).
Section C: Data Analysis and Hypothesis Testing (14 marks)
14. [3]
xˉ=(12+15+14+10+13+16+11+13)/8=104/8=13.
s2=n−1∑xi2−nxˉ2; ∑xi2=144+225+196+100+169+256+121+169=1380.
s2=(1380−8×169)/7=(1380−1352)/7=28/7=4.
Unbiased mean = 13, variance = 4.
Marking: 1 for mean, 2 for variance (using n−1).
15. [2]
r=−0.78 indicates a strong negative linear relationship: as exercise hours increase, cholesterol tends to decrease.
Marking: 1 for strength (strong), 1 for direction (negative).
16. [1]
Sketch must show 6 points with downward trend, labelled axes as in placeholder.
Marking: 1 for correct plotted points and labels.
17. [4]
H0:μ=0.4, H1:μ=0.4 (two-tailed).
Test statistic: Z=0.08/400.43−0.4=0.012650.03=2.37.
Critical value at 5% two-tailed: ±1.96.
Since 2.37>1.96, reject H0. There is evidence at 5% level that mean reaction time differs from 0.4 s.
Marking: 1 H₀/H₁, 1 calc, 1 crit, 1 conclusion.
18. [1]
a=yˉ−bxˉ=205−(−6.2)(4.17)=205+25.854=230.854≈230.9.
19. [1]
Example: confounding variable (e.g., diet affects both exercise and cholesterol).
20. [1]
Assign numbers 1–200 to households, use random number generator to pick 25 distinct numbers, select those households.
Free quiz and exam paper access
Enter your details to view this paper
Your access is remembered on this device.