From Real Exams Exam Paper
A Level H1 Mathematics Practice Paper 3
Free A Level H1 Maths Practice Paper 3, HY3 Exam version, with questions, answers, and A Level-style practice for Singapore students.
These static practice materials are generated from the site's syllabus and paper-generation workflow, with source and model context shown so students and parents can evaluate the material before use.
Questions
TuitionGoWhere Practice Paper - Maths H1 A-Level (Version 3)
TuitionGoWhere Exam Practice (AI)
Subject: Maths H1
Level: A-Level
Paper: Practice Paper (Statistics & Probability Topic Quiz)
Version: 3 of 5
Duration: 80 minutes
Total Marks: 60
Name: ___________________________
Class: ___________________________
Date: ___________________________
Instructions
- Answer all 20 questions.
- Show all working clearly.
- Use a graphing calculator where appropriate.
- Write your answers in the spaces provided.
Section A: Foundations of Probability and Counting (Questions 1–5, Total 12 marks)
1. [2 marks] A committee of 4 students is to be formed from a class of 9 boys and 6 girls. Find the number of ways to form the committee if it must contain exactly 2 boys and 2 girls.
2. [2 marks] Events A and B are such that P(A)=0.45, P(B)=0.30, and P(A∩B)=0.12. Find P(A∪B).
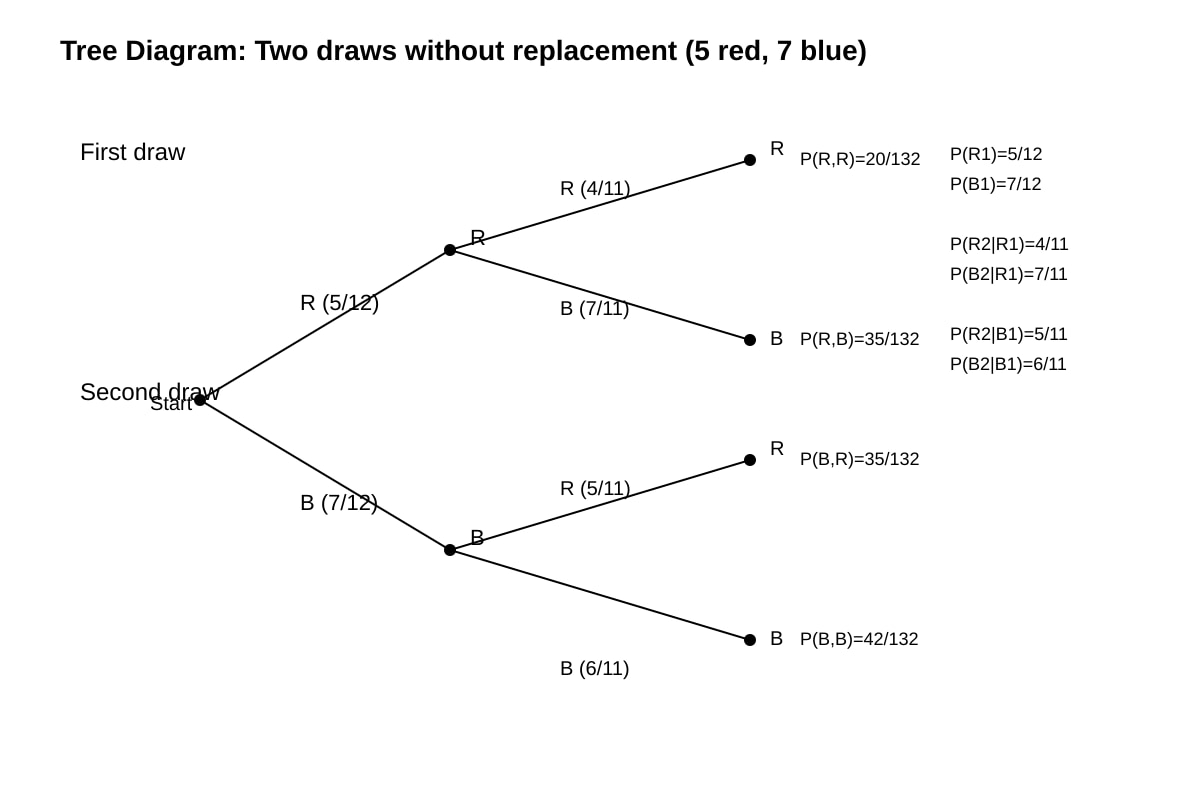
3. [3 marks] A bag contains 5 red and 7 blue marbles. Two marbles are drawn at random without replacement. Draw a tree diagram to represent the possible outcomes and their probabilities.
Image pending generation: diagram for Q3.
4. [2 marks] Given that P(A∣B)=0.4 and P(B)=0.25, find P(A∩B).
5. [3 marks] In a survey, 60% of residents use public transport. Of those who use public transport, 25% are late at least once a week. Of those who do not, only 10% are late. Given that a randomly chosen resident is late at least once a week, find the probability that they use public transport.
Section B: Distributions and Sampling (Questions 6–12, Total 22 marks)
6. [2 marks] State the conditions under which a binomial distribution B(n,p) is a suitable probability model.
7. [3 marks] The number of defective components in a batch of 20 is modelled by X∼B(20,0.08). Find the probability that more than 3 components are defective.
8. [3 marks] A random sample of 12 households has the following weekly electricity usage (in kWh):
142, 155, 138, 160, 149, 151, 144, 157, 146, 153, 140, 148.
Find the unbiased estimates of the population mean and variance.
9. [3 marks] The mass of a apple is normally distributed with mean 120 g and standard deviation 8 g. Find P(X<110).
10. [3 marks] Let X∼N(50,42) and Y∼N(30,32) be independent. Find E(2X−3Y+5) and Var(2X−3Y+5).
11. [4 marks] A population has mean μ=80 and variance σ2=64. A simple random sample of size n=36 is taken. State the distribution of the sample mean Xˉ and find P(Xˉ>82).
12. [4 marks] Explain how the Central Limit Theorem applies when a sample of size 50 is taken from a non-normal population with unknown mean and variance. What distribution does the sample mean approximately follow?
Section C: Correlation, Regression and Interpretation (Questions 13–20, Total 26 marks)
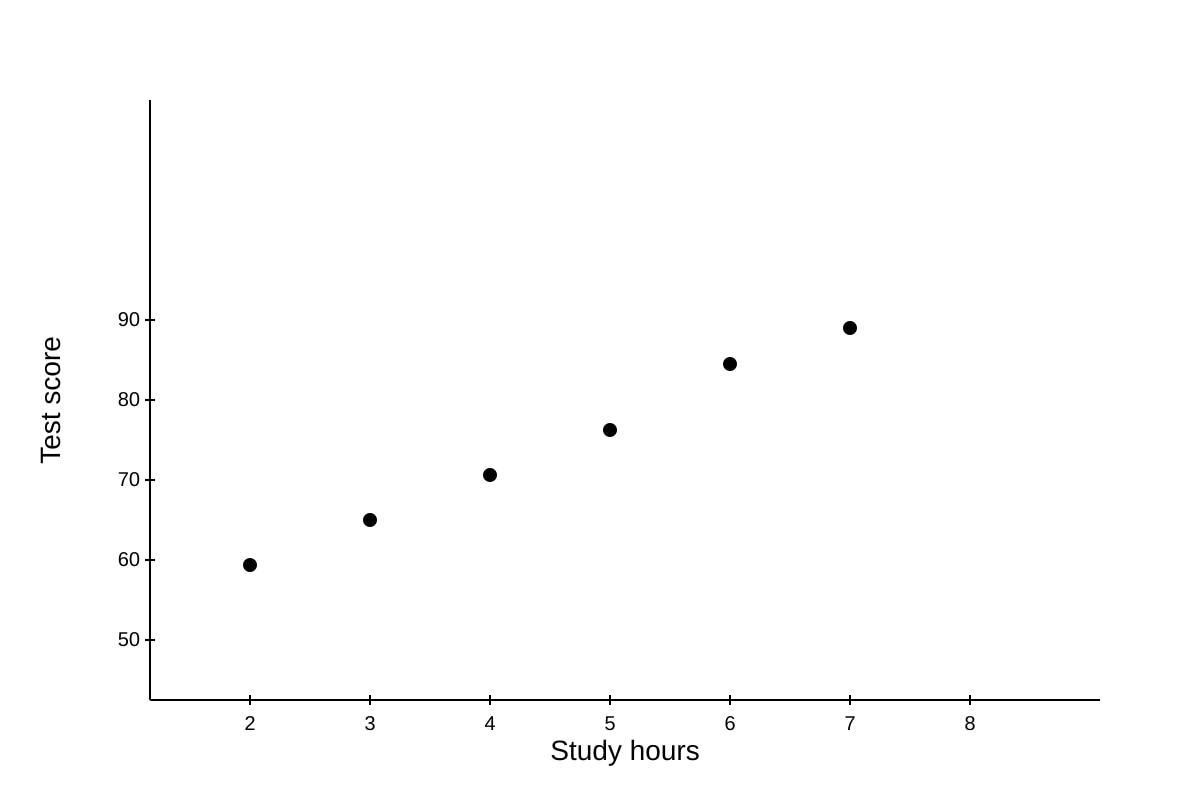
13. [2 marks] The following data shows study hours (x) and test score (y) for 6 students:
| x | 2 | 3 | 4 | 5 | 6 | 7 |
|---|---|---|---|---|---|---|
| y | 55 | 60 | 65 | 70 | 78 | 82 |
Give a sketch of the scatter diagram for the data, as shown on your calculator.
Image pending generation: graph for Q13.
14. [2 marks] For the data in Q13, the product moment correlation coefficient is r=0.98. Comment on this value in context.
15. [3 marks] For the data in Q13, find the equation of the least squares regression line of y on x in the form y=mx+c. (Given: ∑x=27, ∑y=410, ∑x2=139, ∑xy=1989.)
16. [2 marks] Using the regression line from Q15, estimate the test score for a student who studies 8 hours.
17. [3 marks] A researcher collects data on temperature (°C) and ice cream sales ().Sheobtainsr = -0.85$. Explain whether temperature is a good predictor of ice cream sales.
18. [4 marks] The table below shows the number of customers and daily revenue for a shop over 5 days.
| Customers (x) | 20 | 25 | 30 | 35 | 40 |
|---|---|---|---|---|---|
| Revenue y ($) | 400 | 520 | 610 | 700 | 820 |
Find the regression line of y on x in the form y=ax+b. (Given ∑x=150, ∑y=3050, ∑x2=4750, ∑xy=96500.)
19. [4 marks] A sample of 40 students has mean height 165 cm and unbiased variance 36 cm². Find unbiased estimates of the population mean and variance, and explain why the sample variance uses n−1 in the denominator.
20. [6 marks] A fitness tracker company claims that users walk a mean of 8000 steps daily. A random sample of 35 users gives ∑x=273000, ∑x2=2.15×10⁹. Test, at 5% significance, whether the mean daily steps differ from 8000. State hypotheses, compute test statistic, find critical value, and conclude.
Answers
TuitionGoWhere Practice Paper - Maths H1 A-Level (Version 3) — Answer Key
Subject: Maths H1
Level: A-Level
Paper: Practice Paper (Statistics & Probability Topic Quiz)
Version: 3 of 5
Total Marks: 60
Section A: Foundations of Probability and Counting
Q1 [2 marks]
Choose 2 boys from 9: 9C2=36.
Choose 2 girls from 6: 6C2=15.
Total ways = 36×15=540.
Teaching note: Use combinations because order does not matter. Mark: 1 for each correct combination product, 2 for final answer.
Q2 [2 marks]
P(A∪B)=P(A)+P(B)−P(A∩B)=0.45+0.30−0.12=0.63.
Teaching note: Addition law prevents double-counting intersection. Mark: 1 for formula, 1 for answer.
Q3 [3 marks]
Tree: Stage 1: R (5/12), B (7/12). Stage 2 after R: R (4/11), B (7/11); after B: R (5/11), B (6/11).
Joint probabilities: RR = 20/132, RB = 35/132, BR = 35/132, BB = 42/132.
Teaching note: Without replacement reduces denominator by 1. Mark: 1 for structure, 1 for correct probabilities, 1 for completeness.
Q4 [2 marks]
P(A∩B)=P(A∣B)P(B)=0.4×0.25=0.10.
Teaching note: Conditional probability rearranged. Mark: 1 for formula, 1 for answer.
Q5 [3 marks]
Let U = uses public transport, L = late.
P(U)=0.6,P(L∣U)=0.25,P(L∣U′)=0.10.
P(L)=0.6(0.25)+0.4(0.10)=0.15+0.04=0.19.
P(U∣L)=0.190.6×0.25=0.190.15≈0.789.
Teaching note: Bayes’ theorem via tree. Mark: 1 for total prob, 1 for Bayes, 1 for answer.
Section B: Distributions and Sampling
Q6 [2 marks]
Fixed number of independent trials; each trial has 2 outcomes (success/failure); constant probability p.
Teaching note: Core binomial conditions. Mark: 2 for all three stated.
Q7 [3 marks]
X∼B(20,0.08). P(X>3)=1−P(X≤3).
Using GC: P(X≤3)≈0.953 (or compute). So P(X>3)≈0.047.
Teaching note: "More than 3" means 4 or more. Mark: 1 for setup, 2 for answer.
Q8 [3 marks]
n=12, ∑x=1783, xˉ=1783/12≈148.58 kWh.
∑x2=266,267; s2=11266267−17832/12≈38.08 kWh².
Teaching note: Unbiased variance uses n−1. Mark: 1 mean, 2 variance.
Q9 [3 marks]
Z=(110−120)/8=−1.25. P(Z<−1.25)=0.1056.
Teaching note: Standardise then use N(0,1) table. Mark: 1 z, 2 prob.
Q10 [3 marks]
E(2X−3Y+5)=2(50)−3(30)+5=100−90+5=15.
Var=22(42)+32(32)=64+81=145.
Teaching note: Constants don't affect variance. Mark: 1 E, 2 Var.
Q11 [4 marks]
Xˉ∼N(80,64/36)=N(80,(8/6)2).
P(Xˉ>82)=P(Z>(82−80)/(8/6))=P(Z>1.5)=0.0668.
Teaching note: CLT not needed; population normal. Mark: 2 dist, 2 prob.
Q12 [4 marks]
CLT: for n≥30, Xˉ approx N(μ,σ2/n) regardless of population shape. Here n=50, so approx normal with mean μ, variance σ²/50.
Teaching note: Key threshold n≥30. Mark: 2 statement, 2 distribution.
Section C: Correlation, Regression and Interpretation
Q13 [2 marks]
Scatter shows upward linear trend; axes labelled; 6 points plotted as per placeholder.
Teaching note: Visual confirms positive relation. Mark: 2 for labelled sketch.
Q14 [2 marks]
r=0.98 indicates very strong positive linear correlation between study hours and score.
Teaching note: Close to 1 = strong positive. Mark: 2 for context comment.
Q15 [3 marks]
m=139−272/61989−27×410/6=139−121.51989−1845=17.5144≈8.23.
c=410/6−8.23×27/6≈68.33−37.04=31.29.
Line: y=8.23x+31.29.
Teaching note: Least squares formula. Mark: 2 calc, 1 equation.
Q16 [2 marks]
y=8.23(8)+31.29=65.84+31.29=97.13.
Teaching note: Substitute x=8. Mark: 2 for answer.
Q17 [3 marks]
r=-0.85 strong negative correlation; as temp rises sales fall (unlikely). Possibly data error or reverse causation; not a good predictor without check.
Teaching note: Sign and magnitude. Mark: 1 r, 2 interpretation.
Q18 [4 marks]
a=4750−1502/596500−150×3050/5=4750−450096500−91500=500/250=2.0.
b=3050/5−2.0×150/5=610−60=550.
Line: y=2x+550.
Teaching note: Same regression formula. Mark: 3 calc, 1 eq.
Q19 [4 marks]
Estimate mean = 165 cm; variance est = 36 cm² (already unbiased). n−1 used to make estimator unbiased (expected value = σ²).
Teaching note: Explain degrees of freedom. Mark: 2 values, 2 reason.
Q20 [6 marks]
H0:μ=8000, H1:μ=8000.
xˉ=273000/35=7800.
s2=342.15×10⁹−2730002/35≈411,176; s≈641.2.
Test stat t=641.2/357800−8000≈−1.84.
Critical t (34 df, 5% 2-tail) ≈ ±2.03.
Since -1.84 > -2.03, do not reject H0. Insufficient evidence mean differs.
Teaching note: 1-tail vs 2-tail; use t because σ unknown. Mark: 1 H, 2 calc, 1 crit, 2 concl.
Free quiz and exam paper access
Enter your details to view this paper
Your access is remembered on this device.