From Real Exams Exam Paper
A Level H1 Mathematics Practice Paper 2
Free A Level H1 Maths Practice Paper 2, HY3 Exam version, with questions, answers, and A Level-style practice for Singapore students.
These static practice materials are generated from the site's syllabus and paper-generation workflow, with source and model context shown so students and parents can evaluate the material before use.
Questions
TuitionGoWhere Exam Practice (AI) — Maths H1 A-Level Practice Paper
School: TuitionGoWhere Exam Practice (AI)
Subject: Maths H1
Level: A-Level
Paper: Practice Paper (Version 2 of 5)
Duration: 75 minutes
Total Marks: 60
Name: ___________________________
Class: ___________________________
Date: ___________________________
Instructions:
- Answer all questions.
- Show all working clearly.
- Use a graphing calculator where appropriate.
- Write your answers in the spaces provided.
Section A: Probability (20 marks)
1. A bag contains 5 red balls and 3 green balls. Two balls are drawn at random without replacement. Draw a tree diagram to represent the possible outcomes and their probabilities. [3]
2. In a survey, 60% of students use a laptop for online learning. A random sample of 8 students is selected. Find the probability that exactly 5 of them use a laptop for online learning. [2]
3. Events A and B are such that P(A)=0.4, P(B)=0.5, and P(A∩B)=0.2. Find P(A∪B) and P(A∣B). [3]
4. A factory produces light bulbs. The probability that a bulb is defective is 0.03. In a box of 20 bulbs, find the probability that more than 2 are defective. [3]
5. A club has 10 members: 4 men and 6 women. A committee of 3 is chosen at random. Find the probability that the committee has exactly 2 women. [3]
6. Describe a simple random sampling method to select 15 households from a list of 120 households in a neighbourhood. [3]
7. Given that P(X)=0.35 and P(Y∣X)=0.6, and P(X∩Y)=0.21, state whether X and Y are independent. Justify your answer. [3]
Section B: Distributions and Sampling (20 marks)
8. The masses (in kg) of 10 randomly selected bags of rice are:
5.1, 4.9, 5.0, 5.2, 4.8, 5.3, 4.7, 5.0, 5.1, 4.9.
Find the unbiased estimates of the population mean and variance. [3]
9. The random variable X∼B(12,0.25). Find E(X) and Var(X). [2]
10. The random variable Y∼N(50,82). Find P(Y<46). [2]
11. A normal distribution has mean μ and standard deviation σ. Given that P(X<30)=0.1587 and P(X<40)=0.5, find μ and σ. [4]
12. The weights of apples are normally distributed with mean 120 g and standard deviation 15 g. A sample of 36 apples is taken. State the distribution of the sample mean and find P(Xˉ>124). [4]
13. Explain why the Central Limit Theorem allows us to treat the sample mean as approximately normal when n=50 even if the population is not normal. [3]
14. A random sample of 40 observations has ∑x=820 and ∑x2=17200. Find the unbiased estimates of the mean and variance. [2]
Section C: Correlation and Regression (20 marks)
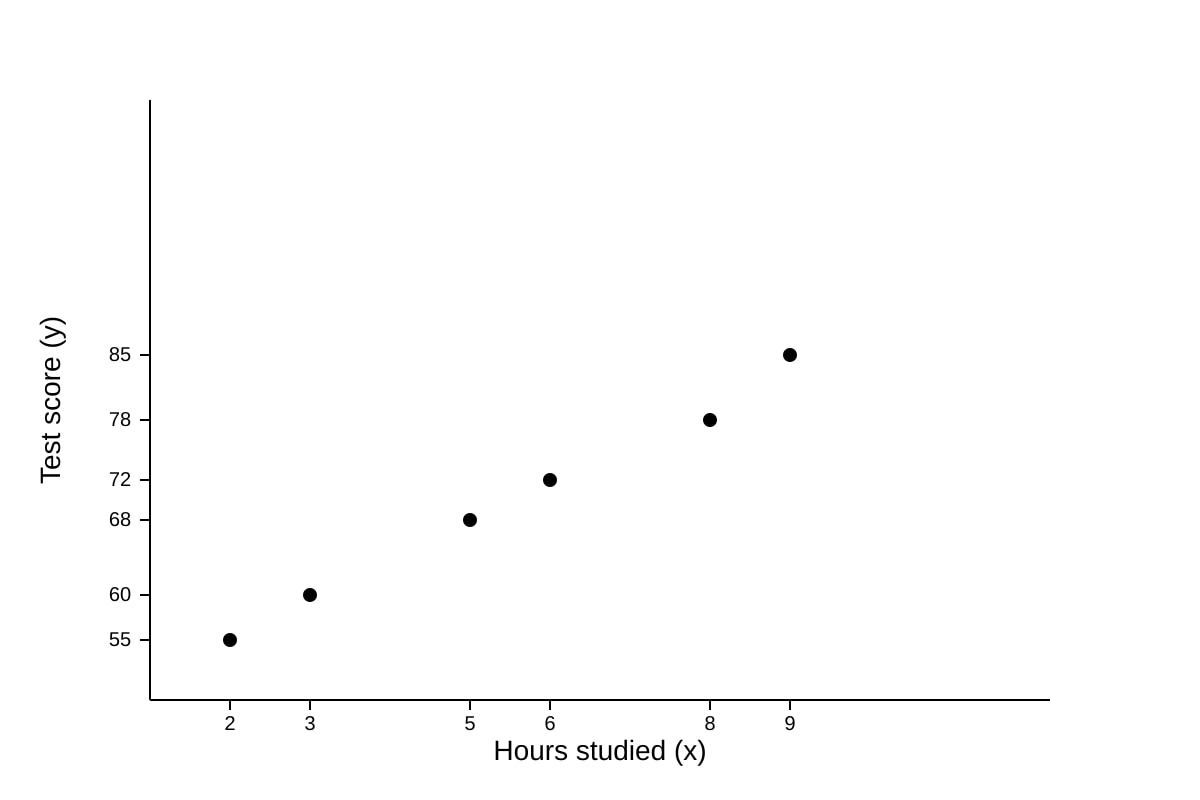
15. The table shows the number of hours studied (x) and test score (y) for 6 students.
| x | 2 | 3 | 5 | 6 | 8 | 9 |
|---|---|---|---|---|---|---|
| y | 55 | 60 | 68 | 72 | 78 | 85 |
Give a sketch of the scatter diagram for the data, as shown on your calculator. [2]
Image pending generation: scatter for Q15.
16. For the data in Q15, find the product moment correlation coefficient r and comment on its value. [3]
17. Find the equation of the least squares regression line of y on x for the data in Q15, writing your answer in the form y=ax+b. [3]
18. Using your regression line from Q17, estimate the test score for a student who studies 7 hours. Comment on the reliability of this estimate. [3]
19. A researcher finds r=−0.82 between daily screen time and sleep quality score for 30 adults. Interpret this result in context. [3]
20. The table below shows summarised data for 8 towns:
| Town | Population (thousands) x | Coffee shops y |
|---|---|---|
| A | 12 | 8 |
| B | 15 | 10 |
| C | 20 | 14 |
| D | 25 | 17 |
| E | 30 | 21 |
| F | 35 | 24 |
| G | 40 | 28 |
| H | 45 | 31 |
Find the equation of the regression line of y on x in the form y=mx+c, and use it to estimate the number of coffee shops in a town with population 50 thousand. [6]
END OF PAPER
Answers
TuitionGoWhere Exam Practice (AI) — Maths H1 A-Level Practice Paper (Version 2) Answer Key
Total Marks: 60
Section A: Probability
Q1 [3 marks] Tree diagram:
- Stage 1: R (5/8), G (3/8)
- Stage 2 after R: R (4/7), G (3/7)
- Stage 2 after G: R (5/7), G (2/7) Marking: 1 mark for first-stage branches, 1 mark for second-stage correct conditional probabilities, 1 mark for labelling. Teaching note: Without replacement means denominator decreases; multiply along branches for joint probabilities.
Q2 [2 marks] X∼B(8,0.6); P(X=5)=(58)(0.6)5(0.4)3=56×0.07776×0.064=0.279 (3 s.f.) Marking: 1 for identifying binomial, 1 for correct value.
Q3 [3 marks] P(A∪B)=0.4+0.5−0.2=0.7 [1] P(A∣B)=P(A∩B)/P(B)=0.2/0.5=0.4 [2] Teaching: Union formula avoids double-counting intersection.
Q4 [3 marks] X∼B(20,0.03); P(X>2)=1−P(X≤2)=1−[P(0)+P(1)+P(2)] =1−[0.5438+0.3364+0.0988]=1−0.979=0.021 (3 s.f.) Marking: 1 binomial setup, 1 use of complement, 1 final value.
Q5 [3 marks] Total committees = (310)=120 [1] Exactly 2 women: (26)(14)=15×4=60 [1] P=60/120=0.5 [1]
Q6 [3 marks] Assign numbers 1 to 120 to households. Use a random number generator to pick 15 distinct numbers. Select corresponding households. [3 for clear random procedure] Teaching: Must ensure each has equal chance; not convenience sampling.
Q7 [3 marks] P(Y∣X)=0.6, P(Y)=P(X∩Y)/P(X)=0.21/0.35=0.6 [1] Since P(Y∣X)=P(Y), X and Y are independent [2].
Section B: Distributions and Sampling
Q8 [3 marks] xˉ=(5.1+4.9+5.0+5.2+4.8+5.3+4.7+5.0+5.1+4.9)/10=50.0/10=5.00 kg [1] s2=91[(0.1)2+(−0.1)2+02+(0.2)2+(−0.2)2+(0.3)2+(−0.3)2+02+(0.1)2+(−0.1)2]=91(0.30)=0.0333 kg² [2]
Q9 [2 marks] E(X)=np=12×0.25=3 [1] Var(X)=np(1−p)=12×0.25×0.75=2.25 [1]
Q10 [2 marks] z=(46−50)/8=−0.5; P(Y<46)=P(Z<−0.5)=0.3085 [2]
Q11 [4 marks] P(X<40)=0.5⇒μ=40 [2] P(X<30)=0.1587⇒z=−1, so (30−40)/σ=−1⇒σ=10 [2]
Q12 [4 marks] Xˉ∼N(120,152/36)=N(120,6.25) [2] P(Xˉ>124)=P(Z>(124−120)/2.5)=P(Z>1.6)=0.0548 [2]
Q13 [3 marks] CLT states for large n (≥30), sample mean approx normal regardless of population distribution [2]; n=50 suffices [1].
Q14 [2 marks] xˉ=820/40=20.5 [1] s2=391(17200−8202/40)=391(17200−16810)=390/39=10 [1]
Section C: Correlation and Regression
Q15 [2 marks] Scatter diagram: x-axis 0–10, y-axis 50–90, 6 points showing upward trend. [2]
Q16 [3 marks] Using GC: r=0.989 (3 s.f.) [2] Strong positive linear correlation between hours studied and score [1].
Q17 [3 marks] GC gives y=3.76x+48.2 (3 s.f.) [3]
Q18 [3 marks] x=7⇒y=3.76(7)+48.2=74.5 [2] Estimate reliable since x=7 within data range and r high [1].
Q19 [3 marks] Strong negative association: more screen time linked to lower sleep quality [2]; n=30 supports moderate sample [1].
Q20 [6 marks] ∑x=222, ∑y=153, ∑x2=7124, ∑xy=4908, n=8 xˉ=27.75, yˉ=19.125 b=7124−8(27.75)24908−8(27.75)(19.125)=950.5664.5=0.699 [3] a=19.125−0.699(27.75)=−0.27 [1] y=0.699x−0.27 [1] x=50⇒y=34.2 shops [1]
Free quiz and exam paper access
Enter your details to view this paper
Your access is remembered on this device.