AI Generated Quiz
A Level H2 Geography Resources Sustainability Quiz
Free A Level H2 Geography Resources Sustainability quiz, LongCat AI version, with questions, answers, and A Level-style practice for Singapore students.
These static practice materials are generated from the site's syllabus and paper-generation workflow, with source and model context shown so students and parents can evaluate the material before use.
Questions
A-Level Geography H2 Quiz - Resources Sustainability
Name: ___________________________
Class: ___________________________
Date: ___________________________
Score: ________ / 60
Duration: 90 minutes
Total Marks: 60
Instructions
- Answer all questions in the spaces provided.
- Read each question carefully and use appropriate geographical terminology.
- Where data or source materials are provided, refer to them explicitly in your answers.
- For questions requiring evaluation or discussion, present a balanced argument with supporting evidence.
- Quality of written communication will be assessed in extended response questions.
Section A: Data-Based Questions (Questions 1–8)
Answer all questions in this section. Questions are based on the resources provided.
Resource 1: Global Water Stress Index for Selected Countries, 2023
| Country | Water Stress Level (%) | Annual Renewable Freshwater per capita (m³) | Main Water Use Sector | Water Scarcity Category |
|---|---|---|---|---|
| Singapore | 78 | 110 | Industrial | High stress |
| Netherlands | 25 | 5,400 | Agricultural | Low stress |
| Egypt | 95 | 20 | Agricultural | Extremely high stress |
| Brazil | 12 | 27,500 | Agricultural | Low stress |
| India | 65 | 1,100 | Agricultural | High stress |
| Japan | 40 | 3,400 | Industrial | Medium stress |
| Australia | 35 | 20,500 | Agricultural | Medium stress |
1. Using Resource 1, compare the water stress levels of Egypt and Brazil. [4]
2. Suggest two reasons why Singapore has a high water stress level despite having a highly developed economy. [4]
(a) ___________________________________________________________________________
(b) ___________________________________________________________________________
3. Explain how agricultural water use can contribute to increasing water stress in a country such as India. [5]
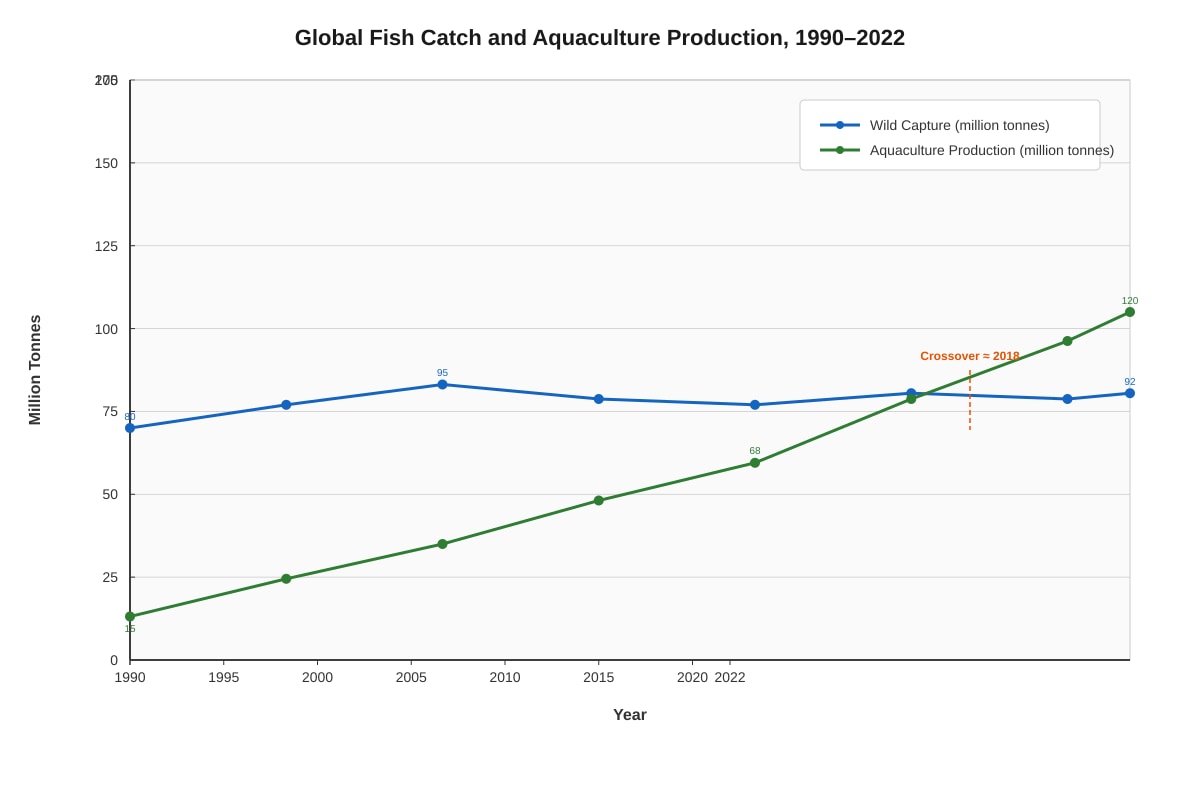
Resource 2: Graph showing Global Fish Catch and Aquaculture Production, 1990–2022
Generated graph for Q4.
4. Describe the trends shown in Resource 2 for both wild capture fisheries and aquaculture production between 1990 and 2022. [5]
5. Using Resource 2 and your own knowledge, assess the extent to which aquaculture can sustainably meet the world's growing demand for fish. [6]
Resource 3: Extract on Food Security in Sub-Saharan Africa
Sub-Saharan Africa faces significant food security challenges. In 2023, approximately 280 million people were undernourished, representing roughly 20% of the region's population. Climate variability, including prolonged droughts and unpredictable rainfall, has reduced crop yields by up to 30% in some areas. Rapid population growth, at 2.7% per year, continues to outpace agricultural productivity gains. Soil degradation affects over 65% of arable land due to overgrazing, deforestation, and unsustainable farming practices. International aid programmes have introduced drought-resistant crop varieties, but adoption rates remain below 15% due to limited access to seeds, credit, and extension services. Meanwhile, urbanisation is drawing young people away from rural farming communities, further reducing agricultural labour availability.
6. Using Resource 3, identify three factors that contribute to food insecurity in Sub-Saharan Africa. [3]
(a) ___________________________________________________________________________
(b) ___________________________________________________________________________
(c) ___________________________________________________________________________
7. Using Resource 3, explain how both environmental and human factors interact to worsen food insecurity in Sub-Saharan Africa. [6]
8. Suggest two strategies that could improve food security in Sub-Saharan Africa and explain how each would address the challenges identified in Resource 3. [4]
Strategy 1: ____________________________________________________________________
Strategy 2: ____________________________________________________________________
Section B: Structured and Short-Answer Questions (Questions 9–14)
Answer all questions in this section.
9. Define the term sustainable development. [2]
10. Explain the difference between renewable and non-renewable energy resources, giving one example of each. [3]
Renewable: ______________________________________________________________________
Non-renewable: __________________________________________________________________
11. Describe two ways in which the concept of the water-food-energy nexus is relevant to resource sustainability. [4]
(a) ___________________________________________________________________________
(b) ___________________________________________________________________________
12. Explain how the tragedy of the commons relates to the overexploitation of marine fisheries. [4]
13. With reference to a named example, explain how a government policy has attempted to manage a resource more sustainably. [5]
Named example: __________________________________________________________________
14. Suggest why some countries find it difficult to transition from fossil fuel dependence to renewable energy sources. [4]
Section C: Essay Questions (Questions 15–20)
Answer all questions in this section. These questions require extended responses with well-structured arguments, relevant examples, and evaluative conclusions.
15. "Economic development and resource sustainability are incompatible goals." How far do you agree with this statement? Use examples to support your answer. [8]
16. Evaluate the effectiveness of international agreements in addressing global resource depletion. [8]
17. "Technological innovation alone cannot achieve resource sustainability." Discuss. [8]
18. Assess the role of population growth in threatening global food and water security. [8]
19. To what extent can urban areas become models of resource sustainability? Refer to specific examples in your answer. [8]
20. "The greatest barrier to achieving resource sustainability is political will, not technology or resources." Evaluate this statement. [8]
End of Quiz
Marking Summary:
| Section | Questions | Marks |
|---|---|---|
| A: Data-Based | 1–8 | 37 |
| B: Structured & Short Answer | 9–14 | 23 |
| C: Essay | 15–20 | 48 |
| Total | 20 questions | 60 |
Note: Section C essay questions are each worth 8 marks. Total marks for the quiz = 60.
Answers
A-Level Geography H2 Quiz - Resources Sustainability
Answer Key and Marking Scheme
Question 1 [4 marks]
Compare the water stress levels of Egypt and Brazil.
Model Answer:
Egypt has an extremely high water stress level of 95%, meaning that 95% of its available freshwater is withdrawn for human use, leaving very little buffer. In contrast, Brazil has a very low water stress level of only 12%, indicating that the vast majority of its freshwater remains unused. Egypt's annual renewable freshwater per capita is only 20 m³, which is far below the water scarcity threshold of 1,000 m³ per capita, whereas Brazil has 27,500 m³ per capita — an enormously higher figure. This means Egypt faces extreme physical water scarcity while Brazil has abundant freshwater resources relative to its population. Both countries' main water use sector is agriculture, but the pressure on the resource differs dramatically.
Marking Scheme:
- 2 marks: Clear comparative language used (e.g., "higher/lower than," "in contrast") with reference to specific data from Resource 1.
- 2 marks: Valid comparison across at least two dimensions (water stress % and/or per capita freshwater and/or scarcity category).
- Common mistake: Simply restating the raw numbers without making comparisons. Students must use comparative language to earn full marks.
Question 2 [4 marks]
Suggest two reasons why Singapore has a high water stress level despite having a highly developed economy.
Model Answer:
(a) Singapore has a very small land area (approximately 730 km²) with limited natural freshwater catchment and no significant natural aquifers or rivers. Despite its wealth, the physical geography constrains the total volume of renewable freshwater available, resulting in only 110 m³ per capita annually — one of the lowest in the world.
(b) Singapore has a high population density (approximately 8,000 people per km²) and significant industrial water demand from its petrochemical, semiconductor, and pharmaceutical sectors. The combination of a large population, intensive industrial activity, and limited land for water catchment means that a very high proportion of available water is withdrawn, driving up the stress level.
Marking Scheme:
- 2 marks per reason (1 mark for identifying a valid reason, 1 mark for developing/explaining it).
- Reasons must go beyond simply restating the data. Acceptable reasons include: limited land area, high population density, high industrial demand, lack of natural water sources, dependence on imported water, or limited catchment area.
Question 3 [5 marks]
Explain how agricultural water use can contribute to increasing water stress in a country such as India.
Model Answer:
Agriculture is the largest consumer of freshwater in India, accounting for approximately 80–90% of total water withdrawals. India relies heavily on irrigation for crops such as rice, wheat, and sugarcane, which are water-intensive. Much of this irrigation is inefficient — flood irrigation is still widely used, leading to significant water loss through evaporation and runoff. Groundwater is extensively pumped from aquifers, particularly in Punjab and Haryana, at rates far exceeding natural recharge. This has caused water tables to drop by several metres per year in some regions. As the population grows, demand for food increases, requiring more irrigated land and further increasing water withdrawals. The combination of rising demand, inefficient use, and unsustainable groundwater extraction means that agricultural water use is a primary driver of India's high water stress level of 65%.
Marking Scheme:
- 1 mark: Identifies agriculture as a major water user in India.
- 1 mark: Explains inefficient irrigation methods (e.g., flood irrigation, evaporation losses).
- 1 mark: Explains groundwater over-extraction and aquifer depletion.
- 1 mark: Links population growth / food demand to increasing agricultural water demand.
- 1 mark: Overall coherence and use of geographical terminology (e.g., "aquifer," "recharge," "water table").
Question 4 [5 marks]
Describe the trends shown in Resource 2 for both wild capture fisheries and aquaculture production between 1990 and 2022.
Model Answer:
Wild capture fisheries production increased from approximately 80 million tonnes in 1990 to a peak of around 95 million tonnes near 2000. After 2000, wild capture levelled off and fluctuated between approximately 88 and 95 million tonnes, showing no significant overall growth in the 21st century. This plateau suggests that wild fish stocks have reached or exceeded their maximum sustainable yield.
Aquaculture production, in contrast, showed a strong and sustained upward trend throughout the entire period. It grew from approximately 15 million tonnes in 1990 to about 40 million tonnes by 2000, then accelerated further to reach approximately 120 million tonnes by 2022. The two lines cross at around 2018, meaning aquaculture overtook wild capture as the primary source of fish for human consumption globally.
Marking Scheme:
- 1 mark: Describes wild capture trend (rise to ~2000, then plateau/fluctuation).
- 1 mark: Describes aquaculture trend (sustained increase, accelerating after 2000).
- 1 mark: Provides specific data points (approximate figures from the graph).
- 1 mark: Identifies the crossover point (~2018) or notes that aquaculture overtook wild capture.
- 1 mark: Overall quality of description — uses appropriate terminology (e.g., "plateau," "accelerated," "overtook").
Image placeholder note: The graph must show two clearly labelled trend lines (wild capture and aquaculture), with the crossover point visible around 2018. Y-axis labelled "Million Tonnes" (0–200), X-axis labelled "Year" (1990–2022). Data points as specified in the <image_placeholder> tag.
Question 5 [6 marks]
Using Resource 2 and your own knowledge, assess the extent to which aquaculture can sustainably meet the world's growing demand for fish.
Model Answer:
Aquaculture has grown rapidly and now exceeds wild capture, suggesting it is already playing a critical role in meeting global fish demand. However, whether it can do so sustainably is debatable.
Arguments that aquaculture CAN sustainably meet demand:
- Technological advances such as recirculating aquaculture systems (RAS) reduce water use and pollution by filtering and reusing water in closed tanks.
- Integrated multi-trophic aquaculture (IMTA) combines species (e.g., fish, shellfish, seaweed) so that waste from one species becomes food for another, mimicking natural ecosystems.
- Selective breeding and improved feed formulations have increased feed conversion ratios, reducing the amount of wild fish needed to produce farmed fish.
Arguments that aquaculture CANNOT sustainably meet demand:
- Many aquaculture operations, particularly in Southeast Asia, have caused mangrove destruction, reducing coastal ecosystem services and biodiversity.
- Fish farms can pollute surrounding waters with excess nutrients, antibiotics, and chemicals, leading to eutrophication and disease.
- Some aquaculture (e.g., salmon farming) still depends on wild-caught fish for feed, transferring pressure to wild stocks rather than relieving it.
- Disease outbreaks (e.g., white spot syndrome in shrimp) can cause massive losses and require chemical treatments that harm the environment.
Conclusion: Aquaculture has significant potential to meet growing demand sustainably, but only if best practices are widely adopted. Currently, many operations are not sustainable, and without stronger regulation and technological uptake, aquaculture could create new environmental problems even as it addresses food security.
Marking Scheme:
- 1 mark: Uses data from Resource 2 (growth trend, crossover point).
- 2 marks: Explains ways aquaculture CAN be sustainable (at least two valid points with explanation).
- 2 marks: Explains limitations/sustainability challenges of aquaculture (at least two valid points with explanation).
- 1 mark: Reaches a balanced, evaluative conclusion.
Question 6 [3 marks]
Using Resource 3, identify three factors that contribute to food insecurity in Sub-Saharan Africa.
Model Answer:
(a) Climate variability / prolonged droughts and unpredictable rainfall reducing crop yields by up to 30%. (b) Rapid population growth at 2.7% per year, outpacing agricultural productivity gains. (c) Soil degradation affecting over 65% of arable land due to overgrazing, deforestation, and unsustainable farming practices.
Marking Scheme:
- 1 mark per factor correctly identified from Resource 3.
- Answers must be drawn from the resource, not general knowledge.
Question 7 [6 marks]
Using Resource 3, explain how both environmental and human factors interact to worsen food insecurity in Sub-Saharan Africa.
Model Answer:
Environmental and human factors interact in a vicious cycle to worsen food insecurity in Sub-Saharan Africa.
Environmental factors: Climate variability, including prolonged droughts and unpredictable rainfall, directly reduces crop yields by up to 30%. Soil degradation affects over 65% of arable land, reducing the productivity of farmland. These environmental stresses mean that even existing agricultural land produces less food.
Human factors: Rapid population growth (2.7% per year) increases demand for food faster than agricultural output can grow. Deforestation and overgrazing — driven by the need for more farmland and fuel — worsen soil degradation, creating a feedback loop. Urbanisation draws young people away from rural farming, reducing the agricultural labour force precisely when more productive labour is needed.
Interaction: The interaction is cyclical. Population growth drives deforestation and overgrazing, which cause soil degradation, which reduces crop yields, which increases food insecurity, which can lead to further unsustainable land use as people exploit marginal lands to survive. Climate variability amplifies these pressures by making an already fragile system even more unpredictable. Low adoption rates of drought-resistant crops (below 15%) mean that farmers remain vulnerable to climate shocks, perpetuating the cycle.
Marking Scheme:
- 1 mark: Identifies at least one environmental factor from the resource.
- 1 mark: Identifies at least one human factor from the resource.
- 2 marks: Explains how environmental and human factors interact (feedback loop / cycle).
- 2 marks: Uses evidence from Resource 3 and demonstrates clear, coherent explanation with geographical terminology.
Question 8 [4 marks]
Suggest two strategies that could improve food security in Sub-Saharan Africa and explain how each would address the challenges identified in Resource 3.
Model Answer:
Strategy 1: Expand access to drought-resistant crop varieties through subsidised seed programmes and agricultural extension services. This would address the challenge of low adoption rates (below 15%) of drought-resistant crops. By providing seeds at low cost and training farmers in their use, crop yields could be maintained even during periods of drought and unpredictable rainfall. This directly tackles the climate variability challenge identified in Resource 3.
Strategy 2: Implement soil conservation programmes including terracing, agroforestry, and crop rotation. This would address the soil degradation affecting 65% of arable land. Terracing reduces erosion on slopes, agroforestry restores soil fertility through nitrogen-fixing trees, and crop rotation prevents nutrient depletion. By restoring soil health, agricultural productivity can increase, helping food production keep pace with population growth.
Marking Scheme:
- 1 mark per strategy (must be plausible and relevant).
- 1 mark per explanation (must clearly link the strategy to a specific challenge in Resource 3).
- Strategies that are vague or not linked to the resource receive a maximum of 1 mark each.
Question 9 [2 marks]
Define the term sustainable development.
Model Answer:
Sustainable development is development that meets the needs of the present without compromising the ability of future generations to meet their own needs (Brundtland Commission, 1987). It involves balancing economic growth, social equity, and environmental protection.
Marking Scheme:
- 2 marks: Clear, accurate definition referencing present and future needs, or the three pillars (economic, social, environmental).
- 1 mark: Partial definition (e.g., mentions only environmental protection without reference to future generations).
Question 10 [3 marks]
Explain the difference between renewable and non-renewable energy resources, giving one example of each.
Model Answer:
Renewable energy resources are those that can be naturally replenished over short timescales and are essentially inexhaustible. Example: solar energy (or wind, geothermal, tidal, biomass).
Non-renewable energy resources exist in finite quantities and are depleted faster than they are formed geologically. Once used, they cannot be replaced within human timescales. Example: coal (or oil, natural gas, uranium).
Marking Scheme:
- 1 mark: Correct definition of renewable energy.
- 1 mark: Correct definition of non-renewable energy.
- 1 mark: One correct example of each.
Question 11 [4 marks]
Describe two ways in which the concept of the water-food-energy nexus is relevant to resource sustainability.
Model Answer:
(a) Water is required for both food production (irrigation) and energy generation (hydropower cooling in thermal power plants). In many regions, these demands compete — for example, in California, agricultural irrigation and urban water supply compete with water needed for hydroelectric dams. Managing this trade-off is essential for sustainability because over-extraction for one purpose can undermine the other two.
(b) Energy is needed to pump, treat, and distribute water, and to produce fertilisers and power agricultural machinery. If energy becomes scarce or expensive, food production and water treatment become more difficult. For example, in parts of Sub-Saharan Africa, lack of energy infrastructure limits irrigation potential, constraining food production. Recognising these interconnections helps policymakers develop integrated strategies rather than managing each resource in isolation.
Marking Scheme:
- 2 marks per way (1 mark for identifying a valid interconnection, 1 mark for explaining its relevance to sustainability).
- Answers must demonstrate understanding of the nexus concept (interconnection between water, food, and energy).
Question 12 [4 marks]
Explain how the tragedy of the commons relates to the overexploitation of marine fisheries.
Model Answer:
The tragedy of the commons, described by Garrett Hardin (1968), occurs when individuals acting in their own self-interest deplete a shared resource, even though this is against the group's long-term interest. Marine fisheries are a classic example because the oceans are a shared, open-access resource with no single owner. Each fishing vessel or nation has an incentive to catch as many fish as possible to maximise short-term profit. However, when all actors do this collectively, fish stocks are harvested faster than they can reproduce, leading to stock collapse. The North Atlantic cod fishery collapse in the early 1990s is a well-known example. Without effective regulation (e.g., quotas, marine protected areas, or territorial use rights), individual rational behaviour leads to collective resource destruction.
Marking Scheme:
- 1 mark: Defines the tragedy of the commons.
- 1 mark: Explains why marine fisheries are a "commons" (open access, shared resource).
- 1 mark: Explains the incentive structure (individual vs. collective interest).
- 1 mark: Provides a specific example or consequence (e.g., cod collapse, stock depletion).
Question 13 [5 marks]
With reference to a named example, explain how a government policy has attempted to manage a resource more sustainably.
Model Answer:
Named example: Singapore's water management strategy (the "Four National Taps").
Singapore faces extreme water stress due to its small land area and limited natural freshwater. The government's Four National Taps strategy aims to diversify water sources to reduce dependence on any single source and enhance sustainability:
- Local catchment water: Singapore has built an extensive network of reservoirs and stormwater collection systems, capturing rainwater from two-thirds of its land area.
- Imported water: Singapore imports water from Johor, Malaysia, under agreements that expire in 2061, creating urgency to develop alternatives.
- NEWater (reclaimed water): Advanced membrane technology and ultraviolet disinfection treat used water to produce ultra-clean recycled water, meeting up to 40% of demand.
- Desalination: Desalination plants convert seawater to potable water, with a target of meeting 30% of demand by 2060.
This policy has reduced Singapore's vulnerability and is moving the country toward water self-sufficiency, demonstrating how integrated resource management can address sustainability challenges.
Marking Scheme:
- 1 mark: Named, specific example.
- 2 marks: Clear explanation of the policy/strategy.
- 2 marks: Explanation of how the policy promotes sustainability (diversification, reduced dependence, technological innovation, long-term planning).
- Accept other valid examples (e.g., Costa Rica's Payment for Ecosystem Services, EU Common Fisheries Policy, China's Grain for Green programme).
Question 14 [4 marks]
Suggest why some countries find it difficult to transition from fossil fuel dependence to renewable energy sources.
Model Answer:
Several barriers make the transition difficult:
-
Economic costs and infrastructure lock-in: Fossil fuel infrastructure (power plants, refineries, pipelines) represents massive sunk costs. Replacing this infrastructure requires enormous capital investment that many countries, especially developing ones, cannot easily afford. The existing energy system is designed around fossil fuels, and transitioning requires rebuilding grids, storage systems, and distribution networks.
-
Intermittency and storage challenges: Renewable sources like solar and wind are intermittent — they depend on weather conditions. Without affordable, large-scale energy storage (e.g., batteries), countries cannot guarantee a stable energy supply from renewables alone. This makes governments reluctant to phase out reliable fossil fuel baseload power.
-
Political and social resistance: Fossil fuel industries employ millions of people and are politically powerful. Transitioning threatens jobs and regional economies (e.g., coal mining communities). Governments may fear unemployment and social unrest, slowing the pace of change.
-
Energy security concerns: Some countries with abundant fossil fuel reserves (e.g., Saudi Arabia, Russia) have little economic incentive to transition and may actively resist global efforts to reduce fossil fuel use.
Marking Scheme:
- 1 mark per valid reason, with brief explanation (4 reasons × 1 mark each).
- Answers must go beyond simple statements (e.g., "it is expensive" without explanation earns only partial credit).
Question 15 [8 marks]
"Economic development and resource sustainability are incompatible goals." How far do you agree with this statement? Use examples to support your answer.
Model Answer:
Introduction: The relationship between economic development and resource sustainability is complex. While there are tensions between the two, they are not necessarily incompatible if development is pursued sustainably.
Arguments that they ARE incompatible:
- Historically, industrialisation has been driven by fossil fuels and resource extraction. China's rapid GDP growth (averaging ~10% annually from 2080–2015) came at the cost of severe air and water pollution, deforestation, and massive carbon emissions. This suggests that fast economic growth often degrades natural capital.
- The Environmental Kuznets Curve (EKC) hypothesis suggests that environmental degradation initially increases with income before eventually declining. For many resources (e.g., fisheries, forests), the damage done during early development may be irreversible.
- Developing countries often prioritise immediate poverty reduction over long-term sustainability, as seen in deforestation in the Amazon for cattle ranching and soy cultivation.
Arguments that they are NOT incompatible:
- The concept of decoupling shows that some countries have grown their GDP while reducing resource use and emissions. For example, the UK's GDP grew by 75% between 1990 and 2020 while greenhouse gas emissions fell by 43%, demonstrating relative (and in some periods absolute) decoupling.
- The green economy offers development pathways that are inherently sustainable. Costa Rica generates over 98% of its electricity from renewable sources while maintaining a growing economy and high human development index.
- Circular economy models (e.g., in the Netherlands and Japan) aim to eliminate waste and keep resources in use, showing that economic activity can continue without proportional resource depletion.
Conclusion: While there are real tensions, particularly in the early stages of development, economic development and resource sustainability are not fundamentally incompatible. The key lies in the type of development pursued. With appropriate policies, technology, and governance, countries can achieve both goals. However, without deliberate intervention, the default path of development tends to undermine sustainability.
Marking Scheme (8-mark essay):
- 2 marks: Clear introduction defining key terms and outlining the argument.
- 2 marks: Arguments supporting the statement (with specific examples).
- 2 marks: Arguments against the statement (with specific examples).
- 1 mark: Balanced evaluative conclusion.
- 1 mark: Quality of written communication and use of geographical terminology.
Question 16 [8 marks]
Evaluate the effectiveness of international agreements in addressing global resource depletion.
Model Answer:
Introduction: International agreements are a key mechanism for addressing transboundary and global resource challenges. However, their effectiveness varies significantly depending on enforcement mechanisms, political will, and the nature of the resource.
Effective examples:
- The Montreal Protocol (1987) is widely regarded as the most successful international environmental agreement. It phased out ozone-depleting substances (CFCs, HCFCs) through binding targets, trade restrictions on non-parties, and a multilateral fund to help developing countries comply. The ozone layer is projected to recover to 1980 levels by mid-century. Its success is attributed to clear scientific consensus, industry alternatives, and strong enforcement.
- The Paris Agreement (2015) has galvanised global climate action, with 195 parties submitting Nationally Determined Contributions (NDCs). While not yet sufficient to limit warming to 1.5°C, it has created a framework for ratcheting up ambition over time and has driven significant investment in renewable energy.
Less effective examples:
- The Kyoto Protocol (1997) had limited impact because major emitters (the USA) did not ratify it, and developing countries (China, India) had no binding targets. Global emissions continued to rise.
- CITES (Convention on International Trade in Endangered Species) has had mixed results. While it has helped protect species like elephants (through ivory trade bans), enforcement is weak in many countries, and illegal wildlife trade continues to thrive, worth an estimated $23 billion annually.
- The UN Sustainable Development Goals (2015) include Goal 12 (Responsible Consumption and Production) and Goal 15 (Life on Land), but they are non-binding and progress has been slow. Deforestation and overfishing continue at alarming rates.
Reasons for variable effectiveness:
- Lack of enforcement mechanisms: Most agreements rely on voluntary compliance and peer pressure rather than penalties.
- Sovereignty concerns: Nations resist external interference in domestic resource management.
- Free-rider problem: Countries may benefit from others' efforts without contributing themselves.
- Conflicting national interests: Economic priorities often override environmental commitments.
Conclusion: International agreements can be effective when they have strong scientific backing, binding targets, enforcement mechanisms, and financial support for compliance. The Montreal Protocol demonstrates this. However, many agreements lack these features and serve primarily as frameworks for cooperation rather than drivers of real change. Effectiveness depends on political will and the alignment of national interests with global goals.
Marking Scheme (8-mark essay):
- 2 marks: Introduction with clear scope and definition of effectiveness.
- 2 marks: At least one example of an effective agreement with explanation.
- 2 marks: At least one example of a less effective agreement with explanation.
- 1 mark: Analysis of reasons for variable effectiveness.
- 1 mark: Evaluative conclusion and quality of written communication.
Question 17 [8 marks]
"Technological innovation alone cannot achieve resource sustainability." Discuss.
Model Answer:
Introduction: Technological innovation is often presented as the key solution to resource sustainability challenges. While technology is essential, it is insufficient on its own without complementary changes in policy, behaviour, and governance.
Why technology is important:
- Renewable energy technologies (solar PV, wind turbines) have dramatically reduced in cost — solar PV costs fell by 89% between 2010 and 2022 — making clean energy economically competitive with fossil fuels.
- Precision agriculture uses GPS, drones, and sensors to optimise water, fertiliser, and pesticide use, reducing waste and environmental impact.
- Desalination technology has expanded freshwater availability in water-scarce regions like Israel and Singapore.
- Carbon capture and storage (CCS) technology offers the potential to reduce emissions from existing fossil fuel infrastructure.
Why technology alone is insufficient:
- Rebound effects (Jevons Paradox): Efficiency gains can lead to increased consumption rather than reduced resource use. For example, more fuel-efficient cars may encourage more driving, offsetting the per-km savings. LED lighting is 90% more efficient than incandescent bulbs, but global lighting energy consumption has continued to rise due to increased use.
- Access and equity: Advanced technologies are often expensive and concentrated in developed countries. Smallholder farmers in Sub-Saharan Africa cannot afford precision agriculture, and many developing nations lack the infrastructure for renewable energy deployment.
- Political and institutional barriers: Even when technology exists, political inertia, lobbying by incumbent industries, and lack of regulatory frameworks can prevent adoption. Fossil fuel subsidies globally exceeded $5.9 trillion in 2020 (IMF estimate), undermining the economic case for renewables.
- Behavioural factors: Technology does not automatically change consumption patterns. Without education, incentives, and cultural shifts, people may not adopt sustainable technologies or may use them unsustainably.
- Unintended consequences: Some technologies create new problems. Electric vehicle batteries require lithium and cobalt, the mining of which causes environmental degradation and human rights concerns in countries like the DRC.
Conclusion: Technological innovation is a necessary but not sufficient condition for resource sustainability. It must be accompanied by effective governance, equitable access, behavioural change, and systemic shifts in economic models. A purely techno-optimistic approach risks ignoring the social, political, and economic dimensions of sustainability.
Marking Scheme (8-mark essay):
- 2 marks: Introduction defining technology and sustainability.
- 2 marks: Arguments for the importance of technology (with specific examples).
- 2 marks: Arguments for why technology alone is insufficient (with specific examples).
- 1 mark: Balanced evaluative conclusion.
- 1 mark: Quality of written communication and geographical terminology.
Question 18 [8 marks]
Assess the role of population growth in threatening global food and water security.
Model Answer:
Introduction: The global population reached 8 billion in 2022 and is projected to reach 9.7 billion by 2050 (UN). Population growth increases demand for food and water, but its impact is mediated by consumption patterns, technology, distribution, and governance.
Population growth as a threat to food security:
- More people require more food. The FAO estimates that food production must increase by 60% by 2050 to meet demand. This puts pressure on agricultural land, water resources, and ecosystems.
- Population growth is fastest in regions already facing food insecurity — Sub-Saharan Africa's population is projected to double by 2050, yet the region already has 280 million undernourished people.
- Rising populations drive urbanisation, converting agricultural land to urban use. China lost approximately 6% of its arable land to urbanisation between 1990 and 2010.
Population growth as a threat to water security:
- Water demand is projected to exceed supply by 40% by 2030 (UN Water). Population growth is a primary driver, particularly in water-stressed regions like the Middle East and North Africa.
- India's population of 1.4 billion places enormous pressure on the Ganges Basin and groundwater resources, with water tables falling by 1–3 metres per year in key agricultural regions.
However, population growth is not the only or primary factor:
- Consumption patterns matter more than absolute numbers. The average American consumes approximately 3,600 kcal/day (well above the 2,100 kcal requirement) and has a water footprint of 7,800 litres/day, while the average Ethiopian consumes 2,100 kcal/day and has a water footprint of 1,200 litres/day. A small population with high consumption can be more resource-depleting than a large population with low consumption.
- Food waste accounts for approximately one-third of all food produced globally (1.3 billion tonnes per year). Reducing waste could feed an additional 1.25 billion people without any increase in production.
- Technology and policy can decouple population growth from resource depletion. Israel feeds a growing population through drip irrigation and desalination. The Green Revolution doubled global cereal production between 1960 and 2090 while population grew by 150%.
- Distribution and governance failures cause scarcity even where resources are sufficient. South Sudan has abundant water and arable land but faces famine due to conflict and poor governance.
Conclusion: Population growth is a significant driver of food and water insecurity, particularly in regions with limited adaptive capacity. However, it is not the sole or even primary factor. Consumption patterns, waste, technology, governance, and distribution are equally or more important. Addressing resource security requires a multi-faceted approach that goes beyond population control.
Marking Scheme (8-mark essay):
- 2 marks: Introduction with context (population data, definitions).
- 2 marks: Explanation of how population growth threatens food and water security (with examples).
- 2 marks: Evaluation of other factors (consumption, waste, technology, governance) that mediate or exceed population's impact.
- 1 mark: Balanced conclusion.
- 1 mark: Quality of written communication and use of data/examples.
Question 19 [8 marks]
To what extent can urban areas become models of resource sustainability? Refer to specific examples in your answer.
Model Answer:
Introduction: Cities consume over 75% of global energy and produce over 70% of global CO₂ emissions, making urban sustainability critical. While cities concentrate environmental pressures, they also offer opportunities for efficient resource use through density, innovation, and governance.
Urban areas CAN be models of sustainability:
- Freiburg, Germany: The Vauban district was designed as a car-free, solar-powered neighbourhood. Over 65% of energy comes from renewables, and the district has achieved a 40% reduction in CO₂ emissions compared to conventional urban areas. Green building standards, district heating, and integrated public transport demonstrate how urban planning can drive sustainability.
- Curitiba, Brazil: Pioneered Bus Rapid Transit (BRT) in the 1970s, with 70% of commuters using public transport. The city has 52 m² of green space per capita (up from 0.5 m² in 1970) through a network of parks that also serve as flood management infrastructure.
- Singapore: Despite extreme density, Singapore has implemented the Four National Taps water strategy, extensive green building certification (Green Mark), and aims to halve emissions by 2050. The city-state demonstrates that high-density living can coexist with sustainability ambitions.
Limitations and challenges:
- Urban ecological footprints extend far beyond city boundaries. London's ecological footprint is 42 times its land area, drawing resources from across the globe. Cities may appear sustainable locally while displacing environmental costs elsewhere.
- Inequality within cities: Sustainable urban initiatives often benefit wealthier residents. In Cape Town, water-saving technologies are accessible to affluent households but not to informal settlement residents, who were most affected by the 2018 "Day Zero" water crisis.
- Lock-in to unsustainable infrastructure: Existing cities have decades of car-dependent infrastructure, making rapid transformation difficult. Los Angeles, despite ambitious climate plans, remains heavily car-dependent due to urban sprawl.
- Governance fragmentation: Many cities lack the authority or resources to implement comprehensive sustainability policies. In federal systems, national policies may conflict with urban sustainability goals.
Conclusion: Urban areas have significant potential to become models of resource sustainability through integrated planning, technology, and governance. Examples like Freiburg and Curitiba demonstrate this. However, the extent to which cities can achieve genuine sustainability is limited by their extended ecological footprints, internal inequalities, infrastructure lock-in, and governance constraints. Cities can be more sustainable, but claiming they can be fully sustainable models without addressing these systemic issues would be an overstatement.
Marking Scheme (8-mark essay):
- 2 marks: Introduction with context (urban resource consumption data).
- 2 marks: At least two specific examples of sustainable urban initiatives with explanation.
- 2 marks: Evaluation of limitations and challenges.
- 1 mark: Balanced evaluative conclusion ("to what extent").
- 1 mark: Quality of written communication and geographical terminology.
Question 20 [8 marks]
"The greatest barrier to achieving resource sustainability is political will, not technology or resources." Evaluate this statement.
Model Answer:
Introduction: Resource sustainability requires the right technology, sufficient resources, and the political will to implement solutions. This essay argues that while technology and resource constraints are real, political will is indeed the most critical barrier, though the three are deeply interconnected.
Political will as the greatest barrier:
- Fossil fuel subsidies: Despite clear evidence that fossil fuels drive climate change, governments globally subsidised fossil fuels to the tune of $5.9 trillion in 2020 (IMF). This reflects political capture by fossil fuel lobbies and short-term electoral incentives rather than rational resource management.
- Short-termism in politics: Electoral cycles (typically 4–5 years) incentivise politicians to prioritise immediate economic growth over long-term sustainability. Climate action, which requires decades of consistent policy, is particularly vulnerable to this. The USA's withdrawal from the Paris Agreement under the Trump administration (2017–2021) exemplifies how a single election can reverse years of progress.
- Sovereignty and free-riding: International agreements are weakened by nations prioritising national interests over collective action. Australia continued to expand coal exports while pledging emissions reductions, illustrating the gap between rhetoric and action.
- Corruption and weak governance: In many resource-rich developing countries, corruption diverts resource revenues away from sustainable management. Nigeria's oil wealth has not translated into broad-based development or environmental protection due to corruption and mismanagement.
Counter-argument: Technology and resources ARE significant barriers:
- For some challenges, technology is still insufficient. Battery storage for renewable energy remains expensive and limited in scale. Green hydrogen is promising but not yet commercially viable at scale.
- Some regions genuinely lack resources. Small island developing states (SIDS) like Tuvalu face existential threats from sea level rise regardless of political will — they lack the land area and financial resources to adapt.
- Developing countries may lack the institutional capacity to implement even well-intentioned policies. Sub-Saharan Africa's limited infrastructure constrains renewable energy deployment.
Synthesis: While technology and resource constraints are real, they are often symptoms of insufficient political will. Where political will exists, technology is developed and resources are mobilised. The Montreal Protocol succeeded because governments committed to action and funded the transition. The technology to address many sustainability challenges already exists — solar, wind, drip irrigation, recycling — but deployment is slowed by political inertia, vested interests, and short-term thinking. In this sense, political will is the meta-barrier that determines whether technology and resources are effectively deployed.
Conclusion: Political will is the greatest barrier because it is the enabling condition for deploying technology and mobilising resources. Without political commitment, even abundant resources and advanced technologies will not be used sustainably. However, it is important to recognise that political will is shaped by economic structures, public awareness, and social movements — it does not exist in a vacuum.
Marking Scheme (8-mark essay):
- 2 marks: Introduction defining political will and outlining the argument.
- 2 marks: Arguments supporting the statement (with specific examples of political failures).
- 2 marks: Counter-arguments (technology and resource constraints as barriers, with examples).
- 1 mark: Synthesis/evaluation weighing the arguments.
- 1 mark: Quality of written communication and geographical terminology.
Marking Summary
| Question | Marks | Question | Marks |
|---|---|---|---|
| 1 | 4 | 11 | 4 |
| 2 | 4 | 12 | 4 |
| 3 | 5 | 13 | 5 |
| 4 | 5 | 14 | 4 |
| 5 | 6 | 15 | 8 |
| 6 | 3 | 16 | 8 |
| 7 | 6 | 17 | 8 |
| 8 | 4 | 18 | 8 |
| 9 | 2 | 19 | 8 |
| 10 | 3 | 20 | 8 |
| Total | 60 |
End of Answer Key
Free quiz and exam paper access
Enter your details to view this paper
Your access is remembered on this device.